X-rays from the Highly Polarized Broad Absorption Line QSO CSO 755
Abstract
We present results from a BeppoSAX observation of the BAL QSO CSO 755, observed as part of our program to investigate the X-ray properties of highly polarized BAL QSOs. CSO 755 is clearly detected by the BeppoSAX MECS, making it the highest redshift () and most optically luminous () BAL QSO seen in X-rays. It is detected in several energy bands including the rest-frame 21–39 keV band, but we are only able to place loose constraints upon its X-ray spectral shape. Our X-ray detection is consistent with the hypothesis that the BAL QSOs with high optical continuum polarization tend to be the X-ray brighter members of the class. We examine a scattering interpretation of a polarization/X-ray flux connection, and we discuss the data needed to prove or refute such a connection. We also discuss a probable ROSAT detection of CSO 755. The observed-frame 2–10 keV flux from BeppoSAX ( erg cm-2 s-1) is high enough to allow XMM spectroscopy, and studies of iron K line emission should prove of particular interest if a large amount of scattered X-ray flux is present.
1 Introduction
The ejection of matter at moderate to high velocities is a common and perhaps universal phenomenon of Quasi-Stellar Objects (QSOs). One of the main manifestations of QSO outflows is the blueshifted UV Broad Absorption Lines (BALs) seen in % of optically selected QSOs, the BAL QSOs (e.g., Weymann 1997). X-ray spectroscopy of BAL QSOs is potentially important for studying their outflows and nuclear geometries, but the study of BAL QSOs in the X-ray regime has not yet matured, largely due to low X-ray fluxes (e.g., Green & Mathur 1996; Gallagher et al. 1999). Only BAL QSOs have been detected in X-rays at present. The current data suggest that the X-ray emission from BAL QSOs suffers from significant intrinsic absorption, with many BAL QSOs having absorption column densities (1–5) cm-2. Optical brightness is not a good predictor of X-ray brightness for BALQSOs; some optically faint BAL QSOs have been clearly detected (e.g., PHL 5200; ) while some of the optically brightest (e.g., PG ; ) remain undetected in deep 0.1–10 keV observations. In the limited data available at present, however, there is a suggestion that the BAL QSOs with high (%) optical continuum polarization may be the X-ray brighter members of the class (see §4 of Gallagher et al. 1999). A polarization/X-ray flux connection, if indeed present, would provide a clue about the geometry of matter in BAL QSO nuclei (see §3).
To improve understanding of the X-ray properties of BAL QSOs and examine the possible polarization/X-ray flux connection, we have started a program to observe highly polarized BAL QSOs in X-rays. An excellent target for this program was the Case Stellar Object 755 (CSO 755; ; Sanduleak & Pesch 1989), which has (e.g., Barlow 1993) and is a representative, ‘bona-fide’ BAL QSO in terms of its luminosity and UV absorption properties (e.g., Glenn et al. 1994). Its continuum polarization is high ( 3.8–4.7%; only 8/53 BAL QSOs studied by Schmidt & Hines 1999 had %) and rises to the blue.
We adopt km s-1 Mpc-1 and . The Galactic neutral hydrogen column density towards CSO 755 is cm-2 (Stark et al. 1992).
2 Observations, Analysis and Results
We observed CSO 755 with BeppoSAX (Boella et al. 1997) on 1999 Feb 2. We will focus on the results from the Medium-Energy Concentrator Spectrometers (MECS; 1.8–10 keV; 35.2 ks exposure) and Low-Energy Concentrator Spectrometer (LECS; 0.1–4 keV; 12.7 ks exposure), since the data from the other instruments are not useful for such a faint source. Our energy coverage corresponds to 0.4–39 keV in the rest frame. The observation went smoothly, and the resulting data were processed with Version 1.2 of the BeppoSAX Science Data Center (BSDC) pipeline. We have adopted the standard reduction methods recommended by the BSDC (Fiore, Guainazzi & Grandi 1999), and we do not observe any irregular background variability.
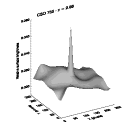
The screened events resulting from the above reduction were analyzed using xselect. We made full-band images for each of the detectors as well as combined MECS2+MECS3 images. An X-ray source consistent with the precise optical position of CSO 755 is detected with high statistical significance in our MECS2, MECS3 and MECS2+MECS3 images (e.g., Figure 1), but it is not detected by the LECS. Given the observed flux (see below), the probability of a confusing source is , and no particularly suspicious sources are found in the Palomar Optical Sky Survey or the ned/simbad catalogs. To determine MECS count rates, we have used a -radius circular source cell centered on the X-ray centroid. For background subtraction, we use five -radius circular cells near CSO 755 (we have not used an annulus because a weak nearby source would fall inside the annulus). We have corrected for energy-dependent vignetting of the background following §3.1.5 of Fiore et al. (1999). In the MECS2+MECS3 full-band (1.8–10 keV) image, we detect counts from CSO 755 for a MECS2+MECS3 count rate of count s-1. The LECS upper limit on the 0.1–1.8 keV count rate is count s-1 (computed using a circular source cell with a radius).
While we do not have enough photons for spectral fitting, we have analyzed MECS2+MECS3 images in three observed-frame energy bands to place crude constraints on spectral shape: 1.8–3 keV (band 1; channels 40–66), 3–5.5 keV (band 2; channels 67–120), and 5.5–10 keV (band 3; channels 121–218). CSO 755 is detected in all bands, although with varying degrees of statistical significance. We give the corresponding count rates in Table 1, and the Poisson probabilities of false detections in bands 1, 2 and 3 are , and , respectively. The detection in band 3 (21–39 keV in the rest frame) is notable.
To compare the observed spectral shape with spectral models, we have employed a band-fraction diagram similar to those used in studies of the diffuse soft X-ray background (e.g., see §5 of Burstein et al. 1977). We first consider a simple power-law model with photon index, 1.7–1.9 (a typical, representative range for radio-quiet QSOs; e.g. Reeves et al. 1997), and neutral absorption at . For this model, Figure 2 shows that column densities less than cm-2 are most consistent with our data. Alternatively, for small column densities, values of down to are most consistent with our data (i.e. the spectrum could be as flat as that for a ‘reflection-dominated’ source). Incorporating the LECS upper limit into similar analyses does not significantly tighten our constraints.
If we consider a power-law model with the Galactic column density, we calculate an observed-frame 2–10 keV flux of erg cm-2 s-1, corresponding to a rest-frame 7.8–39 keV luminosity of erg s-1. These two quantities are relatively insensitive to the internal column density for cm-2. If we extrapolate this model into the rest-frame 2–10 keV band, the luminosity is erg s-1.
We have also calculated (the slope of a hypothetical power law between 3000 Å and 2 keV in the rest frame), since this parameter can be used as a statistical predictor of the presence of X-ray absorption (e.g., Brandt, Laor & Wills 1999). We calculate the rest-frame 3000 Å flux density using the observed-frame 7500 Å flux density of Glenn et al. (1994) and a continuum spectral index of . The rest-frame flux density at 2 keV is more difficult to calculate since we do not have strong constraints on X-ray spectral shape or a BeppoSAX detection at keV (although see our discussion of the ROSAT data below). If we normalize a power-law model with Galactic absorption to the rest frame 7–39 keV count rate (corresponding to 1.8–10 keV in the observed frame), we calculate . Of course, this value is really telling us about the rest-frame 7–39 keV emission rather than a directly measured flux density at 2 keV.
We have searched for any Einstein, ROSAT or ASCA pointings that serendipitously contain CSO 755, but unfortunately there is none. We have also analyzed the data from the ROSAT All-Sky Survey (RASS). CSO 755 was observed for 939 s during the RASS between 1990 Dec 31 and 1991 Jan 4 (a relatively long RASS exposure; see Figure 2 of Voges et al. 1999). There appears to be an -photon enhancement over the average background at the position of CSO 755. Comparative studies of RASS and pointed data show that 90% of such 7-photon RASS sources are real X-ray sources rather than statistical fluctuations, and CSO 755 is included in the Max-Planck-Institut für Extraterrestrische Physik RASS faint source catalog (Voges et al., in preparation) with a likelihood of 11 (see Cruddace, Hasinger & Schmitt 1988). However, to be appropriately cautious we shall treat the probable RASS detection as tentative. The probable RASS detection corresponds to a vignetting-corrected flux in the observed 0.1–2.4 keV band of erg cm-2 s-1 (for a power-law model with and the Galactic absorption column). Given the relative effective areas and imaging capabilities of the ROSAT PSPC and BeppoSAX LECS, a RASS detection is consistent with the LECS upper limit given in Table 1 (see Figure 2 of Parmar et al. 1999). Provided there is not substantial intrinsic X-ray absorption below the MECS band, the relative RASS and MECS fluxes are entirely plausible. If we use the ROSAT flux to normalize a power law with Galactic absorption, we calculate . If ROSAT has indeed detected CSO 755, the ROSAT band has the advantage that it directly constrains the rest-frame 2 keV flux density.
3 Discussion and Conclusions
Our BeppoSAX and probable ROSAT detections of CSO 755 make it the highest redshift as well as the most optically luminous BAL QSO detected in X-rays. It was selected for study not based upon high optical flux but rather based on its high (observed-frame) optical continuum polarization (3.8–4.7%; hereafter OCP), and it is X-ray brighter than several other BAL QSOs that have 4–6 times its -band flux (compare with Gallagher et al. 1999). While its higher X-ray flux could partially result from the higher redshift providing access to more penetrating X-rays (i.e. a ‘negative -correction’), there is also suggestive evidence that the BAL QSOs with high OCP may be the X-ray brighter members of the class.
We have investigated the OCP percentages of the 10 BAL QSOs (including CSO 755) with reliable X-ray detections using the data from Berriman et al. (1990), Hutsemékers, Lamy & Remy (1998), Ogle (1998) and Schmidt & Hines (1999). The OCP percentages have a mean of , a standard deviation of 0.88, and a median of 2.24. These values indeed place the X-ray detected BAL QSOs toward the high end of the BAL QSO OCP distribution function (compare with §2 of Schmidt & Hines 1999). At present, however, our nonparametric testing is unable to prove that the X-ray detected BAL QSOs have higher OCPs than those that are undetected in sensitive X-ray observations. This is due to small sample sizes as well as concerns about possible secondary correlations and observational biases. Many of the BAL QSOs with high-quality X-ray data have been observed because they have exceptional properties (e.g., low-ionization absorption, extreme Fe ii emission), and thus the currently available sample is not necessarily representative of the population as a whole. In addition, the current X-ray and polarization observations of BAL QSOs span a wide range of rest-frame energy/wavelength bands due to redshift and instrumentation differences (redshifts for the 10 X-ray detected BAL QSOs run from 0.042–2.88). At higher redshifts one samples harder X-rays that are less susceptible to absorption. Also at higher redshifts, observed-frame OCP measurements tend to sample shorter wavelengths, and many QSOs show polarization that rises towards the blue. Systematic X-ray and polarimetric observations of uniform, well-defined BAL QSO samples are needed to examine this issue better.
A polarization/X-ray flux connection could be physically understood if the direct lines of sight into the X-ray nuclei of BAL QSOs were usually blocked by extremely thick matter ( cm-2). In this case, we could only see X-rays when there is a substantial amount of electron scattering in the nuclear environment by a ‘mirror’ of moderate Thomson depth.555Ogle (1998) suggests that there is a large range of mirror optical depths among the BAL QSO population. The scattering would provide a periscopic, indirect view into the compact X-ray emitting region while also polarizing some of the more extended optical continuum emission (see Figure 3). Measured X-ray column densities would then provide information only about the gas along the indirect line of sight. For CSO 755, the X-ray scattering medium would need to be located on fairly small scales ( a few light weeks) to satisfy the spectropolarimetric constraints of Glenn et al. (1994) and Ogle (1998). These show that the material scattering the optical light is located at smaller radii than both the Broad Line Region (BLR) and BAL region.
Our calculations in §2 give an value of 1.6, although our only direct constraint on the rest-frame 2 keV flux density is via the probable ROSAT detection. Our value is entirely consistent with those of typical radio-quiet QSOs (compare with Figure 1 of Brandt, Laor & Wills 1999), and it is smaller than those of many BAL QSOs (e.g. Green & Mathur 1996). A ‘normal’ value would appear somewhat surprising in the context of the scattering model of the previous paragraph, since one would expect the X-ray flux level to be reduced if the direct line of sight is blocked. However, there is enough dispersion in the distribution that the observed value of does not cause a serious problem, provided the scattering is efficient. The scattering mirror would need to subtend a fairly large solid angle (as seen by the compact X-ray source) and have a moderate Thomson depth (say ). In addition, there may be ‘attenuation’ at 3000 Å (in the sense of §2 of Goodrich 1997) that helps to flatten .
Finally, we note that CSO 755 has a high enough X-ray flux to allow moderate quality X-ray spectroscopy and variability studies with XMM. It is currently scheduled for a 5 ks XMM observation, but this is an inadequate exposure time for such work. A longer XMM exposure would allow a study of any iron K spectral features, and the high redshift of CSO 755 moves the iron K complex right to the peak of the XMM EPIC spectral response. If we are viewing a large amount of scattered X-ray flux in CSO 755 and other high polarization BAL QSOs, then narrow iron K lines with large equivalent widths may be produced via fluorescence and resonant scattering (as for the much less luminous Seyfert 2 galaxies; e.g., Krolik & Kallman 1987). Such lines could allow direct detection of the X-ray scattering medium, and line energies and blueshifts/redshifts would constrain the ionization state and dynamics of the mirror. We would also not expect rapid ( day) and large-amplitude X-ray variability if most of the X-ray flux is scattered.
References
- (1)
- (2) Barlow, T. A. 1993, PhD thesis, UC San Diego
- (3)
- (4) Boella, G., Butler, R. C., Perola, G. C., Piro, L., Scarsi, L. & Bleeker, J. 1997, A&AS, 122, 299
- (5)
- (6) Brandt, W. N., Laor, A. & Wills, B. J. 1999, ApJ, in press (astro-ph/9908016)
- (7)
- (8) Berriman, G., Schmidt, G. D., West, S. C. & Stockman, H. S. 1990, ApJS, 74, 869
- (9)
- (10) Burstein, P., Borken, R. J., Kraushaar W. L. & Sander, W. T. 1977, ApJ, 213, 405
- (11)
- (12) Cruddace, R. G., Hasinger, G. R. & Schmitt, J. H. M. M. 1988, in Astronomy from Large Databases: Scientific Objectives and Methodological Approaches, ed. Murtagh, F. & Heck, A. (ESO Press, Garching), p. 177
- (13)
- (14) Ebeling, H., White, D. A. & Rangarajan, F. V. N. 1999, MNRAS, in press
- (15)
- (16) Fiore, F., Guainazzi, M. & Grandi, P. 1999, Cookbook for NFI Scientific Data Analysis. BeppoSAX Science Data Center, Rome
- (17)
- (18) Gallagher, S. C., Brandt, W. N., Sambruna, R. M., Mathur, S. & Yamasaki, N. 1999, ApJ, 519, 549
- (19)
- (20) Glenn, J., Schmidt, G. D. & Foltz, C. B. 1994, ApJ, 434, L47
- (21)
- (22) Goodrich, R. W. 1997, ApJ, 474, 606
- (23)
- (24) Green, P. J. & Mathur, S. 1996, ApJ, 462, 637
- (25)
- (26) Hutsemékers, D., Lamy, H. & Remy, M. 1998, A&A, 340, 371
- (27)
- (28) Krolik, J. H. & Kallman, T. R. 1987, ApJ, 320, L5
- (29)
- (30) Lyons, L. 1991, Data Analysis for Physical Science Students, Cambridge University Press, Cambridge
- (31)
- (32) Ogle, P. M. 1998, PhD thesis, California Institute of Technology
- (33)
- (34) Parmar, A. et al. 1999, A&A, in press (astro-ph/9902075)
- (35)
- (36) Reeves, J. N., Turner, M. J. L., Ohashi, T. & Kii, T. 1997, MNRAS, 292, 468
- (37)
- (38) Sanduleak, N. & Pesch, P. 1989, ApJS, 70, 173
- (39)
- (40) Schmidt, G. D. & Hines, D. C. 1999, ApJ, 512, 125
- (41)
- (42) Stark, A. A., Gammie, C. F., Wilson, R. W., Bally, J., Linke, R.A., Heiles, C. & Hurwitz, M. 1992, ApJS, 79, 77
- (43)
- (44) Voges, W. et al. 1999, A&A, in press
- (45)
- (46) Weymann, R. J. 1997, in Mass Ejection from AGN, ed. Arav, N., Shlosman, I. & Weymann, R. J. (ASP Press: San Francisco), p. 3
- (47)
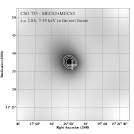


TABLE 1
Count Rates in the Observed Frame
| Instrument & | Count Rate / |
|---|---|
| Energy Band | (10-4 Count s-1) |
| BeppoSAX LECS | |
| 0.1–1.8 keV | |
| BeppoSAX MECS2+MECS3 | |
| 1.8–3 keV (band 1) | |
| 3–5.5 keV (band 2) | |
| 5.5–10 keV (band 3) | |
| 1.8–10 keV (full band) |