UV rest frame spectroscopy of four high redshift (2) active galaxies.
Abstract
We present UV spectra of a small sample of high redshift active galaxies: the hyperluminous, gravitationally lensed system SMM J02399-0136 (2.8) and three powerful radio galaxies (2.5).
Extended continuum and emission lines are detected in all objects. The three radio galaxies present typical spectra with dominant Ly and weaker CIV1550, HeII1640 and CIII]1909. The spectrum of SMM J02399-0136 is strikingly different, showing relatively weak Ly and HeII and strong NV1240 relative to the C lines.
We find that the weakness of HeII can be explained if the intermediate density narrow line region (105-6 cm-3) dominates the emission line spectrum, rather than the more extended low density gas (100 cm-3). The line ratios of MRC2025-218 suggest that this is also the case in this object.
MRC2025-218 and SMM J02399-0136 show the largest NV/HeII and NV/CIV values found in high redshift radio galaxies. The failure of solar abundance models to explain these line ratios and studies of metal abundances in high redshift quasars and radio galaxies, suggest that nitrogen is overabundant in the ionized gas of these objects. Alternative possibilities which we discuss include NV emission from the broad line region and differential amplification by a gravitational lens.
We report the discovery of a P Cygni profile in the CIV line in the spectrum of MRC2025-218. We detect also CII1334.5 in absorption and PCygni profiles for the lines SiIV1393.8,1402.8. We do not detect any purely photospheric stellar lines. The nature of the absorption features is not clear. It could be due to stars or an associated absorption line system.
1 Introduction
High redshift radio galaxies (HzRG) (redshift 2) were until a few years ago the most distant “galaxies” (or proto-galaxies) we could study. They had a crucial role as probes of the distant universe. In the late 90’s thanks to the Hubble Space and Keck telescopes, many star forming galaxies have been discovered at 3-4 (see for instance the recent work of Pettini, Steidel, Giavalisco). The advantage of these objects is that, unlike HzRG, the emission is not influenced by the nuclear activity. The study of the stellar component (crucial in Cosmology and galaxy formation studies) is in principle easier, since the emission is dominated by the stars.
The very blue continuum observed in HzRG suggested the presence of young stars (e.g. Lilly, Longair & McLean lilly83 (1983)) and it was believed that we were observing galaxies in the process of formation. However, it was discovered later that at least an important contribution to the continuum radiation is not stellar, but a consequence of the nuclear activity.
One of the most interesting properties of HzRG is the so called alignment effect (observed at 0.7): the continuum and emission line structures are extended and closely aligned with the radio axis (Chambers et al. chamb87 (1987), McCarthy et al. mac87 (1987)). The nature of this phenomenon is controversial but it suggests that the continuum and line emission are closely linked to the nuclear activity, rather than being due to the stellar population characteristic of a galaxy in the process of formation. Three main mechanisms have been proposed to explain the alignment effect and all of them could play a role: 1) scattered light from a quasar hidden from the line of sight (Tadhunter, Fosbury & di Serego Alighieri tad89 (1989)) 2) young stars whose formation is triggered by the passage of the radio jet through the ambient gas (Rees rees89 (1989)) 3) nebular continuum (Dickson et al. dickson95 (1995)). The discovery of polarized continuum with the electric vector perpendicular to the axis of the UV structures provides strong evidence for the existence of scattered light in many HzRG at 2 (Cimatti et al. cim96 (1996), cim97 (1997), cim98 (1998)). Compelling evidence for a young stellar population in a HzRG does not exist yet, except possibly for 4C41.17 (3.8) (Dey et al. dey97 (1997)). In any case, the observed properties of HzRG are a consequence (at least in the UV rest frame) of the nuclear activity.
In spite of this complexity, HzRG still have a crucial role in the understanding of galaxy formation, since they are the only way we have to study the early stages of giant ellipticals. Since all powerful radio galaxies at low redshift are giant ellipticals and there is evidence that this is also the case at 1 (Best, Longair & Röttgering best98 (1998)), it is believed that the host galaxies of radio galaxies at higher redshifts are also giant ellipticals (Pentericci et al. pente99 (1999)). It is however necessary to understand how the nuclear activity influences what we see in order to make a correct interpretation of the observed properties.
Another interesting aspect is the relationship between the rapid phase(s) of star formation and the formation and fuel‘ing of a massive black hole during the formation of these galaxies which are destined to become the massive ellipticals we see today. Exactly what this relationship is is not clear although interactions/mergers are likely to play a role.
It has been proposed that ultraluminous infrared galaxies (ULIRGs) are progenitors of the giant ellipticals of today (Kormendy & Sanders, 1992). On the other hand, Sanders et al. (sand88 (1988)) suggested that ULIRGs will evolve into quasars. While there is a continuing debate about what powers these galaxies (starburst or active galactic nuclei (AGN)) it is clear that 1) ULIRGS show clear evidence for interactions/mergers (e.g. Borne et al. borne99 (1999), Sanders et al. sand88 (1988)) 2) some, at least, contain powerful AGN (e.g. Sanders et al. sand88 (1988)).
A population of luminous galaxies in the submillimetre wavelengths has been discovered in recent years. Studies of the spectral energy distributions suggest that these are the analogues at high redshift of ULIRGs at low redshift (e.g. Sanders & Mirabel sand96 (1996)). As for many local ULIRGS, it is not clear whether these galaxies are powered by starburst or active galactic nuclei. The study of distant ultraluminous submm sources can provide important information about the nature of ULIRGs and how a massive black hole forms at high redshift and coexists with a powerful starburst. The interpretation of the ISM properties of these objects in the context of distant radio galaxies then becomes crucial.
We study here the UV (rest frame) spectra of three HzRG and the hyperluminous submillimetre source SMM J02399-0136 (2.8).
2 Description of the objects
Our sample consists of the following objects:
-
•
SMM J02399-0136 (2.80) is described in detail by Ivison et al. (iv99 (1999)). We summarize here the main properties. This source is an hyperluminous active galaxy detected in a submm survey with SCUBA. It is gravitationally lensed by a foreground cluster, which amplifies its luminosity by a factor of 2.5. Optical imaging shows two main optical components (named L1 and L2 by Ivison et al. iv98 (1998) [IV98 thereafter]) separated by 3 arc sec. Both components emit weak continua and narrow emission lines (1000-1500 km s-1) that show a type 2 AGN in L1 (Seyfert or narrow line quasar). Radio observations reveal a very weak extended source. The far infrared (FIR) luminosity is (after correction for lensing) 5 times higher than in the hyperluminous Seyfert 2 FSC10214+4724 (although uncertainties remain about the exact amplification in this object). It is not clear whether the bulk of IR emission is due to dust heated by the active nucleus or by stars. If OB stars are responsible, the FIR luminosity indicates a star forming rate (SFR) (M10 M⊙) of 2000 M⊙ yr-1. The source has been also detected in CO showing an unresolved (5 arc sec) emission spatially coincident with L1. The gas mass implied by the data is 1011 M⊙. IV98 propose that this source is associated with a massive starburst.
-
•
MRC2025-218 (2.63) was observed by McCarthy et al. (mac90 (1990)) as part of a sample of southern hemisphere radio galaxies selected from the Molongo Reference Catalogue. HST images show that the host galaxy has a compact morphology in the optical (UV rest frame), consisting of a bright nucleus and two smaller components. Extended low surface brightness emission elongated and aligned with the radio axis is also detected. The galaxy is embedded in a very large halo of ionized gas extended well beyond the radio source (Pentericci et al. pente99 (1999), McCarthy et al. mac90 (1990)). Near-IR images (optical rest frame) show that the galaxy is quite compact (McCarthy, Perston & Eisenhardt mac92 (1992), van Breugel et al. breu99 (1999)) and fairly symmetric.
The UV (rest-frame) spectrum shows strong, spatially extended emission lines (McCarthy et al. mac90 (1990), Villar-Martín et al. vill99 (1999), VBF99 hereafter), that reveals complex kinematics in the extended gas. Strong continuum emission aligned with the radio axis is also detected. Its nature is uncertain but its high level of polarization (Cimatti et al. cim94 (1996)) shows that the contribution of a scattered component is important. The authors found that the rest frame UV continuum emission is linearly polarized (8.32.3%) with the electric vector perpendicular to the UV emission axis. Any valid model for the spectral energy distribution (SED) requires at least two components: a polarized scattered component in the UV and a redder, probably unpolarized component, best represented by an evolved stellar population with a minimum age of about 2 Gyr. A nebular component associated with the line emitting gas is also required.
-
•
MRC1558-003 (2.53) was part of the sample of ultra steep spectrum (USS) radio sources of Röttgering et al. (rott95 (1995)). R band CCD images show a rather small source extended (1.8 arc sec is the largest extension) along position angle (PA) 50°. The radio axis PA is 75° (Röttgering et al. rott94 (1994)). UV (rest frame) spectroscopy shows strong Ly emission along the radio axis direction with a bright component and more diffuse emission extending for at least 15 arc sec. CIV is also extended. The lines show complex kinematics in the extended gas with FWHM1000-1500 km s-1 (VMBF99).
-
•
MRC2104-242 (2.49) was also observed by McCarthy et al. (mac90 (1990)) selected from the Molongo Reference Catalogue. Broad band images (McCarthy et al. mac90 (1990)) show two bright clumps between the radio lobes and aligned with them. Narrow band Ly images show emission extended over more than 15 arc sec along the radio axis. A large halo of diffuse emission seems to surround the entire object. The two main blobs emit continuum and strong emission lines. UV (rest frame) spectroscopy reveals complex kinematics with FWHM1500 km s-1 (McCarthy, Baum & Spinrad mac96 (1996), VMBF99). HST images (Pentericci et al. pente99 (1999)) show that the host galaxy is very clumpy. There is also a narrow filament extending for 2 arc sec and aligned with the radio axis within a few degrees.
3 Observations and Data Reduction
The spectroscopic observations were carried out on the nights 1997 July 3-5 and 1998 July 25-27 using the EMMI multi-purpose instrument at the NTT (New Technology Telescope) in La Silla Observatory (ESO-Chile). The observations are described in detail in VMBF99.
The data reduction was done using standard methods in IRAF. The spectra were bias subtracted and divided by a normalized flat-field frame (dome flat-field). Illumination corrections along the slit were found to be negligible. The spectra were calibrated in wavelength using comparison spectra of HeAr. Cosmic rays were removed automatically (we obtained at least three similar frames for each object). Sky lines were subtracted and the spectra corrected for atmospheric extinction with the aid of mean extinction coefficients for La Silla. For each night we built a mean response curve from the standard stars observed that night with a wide slit (5 arc sec). Each object frame was flux calibrated with the corresponding response curve. The spectra were also corrected for galactic reddening. The reddening values were based on Burstein and Heiles (burs84 (1984)) maps, using empirical selective function of Cardelli, Clayton & Mathis (card89 (1989)). The redshifted CIII]1909 for SMM J02399-0136 is contaminated by the atmospheric absorption band at 7250 Å. We created the spectrum of the atmospheric band from the 1-D spectrum of a standard star taken with the same slit width as the one used for the radio galaxy (1.5 arc sec). We fitted the continuum and divided the original spectrum by the fit. By removing the absorption features intrinsic to the star, we obtained the spectrum of the atmospheric band. We divided the spectrum of SMM J02399-0136 by it trying different factors. Our conclusion is that the remaining effect of the atmospheric absorption is negligible after correction.
Both IRAF and STARLINK (DIPSO) routines were used to measure the emission line fluxes, FWHMs and wavelengths. 1-D spectra were extracted for all objects from apertures described below. We then fitted Gaussian profiles to the lines. The measured flux and FWHM of the spectral line are the values measured from the fit of the Gaussian. The instrumental profile was subtracted from the observed FWHM in quadrature.
4 Results

4.1 The spectra
The spatially integrated spectra of our objects are shown in Fig. 1. We extracted each spectrum from an aperture inside which the weakest lines were detected with higher S/N: MRC2025-218 (1.9 arc sec, centered at the spatial continuum centroid); MRC2104-242 (5.9 arc sec centered at the intersection between the two bright clumps); MRC1558-003 (2.7 arc sec centered at the spatial position of centroid of the brightest Ly component). The two spectra of SMM J02399-0136 correspond to a) the whole system (L1+L2) (the spectrum was extracted form a 5.4 arc sec aperture covering the brightest emission of the L1+L2 components) and b) he AGN component, L1. (2.2 arc sec aperture centered at the centroid of Ly emission in L1)
| Line | ratios | |||||
| Target | F | Ly/CIV | NV/CIV | HeII/CIV | CIII]/CIV | |
| MRC2025-218 | 0.690.07 | 5.70.9 | 0.90.3 | 0.50.2 | 1.40.3 | |
| MRC2104-242 | 3.80.7 | 153 | 1 | 0.50.2 | 0.70.3 | |
| MRC1558-003 | 1.70.1 | 5.40.4 | 0.35 | 0.430.08 | 0.360.09 | |
| SMM J02399-0136 | 3.30.2 | 2.50.2 | 0.80.1 | 0.260.05 | 0.420.07 | |
| SMM J02399-0136L1 | 2.50.1 | 1.60.1 | 0.90.1 | 0.200.07 | 1.00.2 | |
| FWHM | (km s-1) | |||||
| Target | Ly | NV | CIV | HeII | CIII] | |
| MRC2025-218 | 700100 | 2800800 | 600200a | 600300 | 1400200 | |
| MRC2104-242 | 1300100 | 1000400 | 1000300 | |||
| MRC1558-003 | 800100 | 1000150 | 500200 | 850300 | ||
| SMM J02399-0136 | 1200100 | 2000300 | 1600100 | 1800600 | 1100700 | |
| SMM J02399-0136L1 | 1600100 | 2000300 | 1600100 | 2100600 | 61001200 |
| a The absorption on the blue side of the line (see below) has not been taken into account |
The spectra (except for SMM J02399-0136) are typical of HzRG. Ly is the strongest line and weaker CIV1550, HeII1640 and CIII]1909 are also detected. NV1240 is detected only in MRC2025-218 and SMM J02399-0136. This line is often not detected in HzRG (Röttgering et al. 1996). We compare in Fig. 2 the spectrum of L1 with an average spectrum of HzRG (Vernet et al. ver99 (1999)) and the hyperluminous (also gravitational lensed) Seyfert 2 galaxy FSC10214+4724 (Goodrich et al. goo96 (1998)). The differences are striking. L1 presents very weak HeII, strong NV and weak Ly compared to typical HzRG spectra. It is similar to FSC10214+4724 in the sense that Ly is weak and NV strong, but HeII is relatively much weaker in L1.
We present in Table 1 some parameters characterizing the main UV emission lines, resulting from 1-D Gaussian fits to the line profiles.
4.2 The spatial distribution of the continuum and the emission lines
We described in VMFB99 the spatial properties of the Ly emitting gas derived from the 2-D spectra. Here we present 1-D spatial profiles for Ly, the continuum and the strongest UV lines. We created the emission line spatial profiles by adding those pixels (in the dispersion direction) where a given line is detected and subtracting the underlying continuum from a window of identical size (in Å) close to the line. The continuum spatial profile was created using a much larger window to increase the S/N ratio (typically 100-150 pixels in the dispersion direction, i.e. 65-90 Å). We present in Fig. 3 the spatial profiles for the strongest lines and the continuum.
-
•
SMM J02399-0136: The two optical components (L1 and L2) identified by IV98 are clearly seen both in continuum (dominated by L1) and Ly (similar strength in both components) separated by 3 arc sec. L1 is detected in the other UV lines as well, but not L2 (the spatially integrated spectrum of L2 shows weak CIV). Both the Ly and the continuum profiles reveal a region beyond L2 (named L3 in the figures) up to 10 arc sec beyond the continuum centroid of L1. VMBF99 showed that Ly presents large velocity widths (1000 km s-1) in L3. No other lines are detected in this region except possibly CIV. L1 is rather compact, but it appears to be marginally resolved (1.45 arc sec, while the average seeing was 1.20 arc sec). It contains an unresolved component (WF/PC1 F702W and WFPC2 F336W images show an unresolved source at the L1 position with a FWHM of 0.1-0.2 arc sec [IV98]) and some extended emission.
-
•
MRC2025-218: The spatial profiles of Ly and the continuum reveal very different distributions. The continuum emission is extended, but the dominant component is just marginally resolved (1.3 arc sec while the average seeing was 1.1). Ly is more extended and the flux does not peak at the position of the continuum centroid, but it presents a plateau. CIV (maybe CIII] as well) are also extended. The 2-D spectrum (see VMBF99) reveals a bimodal distribution for Ly which was also mentioned by McCarthy et al. mac90 (1990)
-
•
MRC1558-003: The Ly profile reveals the presence of two main components separated by 9 arc sec: the main optical component and a region named A in the Figure. VMBF99 showed that this A region emits lines of large widths (FWHM1500 km s-1). Both components emit also CIV, CIII], HeII and continuum. The continuum and the emission lines (at least CIV and Ly) are spatially resolved in both regions.
-
•
MRC2104-242: Ly presents a bimodal distribution, clearly seen in CIV as well. Both components are spatially resolved. The centroids are separated by 7 arc sec. We do not present the spatial profile of the continuum in Fig. 3 because it is too noisy, but very weak continuum is detected associated with the two Ly components.

Therefore, all objects present extended continuum over several arc sec (up to 15 arc sec in SMM J02399-0136). The continuum in MRC2025-218, MRC1558-003 and SMM J02399-0136 is dominated by a bright component which is rather compact. It is probably unresolved in SMM J02399-0136 and marginally resolved in MRC2025-218. All objects show extended emission lines which present rather different spatial profiles compared to the continuum (compare, for instance, the Ly and continuum profiles in SMM J02399-0136 and MRC2025-218). Both lines and continuum reveal the presence of several spatially distinct regions.
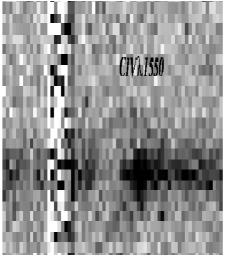
4.3 Absorption features in the spectrum of MRC2025-218
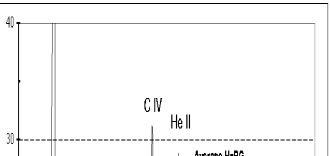
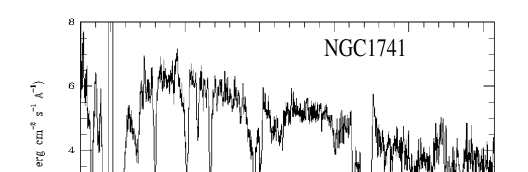
The 2-D spectrum of MRC2025-218 shows a clear absorption feature blueshifted with respect the CIV emission (see Fig. 4). In order to search for other absorption features, we have extracted a 1-D spectrum from the continuum emitting region (8 pixels or 2.2 arc sec aperture). We fitted the profiles of all possible absorption detections. We assumed Gaussian profiles (although it does not necessarily have to be the case). Some absorption features are detected. We show in Fig. 5 (bottom) the spectrum in the range 1180-1700 Å, with the expected position of some absorption features commonly found in nearby starburst galaxies. We present for comparison the spectrum of the B1 star forming knot in NGC1741 (Fig. 5 top) (Conti, Leitherer & Vacca conti96 (1996)).
We rejected those features such that: a) the spectral profile was (taking errors into account) narrower than the instrumental profile (IP) (2.98 Å in the rest frame) and/or b) the absorbed flux was lower than the detection limit. This was the case of SiII1260.4, OV1371, SiIII1417, SV1502. In order to calculate the detection limit for an absorption feature at a given position, we created Gaussians with the expected FWHM (IP in all cases) and varied the amplitude (the profiles could be broader, but this just means that a larger flux would be needed for detection). The Gaussians were added to the continuum near the expected position. The upper limit was chosen by eye, as the flux of that Gaussian that we considered detectable.
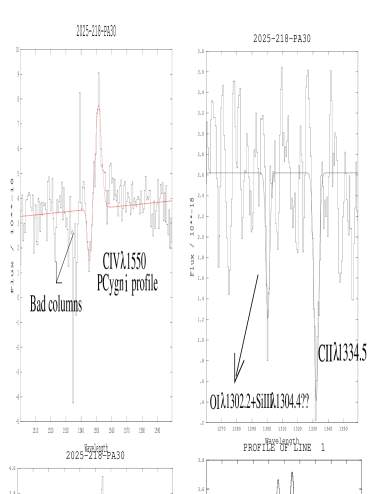
We present in Fig. 6 the fits to those features that we accepted as real. Except for CIV (for which the original spectrum is shown), we present smoothed spectra to make the figures clearer. The fits were done to the original (non-smoothed) spectra. There are some sky emission residuals on the blue side of the CIV absorption feature, but they do not affect the fit (see Fig. 4). We present in Table 2 some parameters obtained from the fits: wavelength, line identification, EW (rest frame) and FWHM. The values measured in the radio galaxy 4C41.17 (3.80) (Dey et al. 1997) and the associated absorption system of the quasar 3C191 (1.95) (Bahcall, Sargent & Schmidt 1967 bahc67 (1967)) are also shown.
| Line | EW (Å) | EW | EW | FWHM km s-1 | FWHM | ||
|---|---|---|---|---|---|---|---|
| 2025-218 | 4C41.17 | 3C191 | 2025-218 | 4C41.17 | |||
| 1300.40.5 | OI1302.2abs | 1.70.7 | 1.40.3 | 690 | 640160 | ||
| +SiII1304.4 | |||||||
| 1332.20.5 | CII1334.5abs | 3.20.6 | 1.150.25 | 3.39 | 500200 | 950220 | |
| 1390.1451 | SiIV1393.8abs | 2.90.6 | 1.150.25 | 3.39 | 1400500 | 44570 | |
| 1395.9960.6 | SiIV1393.8emis | 1.30.6 | 1.31 | 800300 | 1130170 | ||
| 1399.1451 | SiIV1402.8abs | 2.52 | 0.50.2 | 2.38 | 1400500 | 36262 | |
| 1404.9960.6 | SiIV1402.8emis | 4.02.5 | 1.75 | 800300 | 1130170 | ||
| 1545.50.5 | CIV1550abs | 103 | 1.81.3 | 7.13 | 400200 | 748210a | |
| 1551.40.3 | CIV1550emis | 174 | 21 | 700200 | 54015a |
| a FWHM of the individual components in the CIV doublet. |
The fitting to SiIV1393,1402 is difficult due to the low S/N ratio, however, the presence of two P-Cygni profiles for the SiIV1393.8 and SiIV1402.8 lines is suggested by the data. The best fit is obtained by considering two absorption and two emission features. We constrain the fit so that the two absorption features on one hand, and the two emission features on the other, have the same FWHM and are separated by 9 Å (as is expected from the doublet components 1393,1402). The results of the fit are presented in Table 2. The FWHM of the emission line features are consistent with the value measured for the CIV and Ly emission. The absorption feature presents a much larger FWHM than measured for CIV absorption. The value is consistent with measurements in galactic outflows.
The absorption features are narrower than the emission lines (also narrower than in 4C41.17) except for the SiIV1393,1402 lines, that have FWHM1400500. The absorption features in the P Cygni profiles are blueshifted by 1100200 km s-1 (CIV) and 1200200 (SiIV1393.8 and SiIV1402.8) with respect to the emission.
We confirm the detection in absorption of CIV1550, CII1334.5, SiIV1393.8 +1402.8 and, maybe, OI1302.2 +SiII1304.4 (the absorbed flux is slightly higher than the detection limit). There is no clear evidence in our data for Ly absorption, although the asymmetry of the profile (steeper on the blue side) is probably due to absorption. The presence of P Cygni profiles is confirmed in the case of CIV, SiIV1393.8 and SiIV1402.8.
5 Discussion
5.1 The spatial distribution of the emission lines and continuum.
All the objects in the sample present extended continuum and line emission. These structures are aligned with the radio axis at least in MRC2025-218 and MRC2104-242 (McCarthy et al. 1990, Pentericci et al. 1999). L1 and L2 in SMM J02399-0136 define a line with position angle 88°while the radio axis position angle is 71°. Therefore, the optical and radio axis are closely aligned in this object as well. We located the slit in MRC1558-003 aligned with the radio axis and therefore, strong line and continuum emission is extended in this direction.
Our spectra reveal the presence of several spatial components in all objects. A clumpy morphology has been observed in most HzRG both in continuum and Ly (eg. Pentericci et al. 1999). According to the properties of the individual clumps, Pentericci et al. have suggested that we are witnessing the merging of several sub-units to form the host galaxy of the radio source.
5.2 The emission line ratios.
We have compared the line ratios of the objects in our sample with measurements for other HzRG (van Ojik et al. ojik95 (1995)) by plotting them in four diagnostic diagrams involving the main UV lines (Fig. 7). We plot also some models predicting the UV line ratios of HzRG when a) AGN is the dominant ionization mechanism b) shocks dominate the emission line processes (see Villar-Martín et al. 1997 for a detailed discussion of the models). The AGN photoionization models were built with the photoionization code MAPPINGS Ic (Luc Binette), which is described in Ferruit et al. (ferr97 (1997)). The shock models are taken from Dopita & Sutherland (1996). Villar-Martín et al. (vill97 (1997)) showed that most HzRG define a sequence which can be explained in terms of (AGN) photoionization by a power law of index =-1 (with ) of a low density gas (100 cm-3) with solar abundances. The parameter sequence is the ionization parameter U, so that the difference from object to object is due to a difference in the ionization level of the gas, produced either by geometric dilution or by differences in the quasar luminosity.
MRC2104-242 and MRC1558-003 lie in the general sequence defined by most HzRG. This is not the case for the integrated spectrum (L1+L2) of the system SMM J02399-0136, which presents weak Ly and weak HeII relative to CIV and CIII]111The CIII] profile is contaminated in quasars by SiIII]1895. This could also be the case in L1 and therefore, the real value of the CIII] line ratios is uncertain. This behaviour is more pronounced if we extract the spectrum of the L1 component (the active galaxy). The line ratios locate the object far beyond the general trend, due to the weakness of HeII and Ly (see the spectrum in Fig. 2).
MRC2025-218 lies also far from the general trend. Since CIV/HeII is similar to the values observed in other HzRG and CIV/CIII] and CIII]/HeII are too low, the discrepancy is probably due to the unusual strength of CIII] in this source, rather than HeII being too weak, as it might seem from the diagnostic diagrams .222We detect SiIII]1895 in MRC2025-218, but they are well resolved from CIII] and are not likely to contaminate the profile of this line. On the other hand, CIV is absorbed in this object [see previous section], but according to the fit shown in Fig. 6, the absorbed flux is only a few per cent)
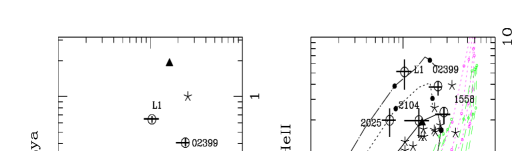
We have also studied the NV1240 emission. This line was not often detected in earlier spectra of HzRG because of limited S/N (see van Ojik ojik95 (1995)). In our small sample, only MRC2025-218 and SMM J02399-0136 have detectable NV emission. We present in Fig. 8 the diagram NV/HeII vs. NV/CIV. Quasars define a tight correlation in this diagram (Hamann & Ferland hamm93 (1993)) which is represented as a inclined line. Fosbury et al. (fos98 (1998),fos99 (1999)) showed that HzRG follow a parallel correlation to the one defined by quasars. This is also shown in the diagram. We have plotted the position of SMMJ02399-0136, L1 and MRC2025-218. Interestingly, the NV/CIV and NV/HeII line ratios measured in these sources are the largest observed for HzRG. MRC2025-218 lies at the top of the correlation defined by HzRG, while L1 lies on the quasars correlation and also occupies the position of the largest values for the NV line ratios. Both standard AGN photoionization models (with solar abundances and density 100 cm-3) and shock models are unable to reproduce the position of the objects in this diagram.

The emission lines spectrum of L1 in SMM J02399-0136
The nuclear spectrum of high quasars presents weak or absent HeII and strong NV. (NV/HeII5 and NV/CIV presents a large diversity with values sometimes 5). HeII is generally narrower (when detected) than other lines like CIV and CIII] (Foltz et al. foltz88 (1988), Heckman et al. heck91 (1991)). This has been interpreted as the origin of an important fraction of the HeII emission (50%) in a lower velocity extranuclear region, possibly the ISM of the host galaxy of the quasar. This gas will have an important contribution to the Ly emission, but lines like NV, CIII] and CIV will be dominated by the broad line region (BLR). A view of the BLR in L1 would explain the weakness of HeII and the strength of NV.
However, L1 is not a quasar since the lines are too narrow (FWHM2500 km s-1 in quasars). CIII] is broad (FWHM6100 km s-1), but this could be due to the contamination by the SiIII]1895 doublet. It is possible that the lines could appear narrower and asymmetric as the result of absorption by gas and/or dust, which could be very efficient at quenching the resonant lines (CIV, NV, Ly). However, H+[NII] presents also a narrow profile (1060 km s-1) (IV98). Therefore, the emission lines are much narrower than in quasars and L1 is not a normal quasar.
The spectral properties of L1 rather suggest that it is a narrow line active galaxy (a Seyfert 2 or narrow line quasar). Why does it lie on the sequence defined by quasars in the NV/HeII vs. NV/CIV diagram? Why does it show like quasars weak HeII and strong NV relative to the C lines? Since the BLR is not visible the spectrum must be dominated by the intermediate density narrow line region (104-6) and/or the low density narrow line region (100, usually named the extended emission line region, EELR). We showed above that the standard EELR models fail to reproduce the observed line ratios. We present in Fig. 7 two sequences (in ) of models similar to the AGN sequence described above, but for densities 105 and 106. The 106 sequence solves the discrepancies between the models and the observed line ratios. Therefore, the weakness of HeII can be explained if the intermediate density narrow line region dominates the line emission. However, these models still fail to reproduce the line ratios involving NV. Fig. 8 shows that the 106 models (only the higher ionization model is present) predict the NV line too weak. On the other hand, our models show that such high densities would produce 4, while the ratio measured by IV98 is 1.
One possibility is that the magnification due to the gravitational lens is not the same for all emission lines. The magnification depends strongly on the source size (Trentham tren95 (1995)) being higher for a smaller size of the source. Those lines whose emission is dominant in a more nucleated region will be more magnified than those lines preferentially emitted in a more extended region. Since the high density models predict stronger metal lines relative to HeII compared to the EELR models (density 100 cm-3) we expect CIV, CIII] and NV to be more nucleated and therefore more amplified. In this scenario, the region emitting NV should at the same time be more nucleated than the regions emitting the C lines to explain the large N/C ratios. Differential magnification has been suggested by Lacy et al. (lacy98 (1998)) to explain the spectroscopic properties of FSC10214+4724.
An alternative explanation is that N is overabundant. NV/HeII and NV/CIV have been used both in quasars (Hamann & Ferland hamm93 (1993)) and HzRG (Fosbury et al. fos98 (1998), fos99 (1999)) as abundance indicators. By studying the NV/HeII vs. NV/CIV diagram and the tight correlation defined by high redshift quasars, the authors conclude that the BLR of quasars at high redshift (2) present N overabundance and a large range in metallicities typically 1 to 10 times the solar values. N/C is enhanced compared to the solar values due to secondary production (N behaves in a different way than C and O. , where is the metallicity). Fosbury et al. proposed a similar explanation (but referred to the ionized gas outside the BLR) for the correlation defined by HzRG in this diagram. The failure of the solar abundance (both low and high density) models to explain the strength of NV (and maybe also the weakness of HeII) suggests metal enrichment also in the ionized gas of L1. We have calculated upper limits to the flux of the NIII]1750 and NIV]1486 lines assuming FWHM=1600 km s-1 (larger values are possible. In this case we will obtain higher upper limits and the conclusions will not vary). We obtain 0.7 and 0.8. These values are well above the photoionization model predictions (0.1 and 0.25). If the large values are confirmed, the NIII] and NIV] lines will support the interpretation of N overabundance.
The emission line spectrum of MRC2025-218
Fig. 7 shows that models with density 105 cm-3 reproduce the MRC2025-218 line ratios involved in these diagrams. This suggests that also in this object the line emission is not dominated by the EELR, but by the intermediate density narrow line region. As before, these models predict too weak NV (see Fig. 8).
NV is rather broad (FWHM2800 km s-1) compared to the other emission lines in this object. Broad NV (FWHM3000 km s-1) was also reported by McCarthy et al. (1990). This suggests that the BLR emission could contaminate the line. The spectroscopic properties of this objects show that it is not a quasar (or BLRG). All the lines, including CIII] not susceptible to absorption, are narrow and therefore, the emission is not dominated by the BLR. The line ratios are also inconsistent with quasar values (CIV/HeII7, CIII]/HeII3). The high level of polarization of the continuum and the fact that the line emission is not dominated by an unresolved component (see the plateau presented by the Ly in Fig. 3) suggest also that it is not a quasar.
However, a close look to the spectrum (see Fig. 1 top left panel and Fig. 5 bottom panel) shows the presence of a very broad underlying component to the CIV line (maybe also to HeII and CIII]) that suggests some contribution of the BLR (scattered or direct). The broad NV suggests that at least this line is contaminated by the BLR emission. While the fit to the CIV line to measure the FWHM and flux of the line neglects the broad wings seen in the spectrum, the contribution to NV (and CIII]) could be strong enough to broaden the line profile and enhance the NV emission relative to the other lines. This would also explain the anomalous strong CIII] emission.
An alternative possibility is that MRC2025-218 is richer in metals than other HzRG. MRC2025-218 lies at the top of the HzRG correlation. Unless we have a view on the BLR, the NV diagram suggests that MRC2025-218 is the most enriched HzRG observed. We have calculated upper limits to the flux of the NIII] and NIV] lines. After taking into account the possible FWHM values suggested by the other emission lines we obtain 0.6 and 0.8 which are again well above the model predictions.
In summary, the strength of NV is inconsistent in L1 and MRC2025-218 with the standard model (low density and solar abundances) predictions. In both objects the spectrum seems to be dominated by the intermediate density narrow line region. This is supported by the compact appearance of the dominant line emitting region. This could be the case of other HzRG. The models suggest that N is overabundant in the ionized gas.
5.3 The absorption lines
In §3.3 we reported the detection of several absorption features, and the presence of PCygni profiles for CIV and SiIV lines. We discuss here the nature of the absorption: is it stellar or interstellar? The detection of stellar features would be very important; the most convincing evidence for stars in a HzRG has been found in 4C41.17 (Dey et al. dey97 (1997)). On the other hand, associated () narrow absorption line systems have been found in the spectrum of several radio loud quasars (e.g. Anderson et al. and87 (1987)) and HzRG. Röttgering et al. (rott97 (1997)) reported the existence of deep troughs in the Ly velocity profile of many HzRG. In most cases the Ly emission is absorbed over the entire spatial extent (up to 50 kpc). The authors interpret these results as absorption by HI, physically associated with the radio galaxy, and having a covering factor near unity. Narrow absorption troughs have been also found in the spectral profile of the CIV line in the radio galaxy 0949-242 (Röttgering & Miley rott97b (1997)), which is likely to be due to associated absorption systems as well (Binette et al. bin99 (1999)).
The safest way to confirm the presence of stars is the detection of purely stellar photospheric features, but we do not detect them in MRC2025-218. The identified features may have a dominant contribution from interstellar absorption.
We have compared the absorption line spectrum of MRC2025-218 with that of:
1) 4C41.17
2) 3C191 (1.953), the first QSO found to have a rich absorption line spectrum (1.947) (Burbidge, Lynds & Burbidge burbi66 (1966)). The absorption is produced by associated absorption systems, interpreted as the consequence of material flowing out of the nucleus of the QSO.
3) the star forming knot B1 in the nearby starburst galaxy NGC1741 (and other nearby starburst galaxies).
4) star forming galaxies at 3-4
The EWs of the absorption features are larger than the values measured in 4C41.17 and NGC1741 and other starburst galaxies (EW2 Å , York et al. york90 (1990)). The values are consistent (except for CIV) with the EWs in star forming galaxies at 3 (EW2-3.5 Å) (Steidel et al. stei96 (1996), Yee et al. yee96 (1996)). The agreement is best with the absorption lines in 3C191. We cannot give a definitive answer on the nature of the absorption features in MRC2025-218. P Cygni profiles are characteristic of Wolf-Rayet and O star winds and have been observed in star forming galaxies at redshift 3 (Steidel et al. stei96 (1996)). However, the features we detect are highly contaminated by interstellar absorption in normal starburst galaxies. P Cygni profiles have been observed both in high and low ionization lines in some HzRG (see Fig. 5 in Dey dey98 (1998)). The author suggests that the absorption is produced by fast outflowing material moving at high velocity relative to the galaxy (this could not explain redshifted absorption features observed in some HzRG, though [Röttgering et al. rott97 (1997)]).
6 Summary and conclusions
We have studied the UV spectra of 3 high redshift radio galaxies and the hyperluminous system SMM J02399-0136. All objects present extended continuum and line emission along the radio axis. Several spatial components are found in all objects.
The line ratios of the active galaxy (L1) in the system SMM J02399-0136 and the radio galaxy MRC2025-218 suggest that the emission line spectra are dominated by the intermediate density narrow line region (105-6 cm-3), rather than the low density more extended gas (100 cm-3). This could also be the case for other HzRG.
We find that MRC2025-218 and L1 show unusually strong NV, inconsistent with solar abundance model predictions. Comparison with studies of high redshift quasars and radio galaxies suggest that N is overabundant in both objects. An alternative possibility for L1 is that NV is emitted in a more nucleated region and is more amplified by the gravitational lens. An alternative possibility for MRC2025-218 is that emission from the broad line region contaminates the NV line.
We detect several absorption features in the continuum of MRC2025-218. No pure photospheric features have been identified unambiguously. We observe PCygni profiles in some of the lines. The nature of the absorption is not clear. It could be due to stars or to associated absorption systems, as observed in other HzRG.
Acknowledgements.
This work is based on spectroscopic data obtained at La Silla Observatory. Thanks to Bob Goodrich and Marshall Cohen for providing the spectrum of FSC10214+4724 and Joel Vernet for the average HzRG spectrum. M. Villar-Martín thanks Kirsty Green and Jane Weir for useful discussions.References
- (1) Anderson S.F, Weymann R.J., Foltz C.B., Chaffee F., 1987, AJ 94, 278
- (2) Bahcall J., Sargent W., Schmidt M. , 1967, ApJ, 149, 11
- (3) Binette L., Kurk J., Villar-Martín M., Röttgering H., Hunstead R., 1999, A&A, submitted
- (4) Burbidge E., Lynds C., Burbidge M., 1966, ApJ, 144, 447
- (5) Burstein D., Heiles C., 1984, ApJS, 54, 33
- (6) Best P., Longair M., Röttgering H., 1998, MNRAS, 295, 549
- (7) Borne K., Bushouse H., Colina L., Lucas R., 1999, in After the dark ages: When galaxies were young (the universe at 25), Conf. Procc. Holt S. & Smith E. eds. American Institute of Physics Press, p220
- (8) Cardelli J., Clayton G., Mathis J., 1989, ApJ, 345, 245
- (9) Chambers K.C., Miley G.K., van Breugel W., 1987, Nature 329, 604
- (10) Cimatti A., di Serego Alighieri S., Field G., Fosbury R., 1994, ApJ, 422, 562
- (11) Cimatti A., Dey A., van Breugel W., Antonucci R., Spinrad H., 1996, ApJ, 465, 145
- (12) Cimatti A., Dey A., van Breugel W., Hurt T., Antonucci R., 1997, ApJ, 476, 677
- (13) Cimatti A., di Serego Alighieri S., Vernet J., Cohen M., Fosbury R., 1998, ApJ 499, 21
- (14) Conti P., Leitherer C., Vacca W., 1996, ApJ, 461, 87
- (15) Dey A., van Breugel W., Vacca W., Antonucci R., 1997, ApJ, 490, 698
- (16) Dey A., 1998, in The most distant radio galaxies, Amsterdam, The Netherlands, October 1997. Röttgering, Best & Lehnert eds. (astro-ph/9803137)
- (17) Dickson R., Tadhunter C., Shaw M., Clark N., Morganti R., 1995, MNRAS, 273, 29
- (18) Dopita M.A., Sutherland R.S., 1995, ApJ, 455, 468
- (19) Ferruit P., Binette L., Sutherland R., Pécontal E., A&A, 322, 73
- (20) Foltz C., Chaffee F., Weymann T., Anderson S., 1988, in QSO Absorption Lines: Probing the Universe, ed. J.C. Blades, D. Turnshek & C. Norman (Cambrdige: Cambridge University Press), 53
- (21) Fosbury R., Vernet J., Villar-Martín M., Cohen M., Cimatti A., di Serego Alighieri S., McCarthy P., in NICMOS and the VLT: A New Era of High Resolution Near Infrared Imaging and Spectroscopy, 1998, Pula, Sardinia, Italy, 26-27 June, 1998, ESO Conference and Workshop Proceedings 55, p. 190. Wolfram Freudling and Richard Hook eds.
- (22) Fosbury R., Vernet J., Villar-Martín M., Cohen M., Cimatti A., di Serego Alighieri S., McCarthy P., 1999, in ESO Conference on Chemical Evolution from Zero to High Redshift, Garching, Germany, October 14-16 1998. ESO Astrophysics Symposia, Eds. J. Walsh and M. Rosa, Springer
- (23) Goodrich R., Miller J., Martel A., Cohen M., Tran H., Ogle P., Vermelulen R., 1996, ApJ, 456, 9
- (24) Hamann E., Ferland G., 1993, ApJ, 418, 11
- (25) Heckman T., Lehnert M., Miley G., van Breugel W., 1991, ApJ, 381, 373
- (26) Ivison R., Smail I., Le Borgne J., Blain A., Kneib J., Bézecourt J., Kerr T., Davies J., 1998, MNRAS, 298, 593, IV98
- (27) Ivison R., Smail I., Blain A., Kneib J., Frayer D., 1999, to appear in the proccedings of the 1998 Ringberg workshop of ultraluminous galaxies (also astro-ph/9901361)
- (28) Kormendy J., Sanders B., 1992, ApJ, 390, 53
- (29) Lacy M., Rawlings S., Serjeant S., 1998, MNRAS, 299, 1220
- (30) Lilly S., Longair M., McLean I., 1983, Nature, 301, 488
- (31) McCarthy P., Spinrad H., Djorgovsky S., Strauss M.A., van Breugel W., Liebert J., 1987, ApJ, 319, L39
- (32) McCarthy P., Kapahi V., van Breugel W., Subrahmanya C., 1990, AJ 100, 1014
- (33) McCarthy P., Elston R., Eisenhardt P., 1992, ApJ, 387, 29
- (34) McCarthy P.J., Baum S., Spinrad H., 1996, ApJS 106, 281
- (35) Pentericci L., Röttgering H., Miley G., McCarthy P., Spinrad H., van Breugel W., Macchetto F., 1999, A&A, 341, 329
- (36) Rees M., 1989, MNRAS, 239, 1
- (37) Röttgering H., Lacy M., Miley G., Chambers K., Saunders R., 1994, A&ASS, 108, 79
- (38) Röttgering H., Miley G., Chambers K., Macchetto F., 1995 A&ASS, 114, 51
- (39) Röttgering H., van Ojik R., Miley G., Chambers K., van Breugel W., de Koff S., 1997, A&A, 326 505
- (40) Röttgering H., Miley G., in The Early Universe with the VLT, Bergeron J. ed., Springer: Berlin, p285
- (41) Sanders D., Soiffer B., Elias J., Madore B., Matthews K., Neugebauer G., Scoville N., 1988, ApJ, 325, 74
- (42) Sanders D., Mirabel I., 1996, ARA&A, 34, 749
- (43) Steidel C., Giavalisco M., Pettini M., Dickinson M., Adelberguer K., 1996, ApJL, 462, L17
- (44) Tadhunter C., Fosbury R., di Serego Alighieri S., 1989, in BL Lac Objects Conf. Procc., Maraschi L., Maccacaro T. & Ulrich M.H. eds. Springer Verlag, Berlin, p. 79
- (45) Trentham N., 1995, MNRAS, 277, 616
- (46) van Ojik R., 1995, Ph.D. Thesis, University of Leiden
- (47) van Breugel W., Stanford S., Spinrad H, Stern D., Graham J., 1998, ApJ, 502, 614
- (48) Vernet J., Fosbury R., Villar-Martín M., CohenM., Cimatti A., di Serego Alighieri S., 1999, in ESO Conference on Chemical Evolution from Zero to High Redshift, Garching, Germany, October 14-16 1998. ESO Astrophysics Symposia, Eds. J. Walsh and M. Rosa, Springer
- (49) Villar-Martín M., Tadhunter C., Clark N., 1997, A&A, 323, 21
- (50) Villar-Martín M., Binette L., Fosbury R.A.E., 1999, A&A, 346, 7 (VMB99)
- (51) Yee H., Ellingson E., Bechtold J., Carlberg R., Cuillandre J., 1996, AJ, 111, 1783
- (52) York D., Caulet A., Rybsky P., Allagher J., Blades J., Morton D., Wamsteker W., 1990, ApJ, 353, 413