L Dwarfs Found in Sloan Digital Sky Survey Commissioning Imaging Data111Based on observations obtained with the Sloan Digital Sky Survey, and with the Apache Point Observatory 3.5-meter telescope, which is owned and operated by the Astrophysical Research Consortium
Abstract
This paper describes the discovery of seven dwarf objects of spectral type ‘L’ (objects cooler than the latest M dwarfs) in commissioning imaging data taken by the Sloan Digital Sky Survey (SDSS). Low-resolution spectroscopy shows that these objects have spectral types from L0 to L8. Comparison of the SDSS and 2MASS photometry for several of these objects indicates the presence of significant opacity at optical wavelengths, perhaps due to atmospheric dust. This comparison also demonstrates the high astrometric accuracy (better than for these faint sources) of both surveys.
The L dwarfs are shown to occupy a distinctive region of color-color space as measured in the SDSS filters, which should enable their identification in a straightforward way. This should lead eventually to a complete sample of many hundreds of these low mass objects, or about one per 15 square degrees to , in the complete SDSS data set.
keywords:
brown dwarfs; surveys1 Introduction
The long search for substellar objects, or brown dwarfs, has finally been successful. The last three years have seen spectacular advances in this field, from the discovery of low-luminosity objects which are companions to nearby stars (Nakajima et al. 1995; Goldman et al. 1999), are in young clusters (Zapatero-Osorio 1998), or are in the field (Ruiz, Leggett & Alard 1997; Delfosse et al. 1997; Kirkpatrick et al. 1999, hereafter K99). Many of these dwarfs, of spectral type ‘L’, have detectable lithium and are therefore brown dwarfs. At the same time, new planetary systems around nearby stars (Marcy & Butler 1998, Queloz et al. 1998, Mayor et al. 1998, Butler & Marcy 1998) have been found, containing planets whose masses are several times that of Jupiter. The companion object Gl 229B (Nakajima et al. 1995) is cool enough (K) that its atmosphere resembles that of a giant gas planet, with strong absorption bands of methane. Very recently, several isolated objects with properties similar to those of Gl 229B, the so-called ‘methane’, or ‘T’, dwarfs (objects with methane bands at K), have been found by deep optical (Strauss et al. 1999; Pier et al. 1999; Tsvetanov et al. 1999) and infrared (Burgasser et al. 1999; Cuby et al. 1999) surveys. Because brown dwarfs never reach an equilibrium, or “main sequence”, state, there is no one-to-one correspondence between the photometric or spectroscopic properties and the stellar mass. The large number and range of new discoveries in the field are well summarized in the recent volumes edited by Rebolo, Martín & Zapatero-Osorio (1998) and Marley (1999), and the reviews by Oppenheimer, Kulkarni & Stauffer (1999) and Liebert (1999).
Substellar objects have until recently been extremely difficult to find: they are very low luminosity () and very cool ( K), with most () of their luminosity emitted at wavelengths . This means that while such objects may well be numerically the most common, they are among the rarest in magnitude-limited surveys, and large areas of sky must be covered to faint magnitude limits to find them. Wide area surveys at optical wavelengths, made with Schmidt photographic plates, have found a few of these objects in the field and in young clusters (Rebolo, Martín, & Zapatero-Osorio 1998 and references therein). However, the discovery of most new field objects has come with the new generation of sensitive, all-sky, near-infrared surveys, DENIS and 2MASS (Delfosse et al. 97; K99).
K99 discuss the selection of candidate cool, low luminosity objects using 2MASS J, H and photometry, together with optical upper limits from photographic surveys. They have obtained spectra for a large number of these candidates, and have established the continuation of the spectral classification sequence to types later than the coolest M dwarfs. These ‘L’ dwarfs (cf. Martín et al. 1997) form a spectral class distinguishable from M dwarfs by the eventual disappearance of the strong TiO and VO bands (implying condensation into solid particles in the atmosphere) and the appearance of bands of metal hydrides and lines of alkali metals.
The present paper discusses the discovery of seven new field ‘L’ dwarfs from the commissioning imaging data of the Sloan Digital Sky Survey (SDSS). We have no conclusive data to say whether or not these objects are brown dwarfs, which would require a direct measure of their mass, and sidestep this issue by confining our discussion to their spectral and photometric properties.
The next section describes the SDSS imaging data in which the candidate L dwarfs were found. The selection of the L dwarf candidates is discussed in Section 3, and the spectroscopy in Section 4. Section 5 describes the broad-band characteristics of these objects at optical and near-infrared wavelengths, using SDSS and 2MASS photometry. Section 6 discusses the sky distribution of objects with L dwarf colors and a very preliminary estimate of their areal density. The conclusions are given in Section 7.
2 Photometric Observations
The photometric observations were made in Fall 1998 to Spring 1999 with the SDSS 2.5 meter telescope and imaging camera at the Astrophysical Research Consortium’s Apache Point Observatory (APO), New Mexico. The SDSS is described by Gunn & Weinberg (1995) and York et al. (2000222see also http://www.astro.princeton.edu/PBOOK/). The telescope is a modified f/5 Ritchey-Chrétien optical system with a large secondary mirror and first and second corrector lenses above and below the primary mirror, which produces a distortion-free field (Siegmund et al. 2000333see also http://www.astro.princeton.edu/PBOOK/telescop/telescop.htm).
The imaging camera (Gunn et al. 1998) contains two arrays of CCD detectors. The imaging array is a mosaic of 30 20482048 SITe CCDs with 24 ( on the sky) pixels. The CCDs are arranged in six columns of 5 CCDs. Each column observes the sky through five broad-band filters [, , , and ], with effective wavelengths [3540Å, 4760Å, 6280Å, 7690Å, and 9250Å], covering the entire atmospheric window from the atmospheric ultraviolet cutoff to the silicon red sensitivity cutoff (Fukugita et al. 1996). The total integration time per filter is 54.1 seconds, and the expected survey depths in the five filters (5 detection of a point source with FWHM images) are [, , , and ] (Gunn et al. 1998). The camera also contains two additional arrays of neutral-density-filtered, CCDs of 2048400 pixels, which saturate at and cover the dynamic range between the photometric CCDs and existing astrometric catalogues, providing the astrometric calibration for objects detected by the photometric CCDs (Gunn et al. 1998; Pier et al. 2000444see also http://www.astro.princeton.edu/PBOOK/astrom/astrom.htm).
The photometric data are taken in open-loop time-delay-and-integrate (TDI) mode at sidereal rate, with a given point in the sky passing through each of the filters in succession. This produces a set of six long continuous imaging scans of the sky, each about wide, and separated by about 90% of the CCD width. Such a set of imaging data is called a strip; a (filled) stripe is the combination of two strips offset by the CCD separation. The data are read from the imaging camera to disk and tape (Petravick et al. 1994, 2000555see also http://www.astro.princeton.edu/PBOOK/datasys/datasys.htm), and the tapes sent to Fermilab for data processing.
The commissioning photometric data on which this paper is based are calibrated by observations of secondary standard stars in the survey area which were made with the U.S. Naval Observatory’s telescope and a (now decommissioned) telescope at APO (see Smith et al. 1998; Tucker et al. 1999). As the standard star system was still being developed while these data were taken, and because of unmodeled small-scale PSF variations in the mosaic camera data, the absolute photometric accuracy of the data discussed in the present paper is about 5% - 10%. Because of this, we will denote the preliminary SDSS magnitudes we have measured as and , rather than the notation , , , , and that will be used for the final SDSS photometric system (and is used in this paper to refer to the SDSS filters themselves).
The data were taken by parking the telescope at the Celestial Equator and allowing the sky to drift by. The scans thus cover centered on the Celestial Equator. Two strips were observed in most cases (to make a filled stripe), with northern (N) and southern (S) offsets. The particulars of each data run used in this paper are given in Table 1, which lists the bookkeeping number of each data run, whether it is a north or south strip, the right ascension range (J2000), the date and Modified Julian Day (MJD) of the observation, the approximate area covered, and the FWHM of the point spread function (PSF). For most of the runs, the PSF is . Taking overlaps into account, these scans cover roughly 600 square degrees.
The imaging data are processed through a series of automated pipelines which carry out astrometric and photometric calibrations, flat-field, bias-subtract, and correct the images for defects, and identify and measure the properties of all detected objects (Kent et al. 2000; Pier et al. 2000; Tucker et al. 2000; Lupton et al. 2000666see also http://www.astro.princeton.edu/PBOOK/datasys/datasys.htm). The SDSS photometric system, and its calibration, are described by Fukugita et al. (1996) (cf. Equations (1) and (2) in that paper). It is based on the system of monochromatic magnitudes, referenced to an absolute flux scale in Jy.
The SDSS uses a modified magnitude scale to handle the low signal to noise ratio régime, including slightly negative fluxes (Lupton et al. 1999):
| (1) |
where and is the normalizing magnitude which sets the zero point of the magnitude scale. The quantity is set so that undergoes a transition from the usual logarithmic to a linear flux scale at roughly 3 times the sky noise in a PSF aperture. The values of and vary from run to run, and the values for runs 94 and 125 are given by Fan et al. (1999a). Negative fluxes are represented with values of ; a detection at the level has , and 20.7 at and .
3 The Selection of L dwarf Candidates in the Photometric Data
The L dwarfs discussed in this paper were selected from the reduced SDSS photometric data summarized in Table 1 for spectroscopic follow up (described below) as part of a search for very high redshift quasars, whose results are described by Fan et al. (1999a,b). High redshift quasars () have colors several magnitudes redder than any ordinary star but also have blue colors, as the Ly emission moves into the filter (Fan 1999). Above , the color of quasars is bluer than stars of the same , as Ly moves into the filter. However, several point source objects were noted in the SDSS data on the other side of the stellar locus, namely with much redder colors in for their than ordinary stars.
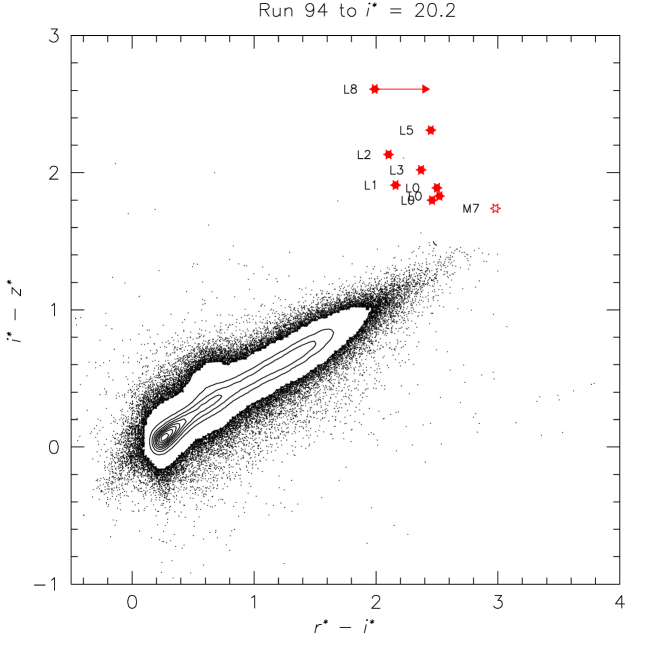
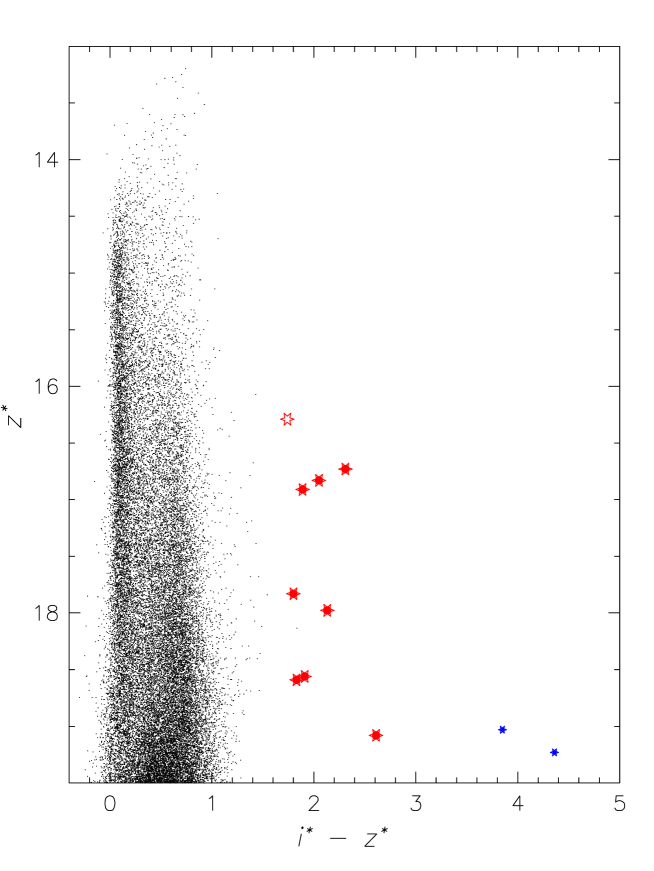
Figure 1 shows a color-color plot of point-source objects detected in and from Run 94 (see Table 1) with . Contours of density in color-color space are shown for all except the outer parts of the stellar locus. Overlaid on this plot are the colors and spectral classifications of the eight objects for which spectroscopy was obtained by the APO 3.5 m telescope (see next section), as are the colors for an additional SDSS L dwarf observed with the Hobby-Eberly Telescope (HET) by Schneider et al. (1999). Figure 2 shows a color-magnitude diagram ( versus ) from the same data. Note that the SDSS T dwarfs (Strauss et al. 1999; Pier et al. 1999; Tsvetanov et al. 1999) are redder yet in than are the L dwarfs. While the M dwarf colors lie on the extrapolation of the stellar locus, the L dwarf colors are up to 1 magnitude bluer in for a given than are the late M stars, and redder in . This region is thus well displaced from the stellar locus and its extrapolation to the red. Figure 1 suggests that L dwarfs tend to lie in the region:
| (2) | |||||
| (3) |
with the demarcation between ‘L’ and ‘T’ in these colors not yet known.
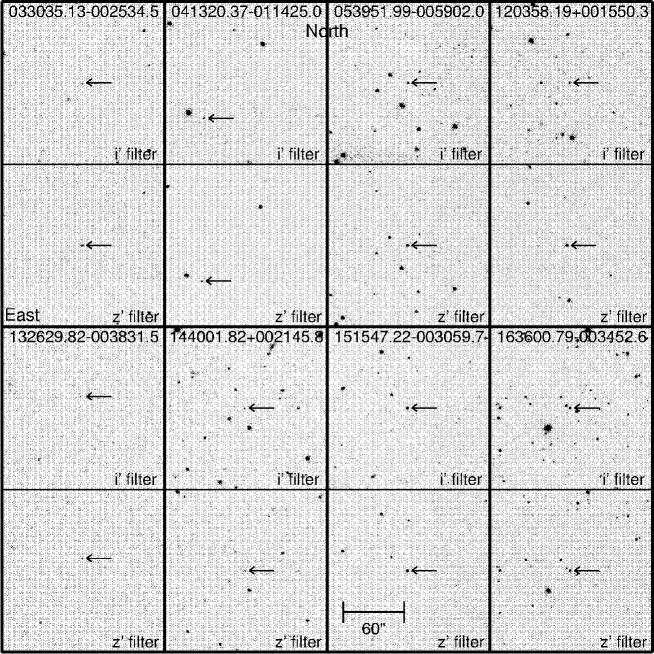
Table 2 lists the positions and photometry for the eight objects from Figures 1 and 2 for which spectra were obtained. The objects are named by the J2000 coordinates, which are accurate to about (see Section 5 below). Next is the number of the run in which the object was found. The asinh magnitudes and their errors are given in Columns 3-7. The and finding charts for these objects are shown in Figure 3.
4 Spectroscopic Observations
Spectra of the eight objects in Table 2 were obtained using the Double Imaging Spectrograph (DIS) built by J. Gunn, M. Carr and R. Lupton, on the ARC 3.5m telescope at the Apache Point Observatory, in November and December 1998 and March and May 1999. The DIS has a transition wavelength of 5350Å between its red and blue sides. The observations were taken with the low-resolution grating, which gives a dispersion of 6.2Å/pixel on the blue side and 7.1Å/pixel on the red side. The spectrograph resolution is about 2 pixels, and the joint spectrum extends from 4,000Å to 10,000Å. Exposure times ranged from 1200 to 3600 sec. Observations of the F subdwarf standard stars BD+4708 and HD 19445 (Oke & Gunn 1983) allowed correction for the atmospheric absorption bands and flux calibration of the spectra. As some of these observations were made under non-photometric conditions, the flux calibration was adjusted to the magnitude of each object. The wavelength scale was calibrated to about 0.5Å with a cubic polynomial fit to the lines of an Ar-He-Ne arc lamp. The data were reduced using the IRAF package (Tody 1993). Table 3 summarizes the spectroscopic observations, giving the object name, the date of observation, the approximate flux density at 9500Å, and the assigned spectral type, found by comparing the spectra with those displayed by K99.
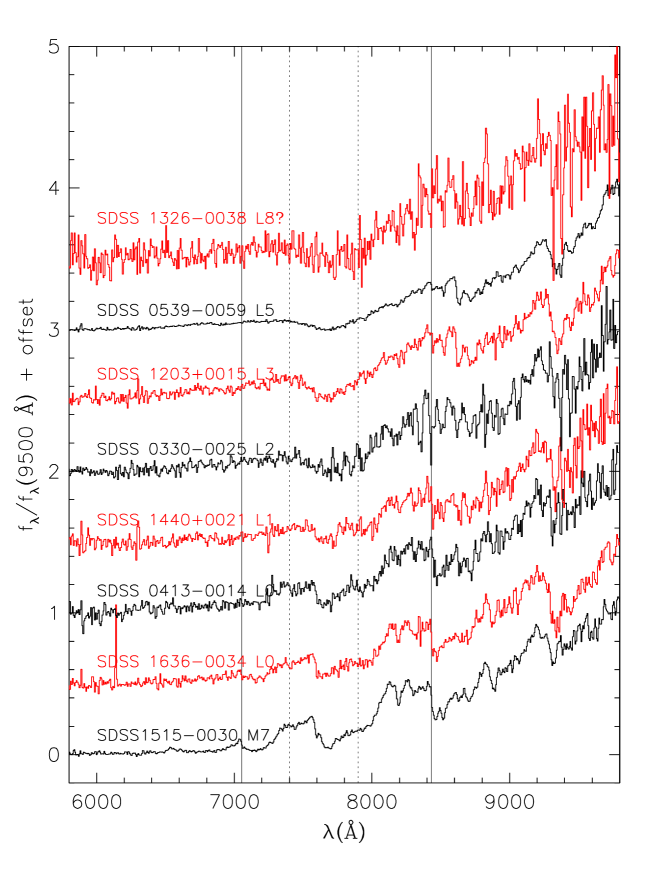
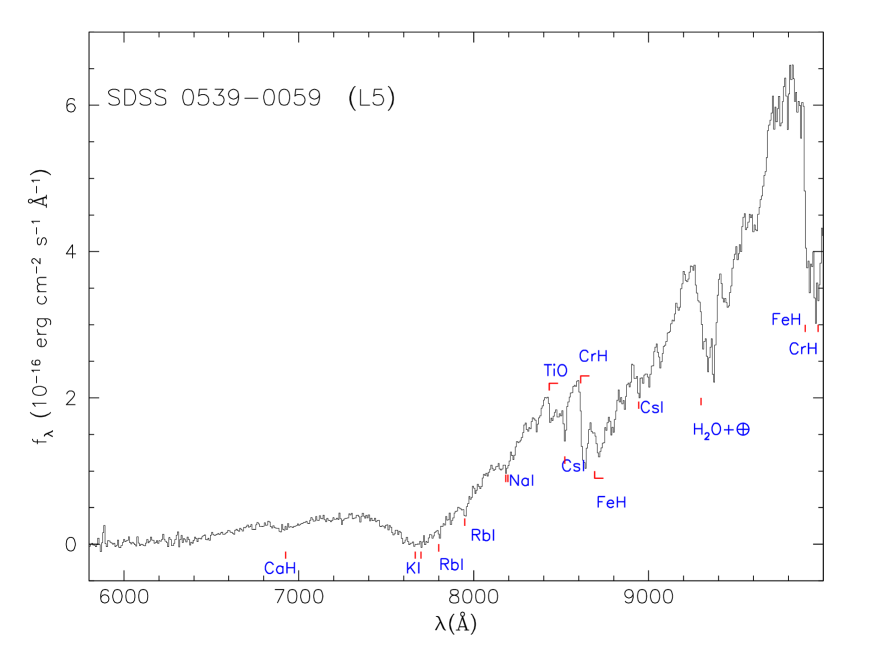
The spectra are shown in spectral sequence in Figure 4, normalizing the flux densities to a common value at 9500Å. Figure 5 shows the spectrum of the brightest L dwarf in this sample, SDSS 05390059, with the major features marked following the identifications of K99. The disappearance of the strong VO and, especially, TiO bands below about 8000Å is apparent in the spectral sequence in Figure 4, causing the L dwarfs to be bluer in than the M dwarfs (see Figure 1). The color temperature of the L dwarfs is lower and their overall spectral shape much redder than M dwarfs: hence the L dwarfs become increasingly redder in towards later spectral types. The main absorption features in the far red spectra of L dwarfs are due to alkali metals (K, Rb, Na and Cs), metal hydrides (CaH, CrH and FeH), and strong absorption in the 9200 to 9400Å range (K99). As discussed by K99, the KI doublet at 7665, 7700 Å increases in width as one continues down the sequence, becoming many hundreds of Ångstroms broad for late L dwarfs.
5 Comparison with 2MASS
The Two-Micron All Sky Survey (2MASS, Skrutskie et al. 1997) has scanned the regions of the sky containing six of the objects in Table 2, including the M dwarf. The corresponding 2MASS objects and their J, H and magnitudes are listed in Table 4.
Table 5 provides a comparison of the flux densities, listing a set of joint optical and infrared colors ordered by spectral type. Note that the 2MASS magnitudes are referred to Vega, which is assumed to be at all wavelengths. All colors show a general increase towards later spectral types, with the exception of , which is bluer for L dwarfs than it is for M dwarfs. This color also shows very little correspondence with spectral type at all, although the errors on the colors of some stars are large, and may mask a subtle trend. The distinctive colors in Table 4 allow L dwarfs to be easily distinguished in both the SDSS and 2MASS surveys individually; comparison of both surveys will most directly allow the characterization of the transition between M and L dwarfs.
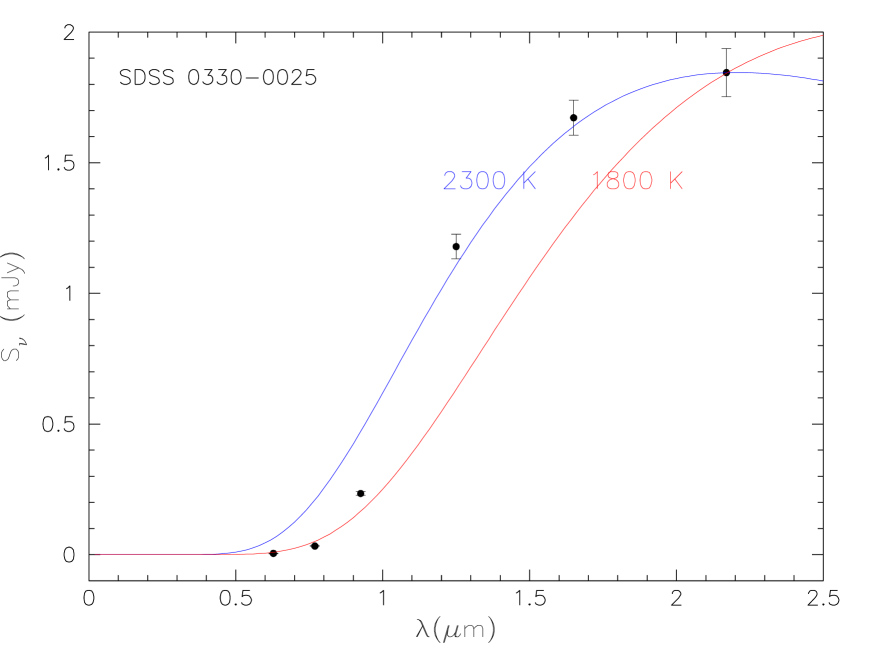
The color information between the 2MASS and SDSS surveys is not redundant. Figure 6 shows the broad-band spectrum of L03300025 (L2) compared with black body curves; the other objects show a similar trend (see Table 5). This figure is illustrative only, since cool stars are far from black bodies; it demonstrates that the L dwarfs have a lower color temperature in the to regime than in the JHKs regime, i.e. the optical flux densities are depressed relative to the infrared flux densities, demonstrating the presence of additional opacity at optical wavelengths. The likely source is dust, in the form of condensed TiO and other refractories (Tsuji, Ohnaka & Aoki, 1996, 1999; Griffith, Yelle & Marley 1998). Since both 2MASS and SDSS provide precision photometry, the dust content of the envelopes of M and L dwarfs can be investigated in detail. One potential source of worry is that because these objects are so red, the fitting of models to the photometry is critically dependent on the poorly understood red tail of the response. Work is ongoing (Doi et al. 2000) to characterize the SDSS system response in detail.
Table 4 also lists the total offset between the 2MASS and SDSS positions. The positional agreement is excellent, which is a tribute to the astrometry of both surveys (carried out by the United States Naval Observatory in both cases), given the completely independent hardware, software and calibration procedures of the two surveys and the fact that the objects in Table 4 are among the faintest detected in either survey. This has several interesting implications for future comparison of 2MASS and SDSS. First, the cross-identification of both surveys should be very straightforward, and will provide a discriminant against rapidly moving objects such as asteroids in the 2MASS data (this is in general not a severe problem with the SDSS data, see Section 6). Second, if a source in one survey is not matched in the other (and is not an asteroid), one can with some confidence set upper limits (or even 1 or 2 measurements) on the flux densities in the non-detected bands by examining the imaging data at the appropriate position (as already done by both surveys individually). Third, one can search for objects which have moved between the two survey epochs - a proper motion survey over a quarter of the sky to the survey limiting magnitudes and to a level of a few tens of a milliarcsecond per year may be within reach.
6 The Sky Density of L Dwarfs in the SDSS
The L dwarfs described in this paper, together with the L0 dwarf whose spectrum was measured by the HET (Schneider et al. 1999) were selected from data taken over about 600 square degrees, and thus give a minimum rate of detection of L dwarfs by SDSS of about 1 per 75 square degrees to . However, only a small fraction of all the L dwarf candidates in this data set have been observed spectroscopically, and an upper bound on the expected SDSS detection rate can be found simply by counting objects in the “L dwarf” region of color-color space (Equations 2 and 3). This will work provided there is no significant contamination of this region of color-color space by other objects. We are encouraged by the fact that we have not yet taken a spectrum of any object in this region of color-color space that was not an L or T dwarf. The possible sources of such contamination are:
-
•
Asteroids, whose proper motion between exposures in different filters could yield incorrect colors. However, this motion is looked for in the analysis of every SDSS object; this removes an important source of contamination (see Reid et al. 1999) outside of the stellar locus.
-
•
Quasars. As the models by Fan (1999) and the observation of high-redshift quasars by Fan et al. (1999a,b) show, the L dwarf and quasar regions of color-color space do not overlap (at least for quasars with ), and all objects in this region whose spectra have been measured are indeed L dwarfs.
-
•
M dwarfs. We have seen that the L dwarfs separate well in , color-color space from the observed M7 dwarf, but the spectral type where this color transition occurs is not yet determined.
-
•
Heavily reddened or peculiar stars. SDSS commissioning imaging scans over the dusty, star-forming regions in Orion in fact yield a clustered population of objects in the L dwarf region of the color-color diagram. We are currently investigating their properties, and will discuss them in detail in a future publication. Otherwise, the SDSS photometry, being generally taken at high latitudes, appears to separate (possibly) very late M, L and T dwarfs from all other point-source objects.
Thus the count of reliably detected point sources in the L dwarf region of color space gives at least an upper bound, and probably a reasonable estimate, of how many L dwarfs the SDSS can be expected to find.
Several of the data runs listed in Table 1 were examined for faint objects with L dwarf colors; the results are listed in Table 6. These very preliminary estimates suggest that the SDSS will detect about 1 L dwarf per 15 square degrees to , comparable to the 2MASS detection rate (K99), and suggesting that the SDSS will detect perhaps up to 1000 of these objects over the 10,000 square degrees of the survey. The SDSS and 2MASS data sets are likely to be both overlapping and complementary: 2MASS is more sensitive to the very coolest dwarfs, while SDSS will be more sensitive to the hotter objects. Together, these surveys will allow the population below about M5 to be characterized.
7 Conclusions
This paper discusses members of the new spectral class of ‘L’ dwarfs (K99) found in commissioning imaging data of the Sloan Digital Sky Survey and confirmed by spectroscopy from 5000Å to 1 with the Double Imaging Spectrograph on the ARC 3.5 m telescope at Apache Point, New Mexico.
-
1.
Seven ‘L’ dwarfs were spectroscopically confirmed, and an eighth has been confirmed at the HET (Schneider et al. 1999). The expected detection rate for L dwarfs has also been estimated by counting point source objects in the SDSS imaging data with ‘L’ dwarf colors. These very preliminary estimates show that the detection rate for L dwarfs in the SDSS will likely lie somewhere between a lower limit of 1 per 75 square degrees and an upper limit of 1 per 15 square degrees to . If the higher number turns out to be correct, the SDSS detection rate is similar to that of recent, sensitive near-infrared surveys such as 2MASS.
-
2.
L dwarfs are redder in than the latest M dwarfs and become redder towards later spectral types, as expected from the decrease in color temperatures shown by the spectra. However, they are significantly bluer than the late M dwarfs in because of the diminished VO and TiO absorption. This makes them easy to identify in the SDSS , color-color diagram, and SDSS data are likely to lead to a detailed characterization of the number density of the latest M dwarfs and the M dwarf L dwarf transition.
-
3.
The SDSS and flux densities show that the L dwarfs have lower color temperature at optical than at near infrared wavelengths, consistent with the presence of extra optical opacity in the envelopes, perhaps due to dust. Thus the combination of the SDSS and 2MASS photometry may allow the dust to be characterized in L dwarfs and in the yet cooler T dwarfs.
-
4.
The positions of these faint objects as measured by 2MASS and SDSS agree to better than , a tribute to the astrometric integrity of both surveys. Positional correlation of the data sets and searches for proper motions will be straightforward.
Acknowledgements.
The Sloan Digital Sky Survey (SDSS) is a joint project of The University of Chicago, Fermilab, the Institute for Advanced Study, the Japan Participation Group, The Johns Hopkins University, the Max-Planck-Institute for Astronomy, Princeton University, the United States Naval Observatory, and the University of Washington. Apache Point Observatory, site of the SDSS, is operated by the Astrophysical Research Consortium. Funding for the project has been provided by the Alfred P. Sloan Foundation, the SDSS member institutions, the National Aeronautics and Space Administration, the National Science Foundation, the U.S. Department of Energy, and the Ministry of Education of Japan. The SDSS Web site is at http://www.sdss.org/. We thank Karen Gloria and Russet McMillan for their usual expert help with the APO 3.5m observations. This publication makes use of data from the Two Micron All Sky Survey, which is a joint project of the University of Massachusetts and the Infrared Processing and Analysis Center, funded by the National Aeronautics and Space Administration and the National Science Foundation. XF and MAS acknowledge additional support from Research Corporation, NSF grant AST96-16901, the Princeton University Research Board, and an Advisory Council Scholarship. GRK is grateful for support from Princeton University and from the NSF via grant AST96-18503. DPS thanks the NSF for support from grants AST95-09919 and AST99-00703.References
- (1)
- (2) Burgasser, A.J., Kirkpatrick, J.D., Brown, M.E. et al. 1999, ApJ, 522, L65
- (3)
- (4) Butler, R.P., & Marcy, G.W. 1998, in “Brown Dwarfs and Extrasolar Planets”, ed. R. Rebolo, E.L. Martín & M.R. Zapatero-Osorio, A.S.P. Conference Series 134, 98
- (5)
- (6) Cuby, J.G., Saracco, P., Moorwood, A.F.M., D’Odorico, S., Lidman, C., Comerón, F., & Spyromilio, J. 1999, A&A, in press (astro-ph/9907028)
- (7)
- (8) Delfosse, X., Tinney, C.G., Forveille, T., Epchtein, N., Bertin, E., Borsenberger, I., Copet, E., de Batz, B., Fouqué, P., Kimeswenger, S., Le Bertre, T., Lascombes, F., Rouan, D., & Tiphene, D. 1997, A&A, 327, L25
- (9)
- (10) Doi, M. et al. 2000, in preparation
- (11)
- (12) Fan, X. 1999, AJ, 117, 2528
- (13)
- (14) Fan, X., Strauss, M. A., Schneider, D.P., et al. 1999a, AJ, 118, 1
- (15)
- (16) Fan, X., Strauss, M. A., Schneider, D.P., et al. 1999b, submitted to AJ
- (17)
- (18) Fukugita, M., Ichikawa, T., Gunn, J.E., Doi, M., Shimasaku, K., & Schneider, D.P. 1996, AJ, 111, 1748
- (19)
- (20) Goldman, B., Delfosse, X., Forveille, T., et al. 1999, A&A, in press (astro-ph 9905162)
- (21)
- (22) Griffith, C.A., Yelle, R.V, & Marley, M.S. 1998, Science, 282, 2063
- (23)
- (24) Gunn, J.E., Carr, M.A., Rockosi, C.M., et al. 1998, AJ, 116, 3040
- (25)
- (26) Gunn, J.E. & Weinberg D.H. 1995, in “Wide Field Spectroscopy and the Distant Universe” ed. S. Maddox & Aragòn-Salamanca (World Scientific, Singapore), 3
- (27)
- (28) Kent, S.M., et al. 2000, in preparation
- (29)
- (30) Kirkpatrick, J.D., Reid, I.N., Liebert, J., Cutri, R.M., Nelson, B., Beichman, C.A., Dahn, C.C., Monet, D.G., Gizis, J.E., & Skrutskie, M.F. 1999, ApJ, 519, 802 (K99)
- (31)
- (32) Liebert, J. 1999, in “Unsolved Problems in Stellar Evolution”, ed. M. Livio, Cambridge University Press, in press (astro-ph/9812061)
- (33)
- (34) Lupton, R.H., Gunn, J.E., & Szalay, A. 1999, AJ, in press (astro-ph/9903081)
- (35)
- (36) Lupton, R.H. et al. 2000, in preparation
- (37)
- (38) Marcy, G.W., & Butler, R.P. 1998, in “Brown Dwarfs and Extrasolar Planets”, ed. R. Rebolo, E.L. Martín & M.R. Zapatero-Osorio, A.S.P. Conference Series 134, 128
- (39)
- (40) Martín, E.L., Basri, G., Delfosse, X., & Forveille, T. 1997, A&A, 327, L29
- (41)
- (42) Mayor, M., Queloz, D., & Udry, S. 1998, in “Brown Dwarfs and Extrasolar Planets”, ed. R. Rebolo, E. Martín, & M.R. Zapatero-Osorio, A.S.P. Conference Series 134, 140
- (43)
- (44) Nakajima, T., Oppenheimer, B.R., Kulkarni, S.R., Golimowski, D.A., Matthews, K., & Durrance, S.T. 1995, Nature, 378, 463
- (45)
- (46) Oke, J.B., & Gunn, J.E. 1983, ApJ, 266, 713
- (47)
- (48) Oppenheimer, B.R., Kulkarni, S.R., & Stauffer, J.R. 1999, in ‘Protostars and Planets IV’, ed. V. Mannings, A. Boss & S. Russell (Tucson: University of Arizona Press) (in press) (astro-ph/9812091)
- (49)
- (50) Petravick, D., et al. 1994, SPIE, 2198, 935
- (51)
- (52) Petravick, D., et al. 2000, in preparation
- (53)
- (54) Pier, J.R., Leggett, S.K., Geballe, T.R., et al. et al. 1999, in “Giant Planets and Brown Dwarfs”, ed. M. Marley, A.S.P. Conf. Ser., in press
- (55)
- (56) Pier, J. R. et al. 2000, in preparation
- (57)
- (58) Queloz, D., Mayor, M., Sivan, J.P., Kohler, D., Perrier, C., Mariotti, J.M., & Beuzit, J.L. 1998, in “Brown Dwarfs and Extrasolar Planets”, ed. R. Rebolo, E.L. Martín & M.R. Zapatero-Osorio, A.S.P. Conference Series 134, 324
- (59)
- (60) Rebolo, R., Martín, E.L., & Zapatero-Osorio, M.R. (eds) 1998, “Brown Dwarfs and Extrasolar Planets”, A.S.P. Conference Series 134.
- (61)
- (62) Reid, I.N. et al. 1999, ApJ, 521, 613
- (63)
- (64) Ruiz, M.T., Leggett, S.K., & Allard, F. 1997, ApJ, 491, L107
- (65)
- (66) Schneider, D.P., Hill, G.J., Fan, X., et al. 1999, submitted to PASP
- (67)
- (68) Siegmund, W. et al. 2000, in preparation
- (69)
- (70) Skrutskie, M.F., et al. 1997, in “The Impact of Large-Scale Near Infrared Sky Surveys”, eds. F. Garzon et al., Dordrecht: Kluwer Academic Publishing Co., 25
- (71)
- (72) Smith, J.A., et al. 1998, AAS, 193, 02.06
- (73)
- (74) Strauss, M.A., Fan, X., Gunn, J.E., et al. 1999, ApJ, 522, 61
- (75)
- (76) Tody, D. 1993, in “Astronomical Data Analysis and Software Systems II”, ASP Conference Series 52, ed. R.J. Hanisch, R.J.V. Brissenden & J. Barnes, 173
- (77)
- (78) Tsuji, T., Ohnaka, K., & Aoki, W. 1996, A&A, 305, L1
- (79)
- (80) Tsuji, T., Ohnaka, K., & Aoki, W. 1999, ApJ, 520, L119
- (81)
- (82) Tsvetanov, Z.I., Golimowski, D., Zheng, W. et al. 1999, in preparation
- (83)
- (84) Tucker, D.L. et al. 1998, AAS, 193, 02.08
- (85)
- (86) Tucker, D.L. et al. 2000, in preparation
- (87)
- (88) York, D. et al. 2000, in preparation
- (89)
Table 1. SDSS Photometric Commissioning Observations on the Celestial Equator
|
|
Table 2. SDSS Photometry of Late-Type Dwarfs
|
|
Asinh magnitudes (Lupton et al. 1999a) are quoted; errors are statistical only. Detections are in boldface.
Table 3. Spectroscopy of SDSS L Dwarfs
| Object | Date | Spectral Type | |
|---|---|---|---|
| SDSS03300025 | 98/11/14 | 12.3 | L2 |
| SDSS04130014 | 98/12/12 | 13.2 | L0 |
| SDSS05390059 | 99/03/20 | 46.1 | L5 |
| SDSS12030015 | 99/05/25 | 30.6 | L3 |
| SDSS13260038 | 99/05/14 | 3.2 | L8? |
| SDSS14400021 | 99/03/22 | 9.5 | L1 |
| SDSS15150030 | 99/03/15 | 49.7 | M7 |
| SDSS16360034 | 99/05/14 | 32.7 | L0 |
The flux density in Column 3 is measured at 9500Å.
Table 4. 2MASS Magnitudes for SDSS L Dwarfs
|
|
SDSS 0539-0059 is in the overlap region between two scans and was observed twice.
Table 5. SDSS-2MASS Colors for SDSS L Dwarfs
|
|
Table 6. Detection Rate of Objects with L Dwarf Colors
| Run | Number per |
|---|---|
| 77 | 1/16 |
| 85 | 1/18 |
| 752 | 1/11 |
| 756 | 1/12 |
| Orion | 1/9 |
“Orion” refers to those parts of Runs 211, 259, and 273 between right ascensions of 52∘ and 76∘, avoiding regions of extremely high extinction.