The Extended Rotation Curve and the Dark Matter Halo of M33
Abstract
We present the 21-cm rotation curve of the nearby galaxy M33 out to a galactocentric distance of 16 kpc (13 disk scale-lengths). The rotation curve keeps rising out to the last measured point and implies a dark halo mass M⊙. The stellar and gaseous disks provide virtually equal contributions to the galaxy gravitational potential at large galactocentric radii but no obvious correlation is found between the radial distribution of dark matter and the distribution of stars or gas.
Results of the best fit to the mass distribution in M33 picture a dark halo which controls the gravitational potential from 3 kpc outward, with a matter density which decreases radially as . The density profile is consistent with the theoretical predictions for structure formation in hierarchical clustering cold dark matter models and favors lower mass concentrations than those expected in the standard cosmogony.
keywords:
galaxies:individual:M33 - galaxies:kinematics and dynamics - galaxies:halos1 Introduction
The ubiquitous presence of dark matter in spiral galaxies is well established (Rubin, Ford Thonnard 1980, Bosma 1980) as is the increase of the dark matter fraction with decreasing luminosity (Persic Salucci 1988, 1990). However, crucial issues at the heart of galaxy formation theories are still open, such as the actual density profile of the dark halo from the center of the galaxy out to its virial radius, or the nature of the dark matter. In particular, the Cold Dark Matter theory predicts a well-defined radial density profile for the collision less particles which make up the dark halo (e.g. Navarro, Frenk White 1997); this should be immediately compared with that derived from observations of nearby galaxies. On the other hand, a strong link between the gas and the dark matter distribution could expose the baryonic nature of the latter.
The main problems in tackling these issues originate from ambiguities in the mass model such as the interplay between the stellar disk and the dark halo at small radii, and the presence of a gaseous disk of poorly known orientation, size, and surface density at large radii. It is for this reason that examining the nearby dwarf spiral M33 has decisive advantages: this galaxy is a primary distance calibrator and its distance is well determined and independent of ( Mpc, e.g. Freedman, Wilson Madore 1991 and references therein). Being one of the nearest galaxies at low declination it can be observed with the Arecibo single-dish telescope that provides good sensitivity and a reasonable angular resolution (3.8 arcmin). This allows the sampling of regions very far from the center where the H i column density has declined to cm-2. Corbelli Schneider (1997, hereafter CS) have carefully investigated the geometry of the warped gaseous disk from the H i fluxes measured. M33 is a normal low-luminosity dark matter-dominated spiral (e.g. Persic, Salucci Stel 1996, hereafter PSS) in which it is relatively easy to disentangle the dark and luminous mass components.
The aim of this paper is to derive the rotation curve of M33 from the H i data and to determine the characteristics of the dark matter distribution. In Section 2 we investigate the surface density profile of stars and gas and in Section 3 we derive the rotation curve and analyze the possible signatures of interaction with its neighbor M31. The main structural properties of the dark halo are presented in a model-independent way in Section 4, while in Section 5 we derive a more detailed mass model and check its consistency with galaxy formation calculations.
2 The density distribution of the identified baryonic matter
In M33 there are four “luminous” components that could contribute to the gravitational potential:
(a) Stellar disk
A thin disk is the main stellar component since the central bulge is very small and can be completely neglected. For the stellar disk we use the exponential scale-length, , as measured in the K-band. This more closely reflects the underlying stellar mass distribution and is less affected by extinction: arcmin kpc (Regan Vogel 1994). As in the rest of this paper we have assumed the following conversion: 5 arcmin = 1 kpc corresponding to a distance Mpc. M33 is an extremely blue galaxy having (de Vaucouleurs at al. 1991). The total blue luminosity in units of blue solar luminosity is (Sandage Tamman 1981).
(b) Atomic gas
Most of the gaseous mass in M33 is in the form of neutral atomic hydrogen. The high sensitivity observations of M33 made with the Arecibo 305-m radiotelescope have allowed CS to draw a detailed map of the spatial extent of the neutral gaseous component down to a limiting column density cm-2. The results of the detailed survey of the outer disk and of the tilted-ring model fitted to the 21-cm line data have shown a radial extent of the H i which is more than 13 times the exponential scale-length of the stellar disk. The outer disk of neutral hydrogen in M33 is warped and oriented at with respect to the inner disk and the global H i profile of the outer disk appears symmetric on the low and high velocity wings. The H i surface density profile and the warp model are presented in the next Section. The total H i mass is estimated to be 1.8 M⊙ (assuming D=0.7 Mpc) 25 per cent of which resides in the outer disk.
(c) Warm Ionized gas
If the background ionizing radiation accounts for the sharp H i fall off seen in the outer disk around cm-2 (Corbelli Salpeter 1993), a similar amount of ionized gas is expected to lie above and below the whole H i disk since this is exposed to the same background radiation field. If we take a column density of ionized gas equal to cm-2 (=0.26 M⊙ pc-2) throughout the H i disk we have an H ii mass of 1.9 M⊙. This is only a rough estimate since we neglected radiation and gravity from the stellar disk, but it agrees with the surface density of the ionized gas detected in the outer parts of NGC 253 (Bland-Hawthorn, Freeman Quinn 1997) and above the disk of NGC 891 (Dettmar 1992). Since the detailed radial distribution of the warm ionized gas is unknown and its estimated mass is only 10 per cent of the H i mass we shall neglect its contribution to the gravitational potential.
(d) Molecular gas
M33 is known to be a galaxy deficient in molecular gas. Maps of the diffuse CO component and interferometric studies show that molecules are not a dominant component of the global gas mass fraction, although individual large molecular complexes with masses of order M⊙ are prominent in the nuclear region (e.g. Young Scoville 1982; Wilson Scoville 1989). Within the first kiloparsec the derived H2 column density is radially constant and of the same order of the H i column density, but at larger radii it drops rapidly. At 2.5 kpc the H2 mass is M⊙, about half of the H i mass. Therefore the molecular contribution to the potential well is small and it is a reasonable approximation to consider the H2 surface density scale-length of the same order of the K-band stellar scale-length , and the molecular gas as a small part of the mass which we shall find for the stellar disk.
3 The H i disk and the outer rotation curve
We can derive in a self-consistent way the H i surface density profile and the related rotation curve from the observed H i fluxes by using a model which corrects for the inclination of the galaxy disk with respect to our line of sight at different radii. For the model we use 11 free equally-spaced rings and to each ring we assign a value of the surface brightness, of the rotational velocity, of the inclination and position angle which were allowed to vary independently. Between each of these rings we then considered 10 additional rings whose properties were derived using a linear interpolation of the properties of the two nearest free rings. The position and systemic velocities of the ring centers were also allowed to vary in order to correct for possible tidal perturbations from M31. To stabilize the free ring model we surrounded the galaxy with artificial zero flux observation. We have removed from the data 10 observed points which make up the region of 1 kpc in linear extent around RA 01h 30m DEC 29∘ 24′. This region shows an anomalous velocity field relative to the surrounding areas and furthermore lies outside the region covered by the ring model (see Fig.6 of CS). As noted by Huchtmeier (1978) the excess of velocity and its mass are typical of a high velocity cloud complex, possibly associated with M33. We define the and carry out a minimization procedure as in CS starting from the free ring models displayed in their Fig. 5. The model which shows the lowest demands a variation of -10 km s-1 in the systemic velocity for one of the outermost rings. This is because in the northern part of the galaxy there is a high velocity cloud complex superimposed on the normal H i disk (see the anomalous velocity contour at -240 km s-1 in Fig. 3 of Corbelli, Schneider Salpeter 1989). In order to avoid a bad deconvolution for the rest of data points in the ring we decided to limit the velocity shifts of the systemic velocity to be less than 5 km s-1. Figure 1 shows the radial variations of the inclination and position angle of the resulting tilted ring model which we use for deconvolving the data. The center shift is negligible for the inner rings and is about 4 arcmin for the three outermost free rings.

The rotational velocities are obtained by deconvolving, with the above geometrical model, the 320 line profiles of the emission located at angles less than 45 deg with respect to the major axis and with peak fluxes above 2000 mJy beam-1. The observed velocity is defined to be , the peak of the fitted gaussian function (where double-horned profiles were detected, was computed as the average values of the peaks of the two gaussians). The choice of minimizes the presence of faint secondary components and sidelobe or galactic contamination. The resulting rotational velocities are shown in Figure 2. At each radius the dispersion is low and differences between the northern and southern velocity data sets are less marked than what the displayed points might suggest. In fact the low velocity data belonging to the northern half of M33 around arcmin come from the region where the anomalous velocity complex is. Similarly, the low velocity data in the southern half of M33 at arcmin, lie next to the high velocity cloud complex removed from the data. In spite of the possible contamination, these observations are kept in the data since they also contain part of the information relative to the normal outer H i disk. This will strengthen our conclusion about the monotonic increase of rotation speed from the center of M33 outwards. The straight lines in Fig.2 are the best linear fits for arcmin to all data shown, to the northern data set and to the southern data set. The fits for the two separate halves of M33 have slopes consistent, within 1- errors, with the slope relative to all data points: 0.5 0.06. Similar slopes and consistencies are found if we take out the contaminated data; in this case no differences are found in the slopes by selecting all data with arcmin or data between 25 and a cutoff radius.
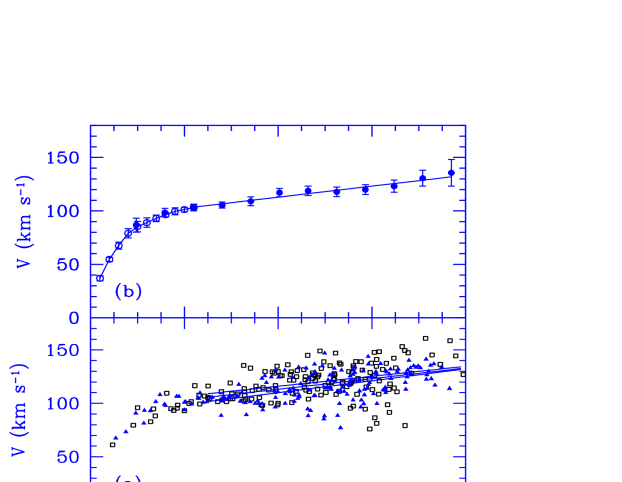
The linear fit to all rotational velocities for arcmin is also shown in Figure 2 where the data from 6 to 80 arcmin have been binned into 12 equally spaced velocity bins and displayed with the relative 2- Poisson errors around the mean. In the inner region, kpc, the present rotation curve has been supplemented with the aperture synthesis 2 arcmin resolution rotation curve by Newton (1980). Figure illustrates the good match between the two data sets.
In conclusion, the present rotation curve of M33 extends out to 16 kpc at a resolution of 0.4-1.2 kpc, with a 4 per cent mean amplitude uncertainty. Such a rotation curve is virtually unprecedented for its radial extension in units of disk scale-lengths being the outermost data point at about 13 . The data show no clear signs of kinematic disturbances from M31 in terms of north-south asymmetries or induced transient features in the rotation profiles from a closer encounter in the past (Keel 1993, Barton, Bromley Geller 1999) but higher resolution data in the optical region are more appropriate for addressing this issue. As discussed by CS, M33 is now outside the Roche limit of M31 and we expect only weak tidal disturbances like the observed twist of the outer disk or elliptical orbits. For the outermost envelope of M33, at a radius of 1/12th the separation between M33 and M31, the equipotential surface is offset toward M31 by about 4 arcmin. Despite the uncertainties in this number, which reflect the uncertainties in the mass distribution around M33 and M31, it is remarkable how it agrees with what we found for the center shift of the three outermost rings in the tilted ring model.
The resulting radial distribution of the H i gas is shown in Figure 3. The filled circles are obtained by averaging the data points inside equally spaced rings of 3.5 arcmin width. The line is the analytic fit used to compute the H i gas contribution to the rotation curve. We assume that the gas distribution falls off exponentially beyond 80 arcmin, where the H i reaches the observational sensitivity limit, and we correct for the primordial helium abundance by multiplying the observed neutral hydrogen surface density by 1.33.

From the rotation curve and from the H i +He surface density, we can derive the classical disk stability parameter (Toomre 1964, Kennicutt 1989). Values of would in principle indicate the presence of a large scale star formation. For a dispersion velocity of 9 km s-1, we find from 2 to 7 kpc, and beyond 7 kpc it diverges, reaching the value of 6 at kpc. In the innermost region, Wilson, Scoville Rice (1991) have also found considering the additional H2 surface density. Even using the total surface density (gas + a stellar disk with , see Section 5) only for kpc. It is therefore questionable whether in this galaxy a global disk gravitational instability is triggering the star formation activity. One possibility is that a new disk stability parameter is regulating the star formation in this galaxy, as suggested by Elmegreen (1993) and by Pandey van de Bruck (1999).
4 Model-independent dark matter properties
The H i +He disk contribution to , , is computed by means of the radial distributions discussed in the previous Section and by assuming a vertical thickness of 0.5 kpc (result are unchanged by taking an infinitesimally thin disk). The gas contribution increases slowly from the galaxy center out to where it peaks with km s-1. At larger radii, decreases and reaches km s-1 at the farthest radius with the available H i data. Figure 4 shows, in terms of the parameter , that and that is far from being constant. It is then evident that in this galaxy the gas distribution does not trace the mass distribution.

We shall now work out the main model-independent properties of the “luminous” matter contribution to the rotation curve. The blue color of this galaxy, , strongly suggests that (e.g. Tinsley 1981) with well determined since the distance to this galaxy is known. The stellar disk contribution to the circular velocity can be written as:
| (1) |
where , are the modified Bessel functions and is the total disk mass due to stars and molecular gas. The gas contribution is an important fraction of , and the radial distribution of the H i mass is known with uncertainties of order 20 per cent (see CS). Therefore we can estimate with the reasonable uncertainty of 30-50 per cent. For virtually any other spiral galaxy uncertainties in the stellar and gas mass are much larger. Estimated upper and lower limits to are shown in Figure 5. The upper curve is derived by assuming with the neutral gas surface density increased by 20 per cent (relative to Figure 3). For the lower curve and the neutral gas surface density is decreased by 20 per cent. In the region 3 kpc 8 kpc, decreases at a rate only weakly dependent on the exact value of while, for kpc and independently of the value of , enters into the Keplerian regime: . On the other hand, the observed rotation curve beyond 3 kpc is (Fig. 2), and shows different and very well distinct features: increases by km s-1 across the region kpc and by km s-1 from 8 to 16 kpc. From these considerations it emerges that the M33 mass distribution is largely dominated by a non-luminous component down to .

We can estimate the properties of the dark halo in the outer disk using the curves of Figure 5 as upper and lower limits for the “luminous” matter contribution to the gravitational potential. If the effective decline of the dark matter density in the halo is , can be written as a function of , of , and of using the condition for centrifugal equilibrium and its first moment (Persic Salucci 1990). In the outermost regions of M33 we find and therefore we can exclude that locally the dark matter density declines as fast as .
5 The mass model
Using a large sample of rotation curves of galaxies derived for , PSS presented evidence for a universal non-singular isothermal halo, with a core radius which increases with galaxy total luminosity and a central density which scales inversely with luminosity. The rotation curve for M33 is similar to that of galaxies of the same luminosity for (e.g. PSS), but it gives the opportunity to test the predictions for a isothermal halo since it extends out to . The PSS isothermal halo model predicts a flat rotation curve for while we have seen that the rotation curve for M33 rises steadily. Non-singular isothermal spheres have other difficulties between which the poor fits they provide to the structure of cold dark matter halos formed in a hierarchically clustering universe (e.g. Navarro, Frenk White 1997). For these reasons it is necessary to assume a more general form of dark halo density which includes also the possibility of a non-singular isothermal sphere, with a varying amplitude of the core radius, and models with a non-isothermal large scale behavior.
Taking into account the results of the previous Sections, the mass model for M33 includes: a thin exponential stellar disk, a gaseous disk and a dark halo. Introducing the variable , which we shall use in the rest of this Section, from equation (1) the contribution of the stellar disk can be written as:
| (2) |
with . The dark halo contribution to the circular velocity is parameterized as:
| (3) |
where , is a constant, and indicates the decline of the dark matter density at large radii, for . A least square method is used to determine the three parameters , , and , from the data. This procedure allows, without forcing into them, a variety of mass models, including the halo-dominated and the maximum-disk model, the no-core halo model and the non-singular isothermal halo with a flat rotation curve at large radii (, ). It will be shown at the end of this Section that it will also allow us to test the density profiles derived from cosmological N-body simulations of structure formation in a hierarchically clustering universe.
5.1 The best-fit mass model
The measured variable and the model function for the least square method are defined as follows:
| (4) |
| (5) |
The is given by:
| (6) |
We minimize over the three parameters using the binned data shown in Figure 2 (, Newton data for kpc, CS data at larger radii). The errors on are functions of the errors on , , and . The errors on Newton’s data are displayed in Figure while for CS binned data we take the errors (which are half of the errorbars displayed in Figure ). For the gas we shall use a per cent error in the gas mass (see Section 4) which gives about 3 km s-1 error for . The best-fit is obtained for
| (7) |
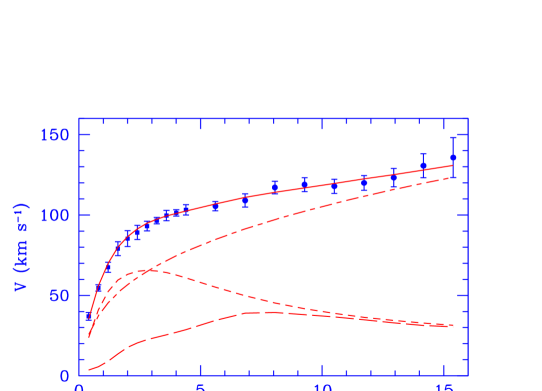
The resulting rotational velocity, as well as the halo, gas, and stellar contributions to it, is shown in Figure 6. Similar values of the parameters are obtained if we perform the minimization using the unbinned data or if we use the upper or lower limit to . The best model reproduces, within errorbars, all the velocity data; this is also evident from the low value: as defined in equation (6). The quoted errors on the best fitting parameters correspond to the 68 per cent confidence areas shown in black in Fig. 7. The best-fit model features the stellar disk as a major component of the gravitational potential for with a dark halo becoming dominant at larger radii. The corresponding value of is , i.e. M⊙ ( per cent of which might be molecular gas).


The left hand panel of Figure 8 shows for the best-fit model the remarkable similarity between the H i gas and the stellar contribution to beyond 8 kpc. The right hand panel of Figure 8 shows the effective radial decline of the dark matter density in the halo: with throughout most of the galaxy. This agrees with the model-independent estimate given in Section 4, it proofs the validity of the mass model, and excludes that the dark halo density declines as fast as in the outer H i disk of M33.
5.2 Can we exclude the non-singular isothermal halo model?
As a result of the regular rotation pattern, and of the small internal errors, per cent, the minimum fit puts aside disk-dominated models () for M33 and isothermal models for matter density of the dark halo ( ). Model-independent estimates of the dark matter in the outermost regions of M33 confirm the shallower slope of the local density decline and its small related uncertainty. Here we would like to examine additional sources of uncertainties which in principle could make the non-singular isothermal halo model still compatible with the data. First of all we would like to see if slight variations of the inclination or position angle with respect to the best-fit tilted ring model can change the shape of the rotation curve sufficiently to favor a halo density with an effective decline in regions where the outermost observable disk is. We therefore select variations of the deconvolution model which require for the best-fit halo model. We show some of them in Figure 9 together with the best ring model (as in Figure 1). They all give a symmetric rotation curve for the northern and southern part of M33 but have higher values of the both for the ring model fit and for the best mass model fit. The corresponding values of and are shown as filled dots in Figure 9 (values of are all between 0.18 and 0.28). The open circles show and obtained if we exclude from the fit the last binned point of (at 77 arcmin), which could in principle favor a rising slope of the rotation curve. Noticeably, the points in Figure 9 are all close or within the black confidence area shown in Figure 7. Therefore within possible variations of and we can exclude for M33 a flat or declining rotation curve at the outermost observable galactocentric distances.

If the halo rotation curve is steadily and significantly increasing in the region where the dark matter is practically the unique mass component, this could be reconciled with the non-singular isothermal halo model only if the M33 halo becomes fully isothermal well outside the observed regions i.e. if the halo core, at constant density, extends for several kpc. The results of the best-fit to the mass model presented in Section 5.1 seem to exclude this possibility. The correlation between and implies also that high mass-to-light ratios for the stellar component correspond to high values of the dark matter velocity slopes. But what goes wrong if we now force ? In this case the best-fit values are and . This mass model is able to reproduce the observed rotation curve of M33 except close to the galaxy center where it predicts a velocity much lower than value showed in Figure 2 for the innermost point. The low spatial resolution of the velocity data used here prevents the investigation of the rotation curve for , where a more detailed model of the molecular and stellar mass distribution are also needed. Wilson Scoville (1989) have shown that, for kpc, the velocity field and the rotation curve derived from the molecular hydrogen gas are similar to those derived from the H i observations at lower spatial resolution and consistent with a rotational velocity proportional to . For kpc however, velocities remain constant, at about 23 km s-1, consistently with optical data (Rubin Ford 1985). As a consequence, the value of the rotational velocity at 0.4 kpc results somewhat uncertain. If we minimize the , defined by equation (6), excluding the innermost data point, we get the same values of for the best-fit model as in Section 5.1, but quite larger uncertainties. The corresponding per cent confidence areas are shown in Figure 7 as light shaded areas. Our conclusion is that isothermal halo models with a flat rotation curve at can be rejected since the effective slope is in any case ; our spatial resolution is not sufficient to rule out isothermal models with a large constant density core which would give a flat rotation curve only well beyond the observed outer H i disk.
5.3 Testing the universal density profile in hierarchical clustering models
Recent calculations of cosmological structure formation in hierarchical clustering Cold Dark Matter models (e.g. Navarro, Frenk White 1996, 1997, Kravtsov, Klypin Khokhlov 1997) do not predict isothermal density distributions but halos with a universal density profile which declines as for and as further out. is a scale radius which in terms of the virial radius and of the “concentration” parameter can be written as . The resulting circular velocity has a well defined analytic expression which depends on and on the circular velocity at the virial radius (/km s-1= kpc where is the Hubble constant in units of 100 km s-1 Mpc-1). The rotation curve of M33 can be used to probe the validity of universal density profile of the dark halo and its associated circular velocity because it extends well beyond the optical radius, where the potential is more likely to be unchanged since the virialization epoch. Also, the uncertainties related to the mass of the luminous components in the inner regions are small. Using and as free parameters we can find out if the halo circular velocity in M33 can be well described by the density profile predicted by hierarchical clustering Cold Dark Matter models. In Figure 10 we show the coincidence between the circular velocity of a halo formed in a hierarchical clustering Cold Dark Matter model for km s-1, , , and the halo circular velocity of the best-fit halo model for M33 discussed in Section 5.1. Halo circular velocities for Cold Dark Matter models with imply lower values of but they reproduce the best-fit halo model for M33 equally well (e.g. km s-1, for ). The size of the virialized halo is comparable to the distance between M33 and M31 suggesting that the two dark halos are touching. For other halo models lying in the per cent contour areas of Figure 7, including the non-singular isothermal halo discussed in Section 5.2, there are larger discrepancies with the profiles predicted by Cold Dark Matter scenarios.
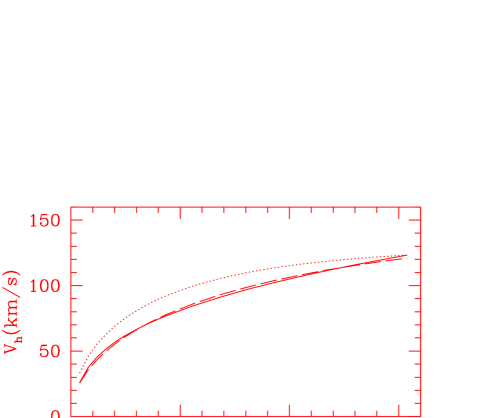
The and values compatible with the M33 halo remain below the mass-concentration relation predicted for the standard biased Cold Dark Matter scenario (, , , e.g. Navarro, Frenk White 1997). The standard scenario in fact requires to match the halo rotational velocity in the outermost point; the corresponding velocity profile is shown in Figure 10 where the large discrepancies with the rotational velocities of the best-fit halo model are noticeable. The lower concentrations suggested by the M33 halo might indicate a low density universe with a non zero cosmological constant. A detailed discussion on the cosmological implications of our results requires however a more settled view of the the mass-concentration dependence on cosmological models and on environmental effects (Kravtsov, Klypin Khokhlov 1997, Navarro 1998, Avila-Rees, Firmani, Klypin Kravtsov 1999).
6 Conclusions
The availability of H i surface density data out to large distances from the center of the nearby galaxy M33 has allowed us to derive the rotation curve for this galaxy out to and to study in detail the dark matter distribution in the halo. The results derived in the previous Sections lead to the following conclusions:
As expected in a low-luminosity, late-type spiral, the H i disk accounts for a substantial fraction of the total baryonic mass. It is remarkable that, the gas total mass ( M⊙, including helium, molecular hydrogen, atomic neutral and ionized hydrogen) is of the same order of the derived stellar mass for the best-fit mass model. This imply that per cent of the gas has turned into stars but the actual mechanism that regulates the star formation activity in this blue galaxy is still unclear since the H i surface density is below the critical value for a global disk instability.
The velocity data from 3 to 14 disk scale-lengths clearly indicate that the rotation curve is steadily rising and is only weakly affected by the gravitational potential of the visible matter. The declining contribution of the combined visible baryonic components (gas+stars) to the observed velocity beyond kpc excludes a direct correlation between the extended H i surface density and the dark mass distribution. M33 is therefore dark matter dominated and can be used to directly probe the dark matter density at large galactocentric distances.
The dark matter density, distributed in a spherical halo, decreases with radius as with small uncertainties in the outermost observable regions, which more directly reflect the primordial dark matter distribution. This density profile agrees with the theoretical predictions for halos formed in hierarchical clustering Cold Dark Matter models and implies a halo size comparable with the distance to M31. The halo is less centrally concentrated than expected from the mass-concentration relation in the standard biased Cold Dark Matter scenario.
Acknowledgments
We would like to thank Leslie Hunt, Ed Salpeter, Renzo Sancisi, Steve Schneider, and especially the anonymous referee for very useful comments and a careful reading of the original manuscript.
References
- [1] Avila-Rees V., Firmani C., Klypin A., Kravtsov A. V. 1999, preprint, astro-ph/9906260
- [2] Barton E. J., Bromley B. C., Geller M. J. 1999, ApJL, 511, L25
- [3] Bland-Hawthorn J., Freeman K. C., Quinn P. J., 1997, ApJ, 490, 143
- [4] Bosma A., 1981, AJ 86, 1791
- [5] Corbelli E., Schneider S. E., Salpeter E. E., 1989, AJ, 97, 390
- [6] Corbelli E., Salpeter E. E., 1993, ApJ, 419, 104
- [7] Corbelli E., Schneider S. E., 1997, ApJ, 479, 244 (CS)
- [8] Dettmar R.-J., 1992, Fund. of Cosmic Phys. 15, 143
- [9] Elmegreen B. G., 1993, in Franco J., Ferrini F., Tenorio-Tagle G., eds, Star Forming galaxies and their ISM, Cambridge, p. 106
- [10] Freedman W. L., Wilson C. D., Madore B. F., 1991, ApJ, 372, 455
- [11] Huchtmeier W. K., 1978, in Berkhuijsen E.M., Wielebinski R., eds, IAU Symposium, No 77, Structure and Properties of Nearby Galaxies, Reidel, Dordrecht, p. 197
- [12] Keel, W. C. 1993, AJ, 106, 27
- [13] Kennicutt R. C., 1989, ApJ, 344, 685
- [14] Kravtsov A. V., Klypin A. A., Khokhlov A. M., 1997, ApJS, 111, 73
- [15] Navarro J. F., Frenk C. S. F., White S. D. M., 1996, ApJ, 462,563
- [16] Navarro J. F., Frenk C. S. F., White S. D. M., 1997, ApJ, 490, 493
- [17] Navarro J. F. 1998, in Zaritsky D., eds, ASP Conference Series No. 136, Galactic Halos. Astron. Soc. Pac., San Francisco, p.409
- [18] Newton K., 1980, MNRAS, 160, 689
- [19] Pandey U. S., van de Bruck C., 1999, MNRAS, 306, 181
- [20] Persic M., Salucci P., 1988, MNRAS, 234, 131
- [21] Persic M., Salucci P., 1990, MNRAS, 245, 577
- [22] Persic M., Salucci P., Stel P., 1996, MNRAS, 281, 27 (PSS)
- [23] Regan M. W., Vogel S. N., 1994, ApJ, 434, 536
- [24] Rubin V. C., Ford W. K., Thonnard N., 1980, ApJ, 238, 471
- [25] Rubin V. C., Ford W. K. 1985, Carnegie Inst. Washington Ann. Rept., No. 85, p. 66
- [26] Sandage A., Tammann G. A., 1981, A revised Shapley-Ames Catalog of Bright Galaxies, Carnegie Instit. of Washington, Washington D.C., publication No. 635
- [27] Tinsley B. M., 1981, MNRAS, 194, 63
- [28] Toomre A., 1964, ApJ, 139, 1217
- [29] de Vaucouleurs, A., de Vaucouleurs, G., Buta, R. J., Corwin, H. G., Fouque’, P., Paturel, G., 1991, Third Reference Catalogue of Bright Galaxies, Springer-Verlag, New York
- [30] Wilson C. D., Scoville N., 1989, ApJ 347, 743
- [31] Wilson C. D., Scoville N., Rice W., 1991, AJ, 101, 1293
- [32] Young J. S., Scoville N., 1982, ApJL, 260, L11