Re-constructing the Merger History of the A3266 Galaxy Cluster
Abstract
A temperature map of the A3266 galaxy cluster has been derived from the ASCA GIS observations. It shows an asymmetric pattern of heating indicative of an ongoing merger between a group sized sub-cluster and the main cluster. The galaxy distribution shows two peaks connected in a barlike structure running NE to SW through the central region of the main cluster, defining the merger axis. The temperature of the intergalactic medium generally decreases from SW to NE along the merger axis with a peak of 13.2 +3.4/-2.0 keV in a region which is perpendicular to the merger axis and extends through the main cluster density peak. The central bar has a velocity dispersion of 1300 km s-1, compared to 1000 km s-1 for the surrounding cluster. The central bar also has two distinct density peaks in the distribution of galaxies, yet it has a velocity distribution which is consistent with a single Gaussian. This implies a merger in the plane of the sky. The optical and X-ray data taken together show that a loose group of about 30 galaxies has penetrated the main cluster from the SW, decoupling from their original intergroup medium and passing through a strong shock front. Two radio galaxies, one a wide angle tail morphology (WAT) and the other a narrow angle tail (NAT), are located to the SW of the main cluster in the post-shock gas. Since the merger is in the plane of the sky, a dynamical analysis cannot be applied to derive the velocity of the merger. Alternatively, using the pre- and post-shock gas temperature and assuming an adiabatic shock, we calculate a relative gas velocity of 1400 km s-1. The alignment of the NAT and WAT relative to the shock front combined with the high gas velocity from the merger implies that the observed radio morphologies formed via ram-pressure as a result of the merger.
Subject headings:
galaxies: clusters: individual (A3266) – galaxies: intergalactic medium – X-rays: galaxieshenrikse@umbc.edu
rdonnelly@cfa.harvard.edu
dsd@pikaia.mit.edu
1. Introduction
One of the significant contributions to emerge from ROSAT and Einstein Observatory studies of galaxy clusters is the discovery that many clusters contain substructure or asymmetric morphologies. The frequency of substructure, which has been estimated at 40% (Forman & Jones 1990), suggests that clusters are still forming hierarchically through merger and accretion of subclusters and galaxy groups. While the prevalence of substructure has primarily been used to constrain cosmologies (Richstone, Loeb, & Turner 1995; Mohr et al. 1995), detailed studies of merging clusters impact a number of important areas including: the radio properties of galaxy clusters, cooling flow formation and evolution, galaxy evolution, and gravitational mass measurements.
An analysis of the galaxy kinematical data can be used in many cases to determine the geometry and dynamics of the cluster merger. While some clusters, such as A548 (Davis et al. 1995), may have multiple components, for many a simple 2-body dynamical analysis is sufficient and provides an estimate of the relative velocity of the infalling substructure. Typical velocities are high: 2000 km s-1 for A400 (Beers et al. 1992), 2000 km s-1 in A754 (Zabludoff & Zaritsky 1995), 3000 km s-1 in A2256 (Roettiger, Burns, & Pinkney 1995), 1600 km s-1 in A3395 (Henriksen & Jones 1996), and 2500 km s-1 in A2255 (Burns et al. 1995). Since these values indicate that subclusters merge at Mach 2-3, it is expected that the merging atmospheres should show evidence of shock heating.
ASCA observations are in a unique position to provide a physical description of shock heating of the ICM during a merger because the data combine both spectral and spatial resolution. Temperature maps of clusters with substructure sometimes show complex structure (e.g., Markevitch 1996) and have proven to be a powerful diagnostic of the dynamical state of the (ICM). For example, the two-dimensional temperature maps of A754 (Henriksen & Markevitch 1996), A1367 (Donnelly et al. 1998), and the Coma cluster (Honda et al. 1996; Donnelly et al. 1999) have generally confirmed the accuracy of hydrodynamical simulations of cluster mergers (Evrard, Metzler, & Navarro 1996: Roetigger, Stone, & Mushotzky 1998; Gomez et al. 1997).
In this paper, we present an X-ray and optical analysis of A3266 using ASCA and ROSAT observations along with positions and velocities of over 380 galaxies taken from Quintana, Ramirez, & Way (1996). A3266 is an ideal cluster in which to study the effects of a merger using ASCA. It has a large angular radius ( 13 arcmin) like the A1367, Coma, and A754 clusters so that several regions can be analyzed while systematic uncertainties associated with modeling the ASCA point-spread-function (PSF) are minimized. Like A754, it is very bright with a 2-10 keV luminosity of 1045 ergs sec-1 so that the statistical uncertainties in the spectro-spatial analysis are minimized.
2. Observations
A3266 has z = 0.0594 (Quintana, Ramirez, & Way 1996) and located at 4:31:0.9, -61:28:42 (J2000). A3266 was observed with ASCA for 23,632 seconds on 1995 October 7-8 and with the ROSAT PSPC for 13,547 seconds in the fall of 1993. Good ASCA data was obtained with both the Gas Imaging Spectrometer (GIS), which has two detectors, and with the Solid State Imaging Spectrometer (SIS), which consists of two camera assemblies. The GIS has higher effective area at higher energy ( 5 keV) than the SIS so using both data sets are potentially useful in analyzing multi-temperature emission. However, A3266 was observed with the SIS in 1-CCD mode and the cluster more than fills the chip. To maintain consistency in our analysis, only the GIS data was used for this study. The data were filtered using the REV2 criteria utilized by the ASCA Guest Observer Facility in reprocessing data since June 1997. These criteria exclude data obtained under the following conditions: with a radiation belt monitor (RBM) count 100 cts/s, during earth occultation or at low elevation angle to the Earth ( 5 degrees for the GIS), when the pointing was not stable (deviation of 0.01 degrees), during South Atlantic Anomaly passage, and when the cutoff rigidity (COR) was 6 GeV/c.
3. Analysis
The spectra from the ROSAT PSPC and the ASCA GIS2 detectors are first analyzed to obtain an emission weighted temperature for the cluster. Large regions were chosen for each data set to be co-spatial and contain all of the cluster emission; bright point sources were removed from both images. The PSPC region is a circle of radius 16.3’ located at 4:31:19.02, -61:27:32.98 (J2000). The GIS region is a circle of radius 17.25’ located at 4:31:41, -61:26:32.96 (J2000). The PSPC and GIS data are fit separately and jointly with a Raymond & Smith spectrum. The PSPC has an energy range of 0.1 - 2.0 keV while the GIS has a broader band, 0.7 - 11 keV. Fitting both data sets separately is useful for analyzing the presence of multiple temperature components since a difference in observed emission weighted temperature implies multiple temperature components are present. In these fits, the column density, temperature, and abundance are free parameters. The normalization for each temperature component in each data set are also free parameters. The test is used to find the best fit values and the 90% confidence limit on the temperature.
The primary purpose of analyzing the ASCA spectrum is to spatially resolve temperature components implied by multi-component modeling of the integrated spectrum. A moderate spatial resolution temperature map is prepared to indicate the general temperature structure of the cluster. This map is then used to select eight regions in which temperature are measured with greater accuracy using the PSF modeling technique described in Churazov et al. (1996). The energy range covered is 1.5-11 keV. Data below 1.5 keV and between 2.0 - 2.5 keV is not used to minimize the uncertainty in the PSF correction (see Markevitch 1996 for details).
For ASCA observations at high Galactic latitude, blank sky observations obtained with long exposures are utilized for background subtraction. The blank sky observations were taken with different COR values. Since the A3266 observations and background observations are taken at different times the range of COR values are different during each observation. Therefore, blank sky observations at each COR value are time weighted to make a composite background image which is then subtracted from the cluster image. There is a day-to-day variation in the GIS background of 20-30% for a specific COR value, however, the composite background image is more accurate and the uncertainty in the background normalization is estimated at 5% (Markevitch 1996 and references within). In all of the regions modeled using the PSF, the column density is fixed at the Galactic value, 31020 cm-2 and the abundance at an average value of 0.30 Solar; only the temperature of each region is a free parameter.
4. Results
| Data Set | NH (cm-2) | kT (keV) | Abundance | |
|---|---|---|---|---|
| ROSAT | 0.91 | 0.023 - 0.026 | 4.7 - 6.9 | 0.00 - 0.50 |
| ASCA | 1.1 | 0.0023 - 0.039 | 7.7 - 8.8 | 0.14 - 0.25 |
| ROSAT & ASCA (1RS) | 1.05 | 0.0225 - 0.0241 | 7.75 - 8.46 | 0.15 - 0.25 |
| ROSAT & ASCA (2RS) | 1.04 | 0.0225 - 0.0234 | 0.31 - 6.5 (7.82 - 12.94) | 0.14 - 0.24 |
4.1. Optical
Table 1 of Quintana, Ramirez, & Way (1996) contains positions and velocities for over 380 galaxies. After clipping the velocities in their Table 1 we retain 336 galaxies between 14000 and 22000 km s-1. The top panel of Figure 1 shows the velocity histogram for the entire sample of 336 galaxies. We have used the KMM algorithm to characterize the optical morphology. The KMM (”Kaye’s” Mixture Model) algorithm fits a user specified number of Gaussians to a dataset using the EM method (Dempster, Laird, & Rubin 1977) and evaluates the improvement of that fit over a single Gaussian. It also provides a maximum-likelihood estimate of the membership of the data points to specific groups. For this implementation of the algorithm we input an initial guess for the number of groups, their location (RA, DEC and velocity) and size. The algorithm then iteratively determines the best position for the Gaussians and assigns each point a probability of being a member of one of the groups. This iterative process continues until a stable solution is found. The KMM algorithm divides this cluster into two groups, an inner region, which contains the bar seen in the spatial distribution of the galaxies (see Figure 2), and an outer region which is more diffuse and spans the cluster. Shown in the middle panel of Figure 1 is the velocity histogram for the inner bar-like region. The bottom panel of Figure 1 shows the velocity histogram for the surrounding cluster. The w and Anderson-Darling (AD) statistical tests address the hypothesis that the cluster distribution is drawn from a parent population which is a single Gaussian (Beers et al. 1991, Yahil & Vidal 1977). Both tests reject the hypothesis that the cluster velocity distribution can be drawn from a Gaussian distribution at 90%, and 99% confidence respectively. The biweight estimate of the velocity dispersion is 1367 km s-1 for the inner part and 1007 km s-1 for the outer part. This matches the velocity dispersion estimate of Quintana et al. of 1400 km s-1 for the inner 10 arcmin. These authors also reported a drop in velocity dispersion from 1307 km s-1 within 2.5h Mpc to 800 km s-1 outside of 3.0h Mpc.
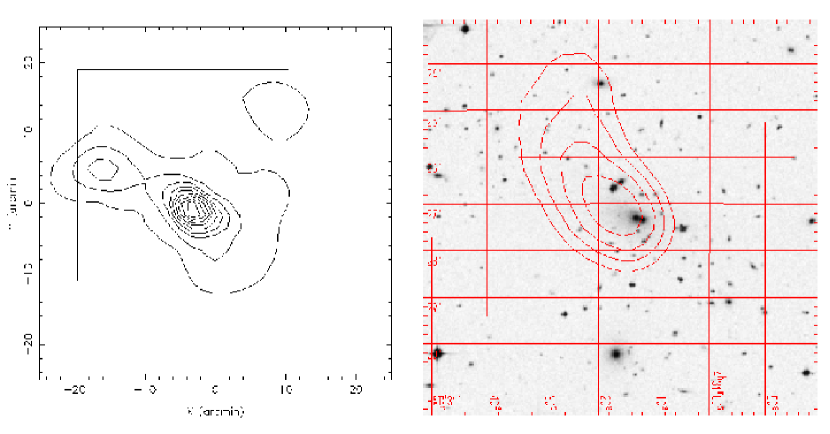
The spatial distribution of galaxies is shown in a contour map prepared using an adaptive kernel (see Figure 2, left panel). To create this map, an initial smoothing scale of 0.25 Mpc is chosen and the image is converted to a density map. Further smoothing is done with an adaptive kernel in which the kernel size is inversely proportional to the density. The center of this figure is at 4:30:32.0, -61:34:03.0 (J2000). The inner region contains two components: a main cluster to the southwest and a secondary subcluster cluster of about 30 galaxies to the northeast. This barlike structure in the galaxy distribution is also seen as an elongation in the central region of the X-ray contour maps (see the right panel of Figure 2 for the PSPC and the left panel of Figure 3 for the GIS).
This number of galaxies in the secondary cluster is typical of a loose group. The velocity distribution of the components in the central region are almost identical. Biweight estimates of the heliocentric velocity are 17804 km s-1 for the main cluster core and 17679 km s-1 for the secondary subcluster. This means that using velocity information to separate them is nearly impossible. The peak at 18400 km s-1 not significant with greater than 90% confidence. Thus, the inner sample does not show any signs of being non-Gaussian, suggesting that the merger is in the plane of the sky.
4.2. X-ray
Comparison of the 90% confidence range on the free parameters derived from modeling single data sets for the (PSPC:GIS) shows that while the column density (0.023 - 0.026:0.023 - 0.039 cm-2) and abundance (0.0 - 0.50:0.14 - 0.25 Solar) ranges are in good agreement, the emission weighted temperatures (4.7 - 6.9:7.7 - 8.8 keV) are not (see Table 1). The PSPC is more sensitive to the cooler gas component of the ICM and so the emission weighted temperature measured with the PSPC is lower than that measured by the GIS. This is indicative of non-isothermality in the gaseous atmosphere. A two temperature model is marginally preferred over a single temperature model when both data sets are fit simultaneously. The two temperature components (0.31 - 6.5:7.82 - 12.94 keV) differ with 90% confidence.
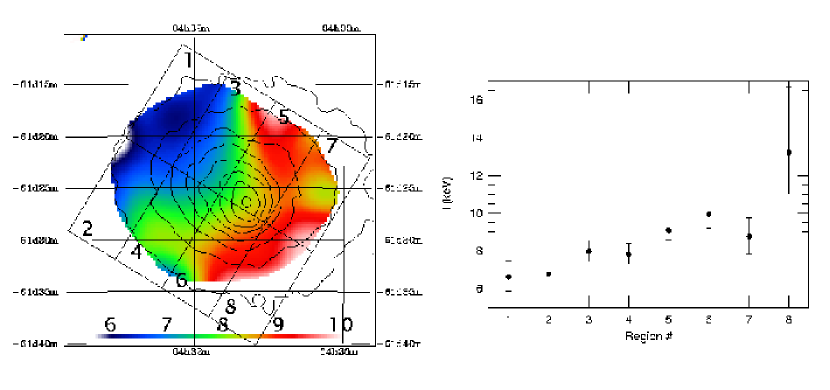
| Region Number | Best Fit Temperature (keV) | 90% Temperature Range (keV) |
|---|---|---|
| 1 | 6.6 | 5.8 - 7.5 |
| 2 | 6.8 | 6.0 - 7.6 |
| 3 | 8.0 | 7.4 - 8.5 |
| 4 | 7.8 | 7.3 - 8.4 |
| 5 | 9.0 | 8.6 - 9.6 |
| 6 | 9.9 | 9.2 - 10.8 |
| 7 | 8.8 | 7.8 - 9.8 |
| 8 | 13.2 | 11.0 - 16.7 |
Modeling a circular region of radius 1.04 h Mpc, while correcting for the PSF, shows there are temperature variations across the atmosphere (see Figure 3, left panel). This figure shows the color coded temperature map obtained with the GIS with the GIS surface brightness contours overlayed. The map represents a smoothed temperature map in which each 15” pixel region is modeled as an emission weighted sum of the high (9 keV) and low (3 keV) cluster temperatures (Churazov et al. 1996). Though the errors on each temperature are large, the general temperature structure indicates a shock structure perpendicular to the merger axis. To study the temperature with greater accuracy, we have defined a set of regions arranged to probe the temperature along the merger axis. The temperatures obtained for the rectangular regions are given in Table 2 and shown graphically in the right panel of Figure 3, with 90% confidence error bars. We find there is an overall trend of decreasing temperature from West to East, with the hottest gas located west of the X-ray peak in a regions 5 and 8 where the intensity contours are also compressed. If the overall temperature distribution has structure on small scales, the regions chosen with which to sample the distribution will affect the final results. For example, our region 8 is a composite of parts of regions 2, 6, and 9 in the map contained in Markevitch et al. (1998). Region 2 in their analysis has a temperature range of 6 - 12 keV and is consistent with our measurement of region 8 (11-16.5 keV). The temperature measured in our specific regions are in good agreement with those found for A3266 using different regions and an independent method of correcting for the PSF (Markevitch et al. 1998). For a comparison of the two PSF modeling methods see Donnelly et al. (1998). The optical substructure can be spatially identified with the temperature structure by noting that the box shown on the optical contour map (left panel of Figure 2) is the region over which the temperature map was made (left panel of Figure 3). The distribution of galaxies, taken with the velocity structure, suggests that either the secondary galaxy component has just passed through the primary cluster, entering it from the SW, or it is falling into it from the NE, prior to the initial core passage. The indication of substantial shocked gas in our temperature maps favors the former model, implying that the subcluster has already penetrated the core of the main cluster along the axis running from SW to NE. The heating appears perpendicular to the merger axis and mainly on one side of the cluster. In this regard it is similar to the temperature pattern found for the Coma cluster (Honda et al. 1996).
5. Discussion
Girardi et al. (1997) classify the A3266 optical morphology as unimodal, having a primary cluster with a secondary cluster of galaxies to the East. Our optical analysis confirms this structure in the inner core. The components have similar velocity dispersions, which are both approximately 300 km sec-1 higher than the surrounding cluster. Heating in the intergalactic medium along the W-SW rim of the cluster has resulted from collision of the cluster atmospheres during the initial supersonic impact of the secondary cluster falling into the primary from the SW. The morphology of the temperature map is similar to that found by Roettiger, Burns, & Loken (1996) in the relatively late stage of an unequal merger (4:1 mass ratio) 2 Gyr after core passage.
Heating of the cluster atmosphere during a merger tends to be localized and has little effect on the emission weighted temperature. Comparison of the emission weighted temperature derived here, 8.1 keV, with the velocity dispersion of the outer region, 1000 km s-1, indicates rough energy equipartition between the gas and galaxies of the main, pre-merger cluster. The high inner velocity dispersion then must result from converting kinetic energy of the infalling group, via dynamical friction, into kinetic energy of the galaxies in the bar-shaped inner region of the cluster.
5.1. The Effect of Merger on the Dumbbell cD Galaxy
Subcluster merger and accretion of galaxy groups has been observed in several clusters (e.g., A754, A1367, A3395, A3528, Coma) consistent with N-body simulations which show multiple mergers occurring as clusters are assembled. Recent studies of the Coma cluster show that numerous mergers have taken place. Groups around each of the central dumbbell, NGC 4874 and NGC 4889, have fallen through the main cluster core (Donnelly et al. 1999; Gambera et al. 1997; Colless & Dunn 1996) and a group around NGC 4839 has penetrated the core (Burns et al. 1995).
A3266 also has a central cD galaxy with a faint secondary nucleus in a dumbbell morphology. The right panel of Figure 2 shows the smoothed, flatfielded ROSAT PSPC image overlayed on the Digitized Sky Survey image of the central 8.5x8.5’ region of the A3266 cluster. While the cD galaxy in the dumbbell pair, located at 4:31:12.16, -61:27:15.3) appears slightly offset (30”) from the X-ray center, this may be due to a combination of smoothing and the ROSAT pointing error, 15”. The faint nucleus and the cD have a relative velocity of 40039 km s-1, somewhat larger than the velocity dispersion of the nucleus of the cD (32734 km s-1). Carter et al. (1985) found that the cD shows a rise in stellar velocity dispersion with radius to a maximum of 700 km sec-1. This rise is asymmetric and can be understood in context of the subcluster merger. We propose that it is a sign of a tidal interaction. The interaction appears to be with the infalling subcluster rather than the faint nucleus. The region around the cD, visible in the right panel of Figure 2, shows a tidal extension along the merger axis in the direction of the subcluster which has passed through the main cluster. While the velocity difference of the nuclei is large, it is consistent with the overall rise in the velocity dispersion with radius due to the tidal interaction. The cD galaxy has a heliocentric velocity of 17795 km s-1, very close to the value we found for the main cluster core, 17804 km s-1. This is consistent with the cD being at rest in the main cluster core. Our hypothesis is that the faint nucleus is bound to the cD, possibly captured from the infalling subcluster. The merger has tidally distorted the cD galaxy in a head-on core passage by the secondary cluster and increased the velocity dispersion in the outer halo of the galaxy. The merger velocity we have calculated from the temperature map (section 5.2), 1400 km s-1, would correspond to the relative velocities of the galaxies in the during the merger if they are both at rest in the potential well of their respective subclusters. While this relative velocity is much higher than the observed velocity difference of the dumbbell, dynamical friction would increase the internal energy of the much more massive cD at the expense of the kinetic energy of the other smaller galaxy. As noted above, the heating seen in the velocity dispersion of the cD is significant, approximately a factor of two. This hypothesis would account for the observed tidal distortion of the cD halo along the merger axis, the previously reported rise in velocity dispersion in the halo, and the large relative velocity of the cD and faint nucleus.
Both A3266 and Coma were included as high density environments in a study of the effect of the dense cluster environment on star formation history (Rose et al. 1994). This study found that the mean spectral type of evolved stars in early-type galaxies is considerably later and more metal enriched in low-density regions when compared to high density regions. This implies that star formation is essentially truncated in the dense cluster environment at an earlier epoch. This is consistent with studies which show that the galaxies currently showing star formation in the Coma cluster are late infalling disk galaxies. Studies of the stellar content of dumbbell galaxies (Quintana et al. 1990) are in general agreement with these results showing that the typical stellar population is red with strong metallic absorption lines. However, some of the dumbbells also had a blue stellar population in their inner 3 kpc. Since all of the pairs are presumably subject to mutual interaction, it is unlikely that the star formation is triggered by galaxy interaction. Alternatively, those systems with a star forming population may be experiencing a larger scale environmental effect such as a merger. Mergers may affect the evolution of member galaxies through ram-pressure stripping and subcluster tidal effects: both of which affect the star formation history of galaxies. Confirmation of this interpretation of the blue stellar population in dumbbells may come through future optical studies of systems such as the A3266 dumbbell since it is in the midst of a merger and appears to show a tidal distortion.
5.2. The Effect of Merger on Radio Morphology
Robertson & Roach (1990) report a 3.28 Jy source at 408 MHz associated with the A3266 cluster. The Molonglo Reference Catalog type is classified as extended with a WAT morphology. The radio source position is 7.8’ from the X-ray center to the SW. For comparison, the subcluster and main cluster are about 15’ apart. Jones & McAdam (1992) report three sources at the position of the A3266 galaxy cluster in a survey at 843 MHz. The main source at 2.79 Jy and two weaker sources nearby. A3266 also has a narrow angle tail radio galaxy (NAT) 7 arcmin to the NE of the WAT. The location of the sources is to the SW of the X-ray center near the edge of the hottest region. As visible in Figure 1 in Jones & McAdam, the WAT opens up toward the shock front and the NAT tail points toward the shock front. This implies that the shock front has passed by these galaxies and bent their jets in the direction of the post-shock gas motion.
Burns et al. (1994) suggest WAT morphologies may be identified with cluster mergers. This is supported by Gomez et al. (1997) who found that 90% of WAT clusters have evidence of substructure. Bilton et al. (1998) found that ROSAT images of 15 Abell clusters with narrow-angle tail radio sources have evidence of substructure. The velocities of the galaxies themselves are not sufficient to bend the tail into a U-shaped morphology.
Since this merger is in the plane of the sky, it is impossible to use the relative projected separation and velocity dispersion of the subclusters to obtain bound dynamical solutions for the merger as has been done for a number of galaxy clusters. Alternatively, we use X-ray determined pre- and post-shock gas temperatures derived from our temperature map to estimate the relative gas velocity. This calculation has been done for several clusters (Markevitch, Sarazin, & Vikhlinin 1999). We use the formulations of the Rankine-Hugoniot jump conditions contained in their paper which gives the relative pre- and post-shock gas velocity in terms of the pre- and post-shock gas temperature. This analysis does not assume a strong shock. Using Figure 3, the pre- and post-shock gas temperatures are estimated at 6.5 and 13 keV, respectively. Using these parameters in the shock equations gives a relative gas velocity of 1400 km sec-1. This simplified physical picture is consistent with simulations that show gas velocities are commonly in the range of 1000 - 3000 km sec-1 (Roettiger, Burns, & Loken 1996). The WAT has been tentatively identified with an 18.5 magnitude galaxy at 4:29:35.21, -61:38:10.4 (1950) by Jones & McAdam (1992). This galaxy has a mean velocity of 17042 km s-1 (QRS) relative to the main cluster component velocity, 17804 km s-1, reported in Section (4.1). Gomez et al. (1997) used the observed radio parameters of a WAT in NAT in Abell clusters they studied to calculate a required jet bending velocity of 1000 km s-1. The velocity of the post-shock gas we calculated, 1400 km s-1, is nearly a factor of two higher than the line-of-sight galaxy velocity, 766 km s-1, which would provide 4 times the ram-pressure on the galaxy’s jets. Thus, the relatively low galaxy velocity and the higher ram-pressure provided by the merger induced gas motion imply that the WAT morphology is due to the merger rather than the motion of the galaxy in the ICM. This argument is strengthened by the fact that the NAT and WAT have the same alignment, relative to the shock front.
6. Conclusions
We have presented an X-ray temperature map of the A3266 galaxy cluster made from observations obtained with ASCA. The map shows an asymmetric heating pattern with the hottest region at 13.2 keV to the West of the X-ray brightness peak. The galaxy kinematical data has also been partitioned into subclusters and has two components, a main cluster and a loose group to the NE. Both components have a similar velocity so the merger is assumed to be in the plane of the sky. We have found ample evidence of a merger in A3266: shocked gas, increased velocity dispersion in the central region, asymmetric optical and X-ray morphology, and disturbed radio galaxy structure. The temperature constraints were used to estimate the relative pre- and post-shock gas velocity of 1400 km s-1. The ram-pressure together with our reconstructucted merger geometry can account for a WAT and NAT to the SW of the X-ray peak. The high relative velocity between the cD its secondary faint nucleus, which are in a dumbbell morphology, as well as the high, asymmetric velocity dispersion of the cD is attributed to tidal heating from the recent passage of the subcluster through the core of the main cluster.
References
- Beers et al. (1992) Beers, T., Gebhardt, K., Huchra J., Forman, W., Jones, C., & Bothun, G., 1992, ApJ, 400, 410
- Beers et al. (1991) Beers, T., Gebhardt, K., Forman, W., Huchra, J., & Jones, C., 1991, AJ, 102, 1581
- Bliton et al. (1998) Bilton, M., Rizza, E., Burns, J., Owen, F., & Ledlow, M., MNRAS, (in press)
- Burns et al. (1995) Burns, J., et al., 1995, ApJ, 446, 583
- Carter et al. (1985) Carter, D., Inglis, I., Ellis, R., Efstathiou, G., & Godwin, J., 1985, MNRAS, 212, 471
- Churazov et al. (1996) Churazov, E., Gilfanov, M., Forman, W., & Jones, C., 1996, ApJ, 471, 673
- Colless & Dunn (1996) Colless, M., & Dunn, A., 1996, ApJ, 458, 435
- Davis, et al. (1995) Davis, D., Bird, C., Mushotzky, R., & Odewahn, D., 1995, ApJ, 440, 48
- Dempster, Laird & Rubin (1977) Dempster, Laird, & Rubin, 1977, Statist. Soc., B39, 1
- Donnelly et al. (1999) Donnelly, R., Markevitch, M., Forman, W., Jones, C., Churazov, E., & Gilfanov, M., 1998, ApJ, 513.
- Donnelly et al. (1998) Donnelly, R., Markevitch, M., Forman, W., Jones, C., David, L., Churazov, E., & Gilfanov, M., 1998, ApJ, 500, 138
- Evrard, Metzler, & Navarro (1996) Evrard, A., Metzler, C., & Navarro, J., 1996, ApJ, 469, 494
- Forman & Jones (1990) Forman, W., & Jones, C., 1990, in Clusters of Galaxies, eds. W. Oergerle,M. Fitchett, and L. Danly, Cambridge University press: Cambridge, 257
- Gambera et al. (1997) Gambera, M., Pagliaro, A., Antonuccio-Delogu, V., & Becciani, U, 1997, ApJ, 488, 136.
- Girardi et al. (1997) Girardi, M., Fadda, D., Escalera, E., Giuricin, G., Mardirossian, F., & Mezzetti, M., 1997, ApJ, 490, 56
- Gomez et al. (1997) Gomez, P., Ledlow, M., Burns, J., & Pinkney, J, 1997, AJ, 114, 1711
- Henriksen & Jones (1996) Henriksen, M., & Jones, C., 1996, ApJ, 465, 666
- Henriksen & Markevitch (1996) Henriksen, M., & Markevitch, 1996, ApJ, 466L, 79
- Honda et al. (1996) Honda, H., et al. 1996, ApJ, 473L, 71
- Jones & McAdam, (1992) Jones, P.A., & MacAdam, B., 1992, ApJS, 80, 137
- Markevitch (1996) Markevitch, M., 1996, ApJ, 465, L1
- Markevitch (1998) Markevitch, M., Forman, W., Sarazin, C., & Vikhlinin, A., 1998, ApJ, 503, 77
- Markevitch, Sarazin, and Vikhlinin (1999) Markevitch, M., Sarazin, C., & Vikhlinin, A., 1999, Astro-ph 9812005
- Mohr et al. (1995) Mohr, J., Evrard, A., Fabricant, D., & Geller, M., 1995, ApJ, 447, 8
- Quintana et al. (1990) Quintana, H., Santos, J., Dottori, H., & Bica, E., 1990, Rev. Mex. Astron. Astrofis., 21, 209
- Quintana, Ramirez, & Way (1996) Quintana, H., Ramirez, A., & Way, M., 1996, AJ, 112, 36
- Richstone, Loeb, & Turner (1992) Richstone, D., Loeb, A., & Turner, E., 1992, ApJ, 393, 477
- Robertson & Roach (1990) Robertson, J., & Roach, G., 1990, MNRAS, 247, 387
- Roetigger, Burns, & Loken (1996) Roetigger, K., Burns, J., & Loken, C., 1996, ApJ, 473, 651
- Roettiger, Loken, & Burns (1997) Roettiger, K., Loken, C., & Burns J., 1997, ApJS, 109, 307
- Roettiger, Burns, & Pinkney (1995) Roettiger, K., Burns, J., & Pinkney, J., 1995, ApJ, 453, 634
- Rose et al. (1994) Rose, J., Bower, R., Caldwell, N., Ellis, R., Sharples, R., & Teague, P., 1994, AJ, 108, 2054
- Sarazin (1987) Sarazin, C., 1988, X-ray emission from clusters of Galaxies, Cambridge Astrophysics Series, Cambridge: Cambridge University Press.
- Yahil & Vidal (1977) Yahil, A., & Vidal, N. V., 1977, ApJ, 214, 347
- Zabludoff & Zaritsky (1995) Zabludoff, A., & Zaritsky, D., 1995, ApJ, 447, 212