Synchrotron and Inverse Compton Variability in the BL Lacertae object S50716+714
Abstract
We report intensity variations of different spectral components in the BL Lac object S50716+714 detected during coordinated BeppoSAX and optical observations in 1996 and 1998. The transition between synchrotron and inverse Compton emission has been clearly detected as sharp X-ray spectral breaks at around 2-3 keV on both occasions. Correlated optical and soft X-ray variability was found during the second BeppoSAX pointing when intensive optical monitoring could be arranged. The hard (Compton) component changed by a factor of 2 between the two observations, but remained stable within each exposure. During events of rapid variability S50716+714 showed spectral steepening with intensity, a behaviour rarely observed in BL Lacs. We interpret these findings as the probable consequence of a shift of the synchrotron peak emission from the IR/optical band to higher energies, causing the synchrotron tail to push into the soft X-ray band more and more as the source brightens.
Key words: galaxies, Active
1 Introduction
It is generally agreed that the main mechanism powering BL Lacs is synchrotron emission followed by inverse Compton scattering in a relativistic beaming scenario (e.g. Kollgaard 1994, Urry & Padovani 1995, Ghisellini, Maraschi & Dondi 1996). The synchrotron component peaks (in a representation) at energies ranging from infrared frequencies, for Low energy peaked (LBL) BL Lacs (mostly discovered in radio surveys), to hard X-rays for extreme High energy peaked (HBL) BL Lacs (typically discovered in X-ray surveys, Padovani & Giommi 1995, Sambruna, Maraschi & Urry 1996).
S50716+714 is a strongly variable (e.g. Wagner & Witzel 1995, Otterbein etal. 1998) BL Lac object characterized by a spectral energy distribution (SED) peaking at intermediate frequencies ( Hz) compared to LBL and HBL BL Lacs. To date no redshift has been measured for this object.
In this paper we report the detection of intensity and spectral variations involving both the synchrotron and the inverse Compton components of S50716+714. The data are from two observations carried out with the Narrow Fields Instruments (NFI) of the BeppoSAX satellite (Boella et al. 1997a), and from simultaneous optical observations made with a number of small telescopes in Italy and in Korea.
Table 1. - Log of the BeppoSAX observations of S50716+714 and image analysis results
| Date | LECS | Count rate | Count rate | MECS | Count rate (2-10 keV) |
|---|---|---|---|---|---|
| exposure (s) | (0.1-2.keV) | (2-10 keV) | exposure (s) | ||
| 14-NOV-1996 | 13122 | 122509 | |||
| 7-NOV-1998 | 9475 | 31317 |
a Three MECS units;b Two MECS units
2 BeppoSAX observations and data analysis
S50716+714 was observed by BeppoSAX twice on November 14, 1996 and on November 7, 1998. Preliminary results on the first BeppoSAX observation have been reported in Chiappetti etal. (1997).
Screened event lists for the LECS (Parmar etal. 1997) and MECS (Boella et al 1997b) instruments, and the average PDS (Frontera etal. 1997) background-subtracted spectra were taken from the BeppoSAX SDC on-line archive (Giommi & Fiore 1998). The data analysis was performed using the software available in the XANADU package (XIMAGE, XRONOS, XSPEC).
The analysis of the BeppoSAX X-ray images shows that S50716+714 was found in a rather faint state compared to previous observations (e.g. Urry etal. 1996, Wagner etal. 1996). The count rates in the LECS and MECS instruments have been estimated using XIMAGE (Giommi et al. 1991), upgraded at the BeppoSAX SDC to support BeppoSAX imaging data. The observational parameters and the measured count rates for the two instruments are given in Table 1. Significant intensity variations were detected between and during each observation. In particular, the comparison of the 1996 and 1998 data shows that while the count rate in the soft band (0.1-2 keV) was found at the same level, the intensity in the harder 2-10 keV band changed by nearly a factor two both in the LECS and in the MECS 111The MECS instrument was operated with three units in 1996 and with two units in 1998; the 1998 count rate therefore must be multiplied by roughly 1.5 before being compared to the 1996 data instruments. This difference in variability implies that the X-ray spectral shape of S50716+714 changed significantly between the two observations. On time scales of hours X-ray variability was detected only in the low energy band (0.1-2 keV) as discussed in section 4.
Although some signal is present in the PDS data in both observations the source was too faint to be detected above the confusion limit of cgs.
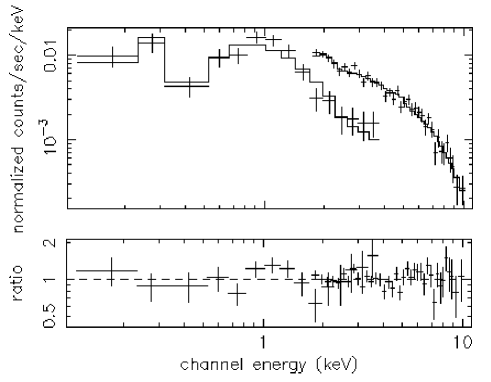
XSPEC spectral fits (over the full 0.1-10. keV LECS and MECS bands) with a single power law model, modified by Galactic absorption as estimated from 21 cm measurements ( cm-2, Dickey and Lockman 1990) gave best fit energy spectral indices and and with high values (= 1.35, 55 d.o.f. and = 1.63, 53 d.o.f, respectively) due to a poor fit at soft energies. These slopes are much flatter than the one found in a previous ROSAT PSPC observation (, 0.1-2.0 keV) during which S50716+714 was also highly variable (Urry etal. 1996, Wagner etal. 1996). We next fitted the data with a broken power law model and fixed to the Galactic value. The spectral fit and the residuals for the 1996 observation are shown in Fig. 1. The resulting spectral parameters with the statistical () uncertainties are reported in Table 2. In both observations the spectral slope is much steeper ( ) at lower energies (possibly consistent with the ROSAT slope), and the spectral break is around 2-3 keV. An F test shows that the broken power law model significantly improves (prob %) the fit compared to the single power law model. The in the second observation () is still relatively high, likely because of the presence of non negligible rapid spectral variability (see below).
Table 2. - Results of LECS+MECS spectral analysis - Broken power law model
| Date | Break energy (keV) | (d.o.f.) | Flux 0.1-2 kev | Flux 2-10 kev | ||
|---|---|---|---|---|---|---|
| (energy index) | (energy index) | erg cm-2 s-1 | erg cm-2 s-1 | |||
| 14-NOV-1996 | 56(48) | |||||
| 7-NOV-1998 | 76(49) |

3 Optical observations
Photometric measurements of S50716+714 were performed with telescopes operated by the Roma, Perugia and Torino groups equipped with CCD cameras, two of them mounting a back illuminated SITe SIA502A chip. The bandpasses used were the standard Johnson B, V, the Cousins RC, IC and the F86, F98 of the Arizona system (Johnson & Mitchell 1975). BVRCIC magnitudes of three standard stars in the field of S50716+714 were taken from Ghisellini et al. (1997) and Villata etal. (1998a), while the magnitude in the Arizona filters of the same stars were calibrated with the primary standard BS2527 (Johnson & Mitchell 1975). Other observations in the RC band were performed with the Kyung Hee University telescope in Korea at the beginning of the BeppoSAX pointing.
During both BeppoSAX X-ray observations the source was not in bright states and at about the same magnitude R13.8. The optical monitoring (Villata et al. 1998b, Massaro etal. 1999a, Raiteri etal. 1999) shows that in November 1996 S50716+714 was in a declining phase following a small burst occurred two weeks before, whereas in November 1998 it was in a mild brightening phase twenty days after the lowest recorded level (RC=14.40) since January 1996.
4 Short-term variability
Figure 2 shows the soft (1.3-3.0 keV) and hard (5.0-10. keV) MECS lightcurve during the long 1996 BeppoSAX observation. Clear variations of up to a factor of two are evident in the low energy curve, while above 5 keV the source flux remains constant within approximately 20%. During this observation we were able to perform simultaneous optical monitoring (in the F86 Arizona band) for about five hours starting at the beginning of the pointing, and covering only the initial part of the X-ray lightcurve. We observed a smooth decline of the luminosity: the F86 magnitude varied from 13.14 at 0.0h UT to 13.23 at 4.6h UT, a similar decrease was also observed in the V band. The decreasing trend is also clearly evident in the first segment of the soft X-ray light curve (Figure 2) and continued in this band for about six hours.
A much better simultaneous coverage was achieved during the 1998 November 7 observation when the source was followed for about 12 hours in three optical bands and in the X-rays. The optical light curves are reported in Figure 3 (upper panel) and show a very similar behaviour with a variation of about 0.1 mag over a time interval of a few hours: the flux decreased from about 19h UT to a minimum at 24h UT and then increased again reaching the previous level in about two hours.
The same general behaviour is clearly apparent in the 1.3-3.0 keV MECS data (Figure 3, lower panel), while at higher energies (5-10 keV) the count rate, similarly to the 1996 observation, is consistent with a constant value. The light curves of Figure 3 indicate the possibility that optical and X-ray variations are not strictly simultaneous: the soft X-ray luminosity could be declining since the beginning of the observation and could reach its lowest level about 2-3 hours before the optical minimum. The following rise, however, seems to start at the same time (about 25h) in all bands. This conclusion, however, cannot be firmly established because of poor statistics.
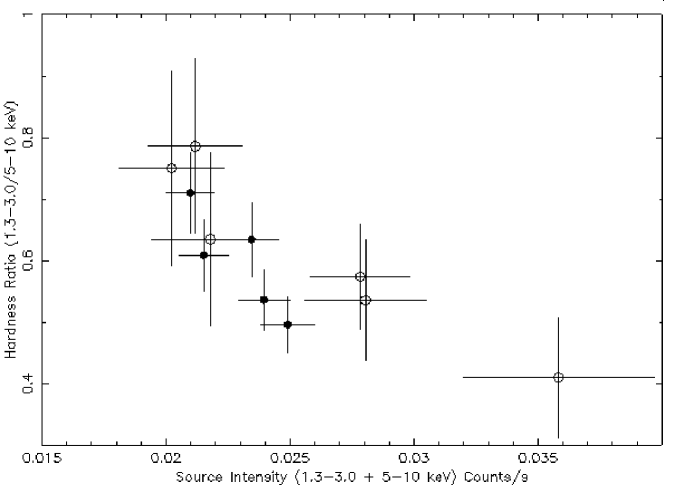
Since the soft and hard X-rays follow different evolutions, the X-ray spectral shape must change with source intensity. This is clearly apparent from Figure 4 where the MECS hardness ratio (1.5-3.0/3.0-10 keV) in both BeppoSAX observations is anti-correlated with intensity: the spectrum steepens when the source brightens. The LECS lightcurve is consistent with these findings, although, in this case the photon statistics is poor due to the lower exposure (Table 1) and less sensitivity of this instrument compared to the MECS.
The correlation between the low energy X-ray and optical light curves observed by us is in contrast with the results of the 1996 April campaign on S50716+714 (Otterbein et al. 1998), but agrees with the 1991 observation (Wagner et al. 1996).
Notice that the amplitude of the X-ray variation (a factor of ) is higher than at optical-IR frequencies, where it is 10 %.

5 Discussion
During the two BeppoSAX and optical observations presented here S50716+714 was detected in a faint state similar to that seen during other X-ray observations when the source was not flaring (Wagner etal. 1996, Otterbein etal. 1998). Nevertheless significant flux and spectral changes were detected, confirming the tendency of this object to be frequently variable.
The X-ray spectrum of S50716+714 can be well represented by a broken power law with steep (energy) slope () until 2-3 keV where a much harder component () emerges.
Figure 5 shows the broad band SED of S50716+714, derived from our simultaneous optical and X-ray data together with nearly simultaneous radio data from the UMRAO database (Aller etal. 1999) and from non-simultaneous photometric data taken from NED. Figure 5 shows that the break detected by BeppoSAX in the soft X-ray spectrum marks the merging of the steep tail of the synchrotron emission into the harder inverse Compton component. A similar transition between synchrotron and Compton emission has been recently detected in BeppoSAX observations of another intermediate BL Lac object: ON 231 (Tagliaferri et al. 1999). The different spectral slopes detected in different luminosity states are then easily explained: the spectrum is steeper when the source is bright and the tail of the synchrotron component dominates the X-ray flux. When the source is faint most of the X-ray flux is due to the flat Compton emission. The fast flux variations detected only in the soft X-rays strongly suggest that rapid variability (correlated with the optical) comes from the high energy tail of the synchrotron component which peaks at a few times Hz.
Long term variability in the hard Compton component is instead apparent from the comparison of the 1996 and 1998 spectral energy distributions (Figure 5).
The different variability timescales in the synchrotron (soft X-ray) and Compton (harder X-rays) emission explain in a natural way the surprisingly poor correlation between the simultaneous RXTE (2-10 keV) and ROSAT HRI (0.1-2.4 keV) light curves reported by Otterbein et al. (1998).
Evidence for spectral steepening with intensity was found in the form of an anticorrelation between hardness ratio and source flux (Figure 4). Such a behaviour is opposite to that observed in many BL Lacs (Giommi etal. 1990, Takahashi etal. 1996, 1999) but can be simply explained as due to variability in the synchrotron tail that steepens the overall X-ray spectrum when the flux of this component increases. This effect was predicted by Padovani and Giommi (1996) to be detectable in intermediate BL Lac objects like S50716+714.

If the optical and X-ray variability are associated, the presence of a lag between the minimum of the light curves in the different bands of the 1998 campaign can be ascribed to the different radiative cooling time of the electrons emitting in the optical and in the X-ray bands. If, instead, the delay is due to geometry (e.g. electrons diffusing out from an injection region while cooling, or a shock travelling in the jet), the cooling time must be shorter than the observed lag. In any case, a firm limit can be derived, by requiring that the cooling time is equal or shorter than the observed time lag.
We therefore require that the synchrotron and self Compton cooling time for optical emitting electrons is equal to or shorter than :
| (1) |
where is the Thomson scattering cross section, is the energy of the particles emitting at the observed frequency, is the magnetic energy density, and is the synchrotron radiation energy density (as measured in the comoving frame), and is the beaming or Doppler factor. The energy is related to the observed frequency by Hz (assuming synchrotron radiation). We then obtain the two limits:
| (2) |
| (3) |
where is the lag time measured in hours and Hz. Assuming , , and , we find G and , in very good agreement with the estimates of Ghisellini etal. (1997). With these parameters, we expect that the peak of the self Compton emission is at MeV.
It has been shown in a number of occasions that the peak of the synchrotron power in BL Lacs tend to move to higher energies during flares (e.g. Giommi etal. 1990, Pian etal. 1998, Takahashi etal. 1999, Malizia etal. 1999, Giommi etal. 1999, Massaro etal. 1999b). In the case of S50716+714, a shift of from the optical band to a somewhat higher energy, would cause a much larger synchrotron contribution to the X-ray flux. In case of large events, involving a shift of of a factor 10 or more (as observed in MKN501, Pian et al. 1998, and 1ES2344+514, Giommi etal. 1999), the steep synchrotron emission would entirely dominate the X-ray spectrum and further flux increases would cause spectral flattening just as observed in many HBL BL Lacs where is at the UV/X-ray frequencies.
The results presented in this paper demonstrate that intermediate BL Lacs are potentially very important to study the relation and the interaction between the two main components in the Spectral Energy Distribution of BL Lacs. Important observational quantities are the determination of the position of synchrotron peak at different intensity levels, and the detailed evolution of the spectral shape in the X-ray band which includes in different mixtures both the Synchrotron and Compton components. Multi-wavelength campaigns on this type of BL Lacs, covering the near infrared and X-rays can lead to a deep understanding of the physical processes powering Blazars and can unravel the origin of the seed photons upscattered to high energies.
-
Acknowledgements.
This research has made use of the ASI-BeppoSAX SDC on-line database and archive system and of the NASA/IPAC National Extragalactic Database (NED). We thank F. Fiore for providing the code to de-redden the XSPEC unfolded spectra used to construct the Spectral Energy Distribution of S50716+714. This research has made use of data from the University of Michigan Radio Astronomy Observatory.
References
- 1 Aller M.F, Aller H.D., Huges P.A., & Latimer G.E., 1999 ApJ 512, 601
- 2 Boella G. etal. 1997a A&AS, 122, 299
- 3 Boella G. etal. 1997b A&AS, 122, 327
- 4 Chiappetti, L., 1997 Proc of ”Cosmic Physics in the Year 2000”, S. Aiello, N. Lucci, G. Sironi, A. Treves , and U. Villante (Eds.). Vol 58
- 5 Dickey, J.M. & Lockman, F. J. 1990, ARAA, 28, 215
- 6 Frontera F. etal. 1997 A&AS, 122, 357
- 7 Ghisellini G. et al. 1997 A&A 327, 61
- 8 Ghisellini G., Maraschi L., & Dondi L., 1996, AAS 120, 503
- 9 Giommi P., Barr P., Garilli B., Maccagni D., Pollock A. 1990, ApJ, 356, 455
- 10 Giommi, P., Angelini, L., Jacobs, P. & . Tagliaferri G. 1991 in ”Astronomical Data Analysis Software and Systems I”, D.M.Worrall, C. Biemesderfer and J. Barnes eds, 1991, A.S.P. Conf. Ser. 25, 100
- 11 Giommi P.,& Fiore F. in Di Gesú V., Duff M.J.B, Heck A., Maccarone M.C., Scarsi L., Zimmermann H.U., 1998, Proc. 5th Workshop on Data Analysis in Astronomy, World Scientific, Singapore, p. 93
- 12 Giommi P., Padovani P. & Perlman E., 1999, MNRAS, in press
- 13 Kollgaard R.I., 1994 Vistas in Astronomy, 38, 29
- 14 Johnson H.L. & Mitchell R.I. 1975 Rev. Mexicana Astron. Astrophys. 1, 299
- 15 Malizia A., etal. , 1999 MNRAS, in press
- 16 Massaro E. etal. 1999a Proc. Int. Conf. ”BL Lac Phenomenon”, Turku, (L.O. Takalo & A. Sillanpää eds.) PASP Conf Series 159, 139
- 17 Massaro E. etal. 1999b, A&A 342, L49
- 18 Padovani, P., Giommi, P. 1995 ApJ, 444, 567
- 19 Padovani, P., Giommi, P. 1996 MNRAS, 279, 526
- 20 Parmar A. etal. 1997 A&AS, 122, 309
- 21 Pian et al. 1998, APJ L,492, L17
- 22 Raiteri C.M., Villata M., Tosti G., et al., 1999, in: Raiteri C.M., Villata M., Takalo L.O. (eds.) Proc. OJ-94 Annual Meeting 1999, Blazar Monitoring towards the Third Millennium. Osservatorio Astronomico di Torino, Pino Torinese (in press)
- 23 Otterbein et al. 1998 - The Active X-ray Sky, Nuclear Physics B (Proc. Suppl.) 69/1-3, p. 415
- 24 Sambruna R.M., Maraschi L., Urry C.M. 1996 ApJ, 463,444
- 25 Takahashi etal. 1996, APJ 470, L89
- 26 Takahashi, T., Madejski, G., & Kubo, 1999, VERITAS Conference, in press (astro-ph/9903099)
- 27 Tagliaferri, G. etal. 1999, A&A submitted.
- 28 Urry C.M., & Padovani P., 1995 PASP, 107, 803
- 29 Urry, C.M. etal. 1996 APJ 463, 424
- 30 Villata M., Raiteri C.M., Lanteri L., et al., 1998a, A&AS 130, 305
- 31 Villata M., Raiteri C.M., Lanteri L., et al., 1998b, in: Tosti G., Takalo L. (eds.) Proc. OJ-94 Annual Meeting 1997, Multifrequency Monitoring of Blazars. Pubblicazioni Osservatorio Astronomico Università di Perugia, vol. 3, 117
- 32 Wagner S.J., Witzel A., 1995, ARAA, 33, 163
- 33 Wagner S.J., Witzel A., Heidt, J. etal. . 1996, AJ, 111, 2187