The Distribution of X-ray Dips with Orbital Phase in Cygnus X-1
Abstract
We present results of a comprehensive study of the distribution of absorption dips with orbital phase in Cygnus X-1. Firstly, the distribution was obtained using archival data from all major X-ray observatories and corrected for the selection effect that phase zero (superior conjunction of the black hole) has been preferentially observed. Dip occurrence was seen to vary strongly with orbital phase , with a peak at 0.95, i.e. was not symmetric about phase zero. Secondly, the RXTE ASM has provided continuous coverage of the Low State of Cygnus X-1 since Sept. 1996, and we have selected dip data based on increases in hardness ratio. The distribution, with much increased numbers of dip events, confirms that the peak is at 0.95, and we report the discovery of a second peak at 0.6. We attribute this peak to absorption in an accretion stream from the companion star HDE 226868. We have estimated the ionization parameter at different positions showing that radiative acceleration of the wind is suppressed by photoionization in particular regions in the binary system. To obtain the variation of column density with phase, we make estimates of neutral wind density for the extreme cases that acceleration of the wind is totally suppressed, or not suppressed at all. An accurate description will lie between these extremes. In each case, a strong variation of column density with orbital phase resulted, similar to the variation of dip occurrence. This provides evidence that formation of the blobs in the wind which lead to absorption dips depends on the density of the neutral component in the wind, suggesting possible mechanisms for blob growth.
keywords:
X rays: stars – stars: individual: Cygnus X-1 – binaries: close – accretion: accretion discs.1 Introduction
1.1 Cygnus X-1
Cygnus X-1 is well known as a black hole binary, with a mass of the compact object in the range 4.8 – 14.7 M (Herrero et al. 1995). It is a High Mass X-ray Binary, and a member of the subclass of Supergiant X-ray Binaries (SXBs) consisting of a neutron star or black hole and an OB supergiant companion. When the compact object is a neutron star, it orbits within a few stellar radii of the OB star, and so is deeply embedded in the stellar wind. For the larger mass of the compact object in Cygnus X-1, the orbit is not so close. Cygnus X-1 is extremely variable over a large range of timescales. First, there are transitions between the low and high luminosity states; Cygnus X-1 spends most of its time in the low luminosity state, but in May 1996, it underwent a transition from the Low State to an intermediate or Soft State (Cui et al. 1996), returning after three months to the Low State. On short timescales it is also very variable, due to the well-known rapid aperiodic variability or flickering, the nature of which is not well understood. The X-ray spectrum of Cygnus X-1 in the Low State can be described by a hard underlying power law plus a reflection component (Done et al. 1992) and a weak soft excess (Bałucińska and Hasinger 1991) which has been identified with blackbody emission from the accretion disk (Bałucińska-Church et al. 1995). In the Soft State, the spectrum is dominated by a strong thermal component produced by enhanced emission from the accretion disk (Dotani et al. 1996; Cui et al. 1997).
1.2 X-ray Dip Properties
X-ray dips are also observed in Cygnus X-1, which usually last several minutes but have been up to 8 hrs in length. During the dips, there is a spectral hardening and the K absorption edge of iron may be seen showing that they are due to photoelectric absorption (e.g. Kitamoto et al. 1984). Spectral fitting of the X-ray spectra of Cygnus X-1 has shown that the column density can increase from the non-dip value of H atom cm-2 to H atom cm -2, in dipping (Bałucińska-Church et al. 1997; Kitamoto et al. 1984). Spectral fitting of dip data, for example from ASCA is consistent with neutral absorber although discriminating between cold and warm absorber was not possible (Bałucińska-Church et al. 1997). Kitamoto et al. (1984) from analysis of a high quality Tenma spectrum of a dip, found an Fe edge implying an ionization state Fe V. It was realised at an early stage that dipping tends to occur at about phase zero of the 5.6 d orbital cycle, i.e. near to superior conjunction of the black hole, but dipping was also seen, for example, at 0.71 (Remillard & Canizares 1984). Possible causes of dipping that have been suggested (see Remillard & Canizares 1984) are: 1) absorption asociated with Roche lobe overflow, matter having however, to be far out of the orbital plane; 2) absorption taking place in the stream flowing from the companion towards the compact object inferred from He II 4686 measurements (Bolton 1975; Treves et al. 1980); 3) absorption in the wind of the companion 4) absorption in blobs in the wind of the companion (Kitamoto et al. 1984). Kitamoto et al. used the duration of short dips to estimate the size of an absorbing cloud as 109 cm, i.e. a relatively small region, and hence associated the absorber with clouds or “blobbiness” in the stellar wind of the companion. The present position is that the physical state and origin of the absorber is not at all well understood.
This contrasts with X-ray dipping in low mass X-ray binaries in which it is generally accepted that dipping is due to absorption in the bulge in the outer accretion disc where the accretion flow from the companion impacts (White & Swank 1982). Spectral evolution in dipping could not be explained in terms of absorption of a single emission component, since in particular sources, the spectrum may become harder, remain energy independent or even become softer during dipping. However, this behaviour has been explained by assuming two emission regions: point-like blackbody emission from the surface of the neutron star plus extended Comptonized emission from the accretion disk corona (Church & Bałucińska-Church 1995; Church et al. 1997, 1998a, 1998b). This model is able to explain the varied and complex spectral evolution in dipping in different sources. The presence of X-ray eclipses in XBT 0748-676 shows that deepest dipping occurs at orbital phase 0.9 consistent with the position of impact on the disk of an accretion flow trailing sideways from the inner Lagrangian point in the binary frame. Thus, dipping is much better understood in LMXBs than in Cygnus X-1.
1.3 Supergiant Stellar Winds
SXBs in general have strong stellar winds and exhibit strong orbital-related decreases in X-ray intensity due to absorption in the wind. In an EXOSAT observation of the archetypal eclipsing SXB, X 1700-371, it was found that large, smooth increases in column density took place between orbital phases 0.8 and 1.2 (Haberl, White & Kallman 1989; hereafter HWK89). This observation was useful since a full orbital cycle of 3.41 day was covered. In X 1700-371, the binary separation is the smallest known, with the compact object orbiting the primary star at 1.4 stellar radii (van Genderen 1977), leading to the dramatic changes in absorption with orbital phase. The increases in column density could be well modelled by absorption in a stellar wind obeying a CAK velocity law (Castor, Abbott & Klein 1975). An additional sharp increase in column density at phase 0.6 could be well modelled as a gas stream originating on the companion, possibly on a tidal bulge (HWK89). In the companion of Cygnus X-1, HDE 226868, the radial velocity curve of the He II 4686 emission line is shifted by about 120∘ with respect to absorption in the companion, also indicating the presence of an accretion stream (Hutchings et al. 1973). In the case of Cygnus X-1, a strong decrease in X-ray intensity with orbital phase has not been seen; however, Kitamoto et al. (1990) showed evidence for a dependence of column density of the quiescent (non-dip) spectra on orbital phase, but with column density increasing from H atom cm-2 to only H atom cm-2, at least one order of magnitude less than in X 1700-371. Apart from this, the only absorption events seen are the X-ray dips. There has been no systematic study of the phase of dipping, and in this work we present such a systematic study, and compare dipping in Cygnus X-1 with absorption effects in other SXBs.
1.4 Survey of X-ray Dips
It has not previously been possible to make a survey of the distribution of dips with orbital phase because of uncertainties in the available ephemeris. The ephemeris previously available of Gies & Bolton (1982) gave an orbital period of 5.59974 0.00008 days, and this precision implies an uncertainty in phase of 0.02 cycle at the present time. However, Ninkov, Walker & Yang (1987) presented evidence for a period increase with time, and phases calculated using their ephemeris now differ by 0.5 from Gies & Bolton values, so that phase becomes completely indeterminate at the present time. In response to this, a new definitive ephemeris has recently been produced based on high quality radial velocity data on HDE 226868, by LaSala et al. (1998). This work concludes that there is no evidence for an evolving period, and the accuracy of the period determination of P = 5.5998 0.0001 days in the new ephemeris allows accurate retrospective determination of orbital phase back many years from the present epoch; in fact, 85 years are required before an uncertainty of 0.1 cycle accumulates. The epoch of the new ephemeris is given for the superior conjunction of the black hole, i.e. = 0 with the companion between the observer and the black hole, and thus corresponds to the orientation in which X-ray dips are thought to take place.
| Date | Observatory | Ref. | ||
|---|---|---|---|---|
| 1972 | Nov | 6th | Copernicus | 1 |
| 1972 | Dec | 31st | OSO-7 | 2 |
| 1973 | May | 16th | Copernicus | 1 |
| 1973 | Sep | 4th | Copernicus | 1 |
| 1973 | Oct | 30th | Copernicus | 1 |
| 1973 | Nov | 5th | Copernicus | 1 |
| 1976 | Aug | 4th | SAS-3 | 3 |
| 1976 | Oct | 10th | SAS-3 | 3 |
| 1977 | Aug | 10th | SAS-3 | 3 |
| 1978 | Nov | 21 | Einstein MPC | 4 |
| 1979 | Apr | 15th | Einstein MPC | 4 |
| 1979 | May | 9th | Einstein MPC, SSS | 4,5 |
| 1979 | May | 13th | Einstein MPC, SSS | 4,5 |
| 1979 | May | 30th | Einstein MPC | 4 |
| 1979 | Oct | 12th | Einstein MPC | 4 |
| 1979 | Oct | 18th | Einstein MPC | 4 |
| 1983 | Sep | 9th | TENMA | 6 |
| 1984 | Jul | 8th | EXOSAT ME | 7 |
| 1985 | Oct | 15th | EXOSAT ME | 7 |
| 1987 | Aug | 5th | GINGA LAC | 8 |
| 1990 | May | 9th | GINGA LAC | 8 |
| 1990 | Dec | 6th | BBXRT | 9 |
| 1991 | Apr | 18th | ROSAT PSPC | 10 |
| 1991 | Jun | 6th | GINGA LAC | 8 |
| 1994 | Nov | 23rd | ASCA GIS | 11 |
| 1995 | May | 9th | ASCA GIS | 12 |
References: 1 Mason et al. 1974; 2 Li & Clark 1974; 3 Remillard & Canizares 1984; 4 Bałucińska 1988; 5 Pravdo et al. 1980; 6 Kitamoto et al. 1984; 7 Bałucińska & Hasinger 1991; 8 present work; 9 Marshall et al. 1993; 10 Bałucinska-Church et al. 1995; 11 Ebisawa et al. 1996; 12 Bałucińska-Church et al. 1997
We are thus able to present a survey of the distribution of dipping with orbital phase, and this is based on two sources of data. First, a survey has been made using a large body of archival data from Copernicus, Einstein, EXOSAT, TENMA, GINGA, ROSAT and ASCA. Secondly, we have used data from the Rossi-XTE All Sky Monitor (ASM) obtained between September 1996 and the present.
This distribution shows a smooth variation with orbital phase which is strikingly similar to the observed variation of column density with phase in the HMXB X 1700-371 (HWK89), superimposed on the smooth variation is evidence for a stream. Consequently, we attempt simple modelling of the wind of HDE 226868 assuming that most of the wind is highly ionized by the X-ray flux from the black hole, and from the density of the neutral component of the wind, derive the variation of column density along lines-of-sight with orbital phase.
1.5 Wind-Driving Mechanisms
The SXBs, including Cygnus X-1 of spectral type O9.7Iab, consist of OB supergiants and a compact object, and the massive companion has a strong stellar wind as do isolated OB stars. The stellar wind in such systems is driven by the radiation pressure of UV photons on the gas. Calculations of the radiation force have been made by Lucy & Solomon (1970) based on resonance lines from a few elements, by Castor, Abbott and Klein (CAK; 1975) based on the combined effect of weak lines, and by Abbott (1982) who concluded that the correct approach uses the strong lines of many elements. However, in the case of binary systems, the X-ray luminosity L may result in photoionization which will suppress the radiative driving force. For high L, radiative acceleration will be totally suppressed on the side of the companion exposed to X-rays. A two-dimensional hydrodynamic coded was used by Blondin et al. (1990) to include effects such as radiative driving of the wind, suppression by photoionization, X-ray heating, radiative cooling and gravitational and rotational forces in the binary system. By application of this code to high X-ray luminosity systems such as Cen X-3 and SMC X-1 Blondin (1994) produced two-dimensional maps of particle density for L between and erg s-1 showing dramatically the suppression of the normal wind and also demonstrated the production of a photoionization wake where the normal wind meets a stalled wind, and of a shadow wind originating in the X-ray shadow moving sideways in the binary system towards the compact object on the upstream side. The simulations of particle density are then used to calculate column density values along lines-of-sight to the X-ray source on the assumption that material having ionization parameter 2000 will contribute to photoelectric absorption.
In the case of Cyg X-1, we take a simple, approximate approach of calculating the density of the recombined component of a wind that is assumed to be fully ionized and from this derive column densities as a function of orbital phase for comparison with the dip distribution.

2 Observations
2.1 Archival data

For the first part of our analysis, we have included the data from a wide range of X-ray missions as shown in Table 1, which gives the date of the start of each observation, the observatory mission, and the authors. In using data published by other authors, we have used tables and figures showing the times of dipping from the literature. In other cases, data was analysed by ourselves, i.e. Einstein MPC: Bałucińska (1988), EXOSAT: Bałucińska and Hasinger (1992), GINGA: Present work, ROSAT: Bałucińska-Church et al. (1995), and ASCA: Bałucińska-Church et al. (1997).
2.2 Rossi-XTE ASM data
The All-Sky Monitor (ASM; Levine et al. 1996) on board Rossi-XTE (Bradt, Rothschild & Swank 1993) scans the sky in 3 energy bands: 1.5–3, 3–5 and 5–12 keV with 90 s exposure. Any source is scanned 5–20 times per day. We have extracted data from the archive, in these 3 energy bands, including data from September 6th, 1996 until the present (October 1998), i.e. including data labelled as days 250 - 998 from the start of ASM operation. The start time was chosen so as to exclude the period between 1996 May to August when Cygnus X-1 was in the Soft State; thus all of the results presented relate to the Low State of the source.
3 Analysis and Results
3.1 The Historical Data
In all cases of archival data, orbital phases were calculated using the new ephemeris of LaSala et al. (1998). First, the data were sorted into 100 phasebins, and a count was added to each bin in which dipping activity was observed. In Cygnus X-1 a succession of narrow X-ray dips usually occurs, and so we add a single count to a given phasebin when dipping is seen, not a count for each narrow dip.
There would be a strong selection effect due to the fact that coverage of phases has deliberately concentrated on phases close to zero. To compensate for this, we also made a count of the number of times each phasebin was observed, and the histogram of dip frequency versus phase was normalized by dividing the dip count by the phasebin count. A selection effect may remain, as data not analysed by ourselves, was selected by the various authors as suitable for publication. Finally, to improve statistics, phasebins were grouped together in fives to give 20 bins per orbital cycle, and this is shown in Fig. 1.
It can be seen that the distribution peaks at about phase 0.95 with a full width at half maximum of 0.25. This effect, i.e. the peak of the distribution being offset from phase zero, could also be seen in individual datasets; for example, Remillard and Canizares (1984) noted that short dips tended to occur before phase zero, whereas one 8 hr dip was centred on phase zero. This will be discussed fully after the next section on results from the RXTE ASM.
3.2 RXTE All Sky Monitor Data
Data were extracted from the ASM archive and stored as entries in a file, each entry corresponding to a single 90 s observation. Each entry consisted of the time, and the count rate in each of the 3 standard bands: 1.5–3 keV, 3–5 keV and 5–12 keV. From these, hardness ratios were constructed using the ratio of count rates in the bands 3–5 keV and 1.5–3 keV designated HR1, and the ratio of count rates in the bands 5–12 keV and 3–5 keV, designated HR2. The lightcurve in the total energy band of the ASM, together with HR1 and HR2, is shown in Fig. 2. A brief period of enhanced intensity can be seen at day 920; however, this data is excluded by our procedure of selecting data dip data using hardness ratios (below). Although the count rate varies between 15 and 140 count s-1, mostly due to flaring activity, the hardness ratios HR1 and HR2 were very stable, with mean values 1.10 and 1.52, respectively and were unaffected by flaring. The points with hardness ratio significantly larger than these means are dip data, for which HR1 can increase to 40 and HR2 can increase to 10.
Dip events can be seen in the light curve, but are more obvious in HR1 and HR2. The data folded on the orbital period are shown in Fig. 3. There is a clear anti-correlation between the hardness ratios and the count rate, with a reduction in count rate occuring just before phase zero, and associated hardening of the spectrum showing that it is due to absorption. Larger increases of hardness ratio in the lower energy bands would be expected for simple absorption; however, as partial covering takes place, the decrease in intensity at low energies is reduced by the presence of the uncovered part of the emission. The data can also be plotted as a colour-colour diagram, i.e. as HR2 against HR1, and this is shown in Fig. 4. We next discuss how spectral simulations were used to elucidate the behaviour seen in Fig. 4, and how selection of dip data was made.
3.2.1 Flux calibration of the ASM and simulations of dipping in the ASM colour-colour diagram

To understand the spectral changes taking place in the data plotted in Fig. 4, we have simulated non-dip and dip spectra and obtained the fluxes in the 3 ASM bands. These were then converted to count rates in the 3 bands, and from these, the two hardness ratios HR1 and HR2 were derived. To calibrate the flux/count rate relations in each of the bands, not having an instrument response for the ASM, we have used ASM data from the Crab Nebula. The X-ray flux of the Crab in each of the standard bands was calculated and compared with the mean value of count rate in each band integrated over a long period. This gives calibration factors of erg cm-2 s-1 per count s-1 for each of the 3 energy bands. This calibration makes the assumption that the spectral shape of the source does not differ markedly from that of the Crab Nebula over the energy range of the ASM.

Next, we simulated dipping in Cygnus X-1 for a wide range of spectral parameter values as follows. Spectral fitting of the source in the Low State showed that the contribution of the blackbody soft excess emission from the accretion disk is small, and so the source may be modelled with a power law spectrum which is partially covered during dipping (Bałucińska-Church et al. 1997). Good fits were obtained using neutral absorber with solar abundances (cross-sections of Morrison & McCammom 1983). Dip spectra are normally made by intensity selection to accumulate sufficient counts, and so include dip data due to a succession of short dips, plus non-dip data between the dips, and this accounts for the partial covering required in fitting. The parameters f, the partial covering fraction and the column density can cover wide ranges of values and, in simulations, we spanned the whole range of this two-dimensional space in a set of calculations making small steps in the parameter values, calculating the flux in each of the ASM bands, and plotting the results on a colour-colour diagram of HR2 versus HR1. These simulated data show all the features of the actual colour-colour diagram of Cygnus X-1 data obtained from the ASM (Fig. 4), and allow us to interpret the real data in different positions on the plot.
First, the limited number of real dip points moving horizontally in HR1 with little increase in HR2 correspond to dipping with partial covering fraction f = 1.0, i.e. simple absorption in which the source region is completely covered by absorber. Along this horizontal line, increases from low values to a maximum of H atom cm-2. Other positions on the colour-colour diagram have f 1. For a given f value, increasing traces a loop on the plot with column density increasing in an anticlockwise sense. For very high , the count rate in the highest energy band begins to be affected, and points move on a vertical line at small HR1, so that as continues to increase, the data points move vertically downwards.
Based on the above understanding of the spectral changes taking place in the source revealed in Fig. 4, we selected dip data by taking points with a value of HR1 2 and HR2 2.5. The plots of HR1 and HR2 against time were very flat (Fig. 2) allowing this selection method to be used. Kitamoto et al. (1990) found evidence for a variation of the non-dip column density with orbital phase from H atom cm-2 to H atom cm-2, which they associated with varying in the stellar wind. Our simulations show that such increases in will be excluded from the selection of dip data.
For each point selected from the total data set in Fig. 4 as dip data, the orbital phase was calculated using the new ephemeris (LaSala et al. 1998) and the distribution is shown in Fig. 5. The data are not normalised by the time spent at each phase as the observation of orbital phases was almost uniform. In principle, it might be possible to derive values for each data point using our simulations; however this is made difficult by the fact that any point on the colour-colour diagram has particular and f values, and adjacent points can have very different . Although we cannot produce a plot of versus phase, by plotting HR1 against phase for the selected data, it appears that the points at 0 have the largest values of HR1 and thus the largest values of column density.

3.2.2 The distribution of dipping with phase
The results shown in Fig. 5 show a similar effect to the historical data, i.e. the peak of dipping occurs offest from phase zero at phase 0.95. In addition, a peak at phase 0.6 can be seen. The statistics are much improved compared with the archival data. A total of 12519, 90 s observations from the ASM were extracted, made at an average of 16.7 observations per day, of which about 3% were dip events giving a total of 379 dip events compared with 55 events in the archival data. The two effects seeen in the distribution against orbital phase are very similar to the effects seen in SXBs in measurements of column density of the X-ray spectrum as a function of orbital phase, e.g. in X 1700-371 (HWK89). An asymmetry in about phase zero and a peak in are seen in this case. Thus there is evidence that the distribution of dipping relates ultimately to the properties of the stellar wind and the existence of a stream. It is thus important to know the variation of neutral wind density with orbital phase in Cygnus X-1, and we have carried out modelling of the stellar wind as discussed in the next section.
3.3 Wind modelling
We wish to derive column densities as a function of orbital phase for comparison with our results on the distribution of dipping with phase. Cygnus X-1 is luminous and we may expect suppression of the radiative wind driving force in particular spatial regions. Consequently we make approximate calculations of wind density and ionization parameter to investigate the extent of the suppression, and then estimate values of .
First we calculate the ionization parameter = , where n is the particle density, as a function of distance r from the black hole to determine the extent of suppression of the wind driving force. This is done for different orbital phases along lines of sight that will be used to integrate particle number density to give column density, and for simple assumptions about the ionization state of the wind, i.e. about whether acceleration is suppressed or not. Assuming first that the wind is generally highly ionized we calculate the densities of neutral atoms and of electrons in a wind which drifts with constant velocity 30 km s-1 as a velocity typical of turbulent motions in the atmosphere of HDE 226868 (Gies & Bolton 1986). The total particle density in the wind ( = + ) is given by
where is the mass accretion rate, R is the distance from the centre of the primary, is the mass of the hydrogen atom and v is the wind velocity. Spherical symmetry of the wind is assumed. A simple approach was taken considering only the equilibrium between production of ions by photoionization of a solar abundance mixture, and radiative recombination of H+ ions. This results in a neutral component of the order of 1% of the total wind density. We are neglecting ionization by the primary (Abbott 1982) which will reduce the neutral fraction substantially further. However, it is only the X-ray flux which suppresses radiative driving. If the number density of X-ray photons is , the photoionization rate is , and the recombination rate is , where the photoionization rate coefficient k, is related to the cross-section via k = (c is the velocity of light) and is the recombination coefficient. The photoionization cross-sections of Morrison & McCammon (1983) were used. From Allen (1973), = , having a value = for T = 104 K. In equilibrium,
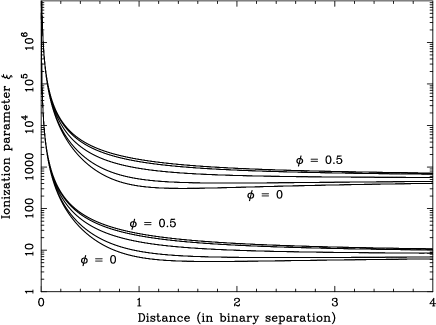
The photon number density is given by = where is the mean energy, assumed to be 1 keV and L = erg s-1 typical of the Low State. From the above, a simple quadratic equation for follows, allowing , , the fractional ionization and to be obtained. Fig. 6 (lower curves) shows that is high close to the black hole, but falls to 100 at distances greater than 0.3 of the binary separation; thus the Strömgren region where radiative acceleration is suppressed does not extend down to the surface of the companion. In view of this, we also derived curves using a CAK law assuming no ionization of the wind as shown in the upper curves of Fig. 6. This assumed the velocity v(R) increases as where = 2100 km s-1, = 17.0 R, = M yr-1 (Herrero et al. 1995) and is 0.5. In this case, is greater than 1000 even at distances of several binary separations from the black hole. With these two extreme models was obtained by integrating along lines of sight to the X-ray source for a range of orbital phases between 0 – 0.5 for an inclination angle of 35∘ and a binary separation of 40.2 R (Herrero et al. 1995).
It can be seen that the two models produce a similar variation with phase. The high values of from the drift models would be easily measurable from the X-ray spectra. The only observational evidence (Kitamoto et al. 1990) shows a variation of similar shape between 6 and H atom cm-2. The correct description clearly lies between our 2 extremes; we concentrate on the relation between the dipping and the variation. In each case, the variation is strong (a factor of 6 for the drift model and a factor of 10 in the other case) suggesting that blob formation, and thus dip formation, depends on the neutral density component in the wind.

4 Discussion
Modelling of the stellar wind of HDE 226868 should take into account 2 main effects: radiative driving of the wind and suppression of the driving force by photoionization due to the X-ray source. To calculate the column density appropriate to X-ray observations of Cygnus X-1 at various orbital phases would require three-dimensional calculations of the particle number density in the wind combined with calculations of the ionization parameter . Suppression of the radiative driving force takes place for 100 (Blondin 1994). Detailed modelling using a 2-dimensional hydrodynamic code was carried out for the wind density in luminous SXB by Blondin (1994). In high luminosity systems such as Cen X-3 and SMC X-1, strong effects due to the X-ray source were seen with a Strömgren region about the X-ray source in which radiative driving was suppressed. In Cen X-3, for L erg s-1, this region extended to all of the X-ray illuminated wind (i.e. not in the shadow of the companion). Column densities were obtained by integrating the particle densities where was 2000, i.e. assuming that all material not fully ionized contributes to . In our case, the X-ray source is bright even in the Low State with L erg s-1 and it might be thought that strong suppression of radiative acceleration takes place. However, the binary separation of 40.2 is larger in the black hole binary than the 19 in Cen X-3. Thus the flux of the X-ray source is reduced by a factor of 4 compared with Cen X-3 so that simple scaling implies total suppression of radiative driving in the X-ray illuminated wind only for L erg s-1. This depends primarily on and our simple calculations show that wind with totally suppressed driving force would result in 100 only relatively close to the black hole. Thus it is clear that detailed hydrodynamic simulations of Cygnus X-1 are required to delineate regions where radiative driving is suppressed. This would also reveal the details of the high density photoionization wake where normal wind in the X-ray shadow impacts on stalled wind (Fransson & Fabian 1980; Blondin 1994), and of the shadow wind which emerges from the X-ray shadow and may contribute to absorption (Blondin 1994).
We have shown that there is a strong dependence of the frequency of dipping in Cygnus X-1 with orbital phase, and that this correlates approximately with the variation of column density of the neutral component of the stellar wind with phase . This suggests that dipping is caused by blobs of largely neutral material, the formation of which may depend simply on the neutral density at any point in the wind. Our previous spectral fitting has shown that column density is typically between 2 and H atom cm-2 in dip spectra (Bałucinśka-Church et al. 1997). For a blob diameter of cm (Kitamoto 1984) this gives densities of – cm-3. Our estimates for the wind density have maximum values of total wind density between a few and cm-3 for no suppression of radiative driving and total suppression, respectively. A more realistic typical value might be cm-3. Thus the blob density is greater than the ambient wind density by factors of 100 - 1000. In such a higher density region, will be reduced, so that a high value in the ambient wind of 1000 would be reduced to 1 - 10, such that the photoionizing effects of the X-ray source are markedly reduced. One possibility for blob formation is that neutral material in the wind can act as a nucleus for blob growth, since in the X-ray shadow of a small blob, photoionization will be reduced and recombination into the blob will be rapid. Other possibilities for blob formation also exist. For example, the interaction of normal wind with stalled wind can lead to a high density region trailing behind the compact object (Fransson & Fabian 1980; Blondin 1994). In this region, instabilities and density enhancements may form. However this would not be exected to produce dipping having the basic symmetry about 0.5, i.e. the line of centres, that we see. Similarly this would not be expected to account for the peak in dipping we see at 0.6 as the high density region extends over a large range of angles with respect to the primary whereas a stream produced by Roche-lobe overflow or tidal enhancement does not.
In Cygnus X-1, for the first time we find definite evidence for a stream from X-ray data in the enhanced number of dips at 0.6, and the source appears to be similar to X 1700-371 in which it was concluded that a stream was the cause of enhanced absorption at phase 0.6 (HWK89). Petterson (1978) showed that HDE 226868 is filling its Roche lobe and will therefore will produce a stream which may be expected to produce absorption effects at 0.6 Even if the star was only close to filling its Roche lobe, Blondin et al. (1991) have shown that a stream will still develop by tidal enhancement of the stellar wind caused by the compact object. In the neutron star systems modelled, the formation of a stream depends on the binary separation. However, a clear result of this work was that the stream is produced at phase 0.6. In either case, a stream is produced at a phase similar to that we found here. Blob formation in a stream would, of course, be easier than in the wind because the density is already increased over the wind density reducing .
In summary, we have shown that the distribution of dipping with orbital phase correlates approximately with the variation of column density of the neutral component of the stellar wind of HDE 226868 with phase. There is in addition, extra dipping at 0.6. These effects resemble the asymmetry of absorption in the wind of Supergiant X-ray Binaries, suggesting that the formation of absorbing blobs depends on the neutral density, and thus reflects the variation.
Acknowledgments
This paper uses data made publicly available, and we thank the ASM/RXTE Team, including members at MIT and NASA/GSFC. We thank Dr. J. Lochner for useful discussions on the flux/count rate calibrations for the ASM. MBC and MJC thank the British Council and the Royal Society for financial support.
References
- [] Abbott D. C., 1982, ApJ 259, 282
- [] Allen C.W., 1973, Astrophysical Quanties, London, Athlone Press
- [] Bałucińska M., 1988, PhD thesis, Polish Acad. Sci.
- [1991] Bałucińska M., Hasinger G., 1991, A&A, 241, 439
- [1995] Bałucińska-Church M., Belloni T., Church M. J., Hasinger G., 1995, A&A, 302, L5
- [1997] Bałucińska-Church M., Takahashi T., Ueda Y., Church M. J., Dotani T., Mitsuda K., Inoue H., 1997, ApJ, 480, L115
- [1990] Blondin J. R., Kallma T. R., Fryxell B. A., Taam R. E., 1990, ApJ 356, 591
- [1991] Blondin J. M., Stevens I. R., Kallman T. R., 1991, ApJ 371, 684
- [1994] Blondin J. M., 1994, ApJ 435, 756
- [] Bolton C. T., 1975, ApJ, 200, 269
- [1993] Bradt H. V., Rothschild R. E., Swank J. H, 1993, A&AS, 97, 355
- [] Castor J. L., Abbott D. C., Klein R. I., 1975, ApJ, 195, 157
- [1995] Church M.J., Bałucińska-Church M., 1995, A&A, 300, 441
- [1997] Church M. J., Dotani T., Bałucińska-Church M., Mitsuda K., Takahashi T., Inoue H., Yoshida K., 1997, ApJ, 491, 388
- [1998] Church M. J., Bałucińska-Church M., Dotani T., Asai K., 1998, ApJ, 504, 516
- [] Church M. J., Parmar A. N., Bałucińska-Church M., Oosterbroek T., Dal Fiume D., Orlandini M., 1998b, A&A, 338, 556
- [] Conti P. S., 1978, A&A, 63, 225
- [] Cui W., 1996, IAU Circ. 6404
- [] Cui W., Heindl W. A., Rothschild R. E., Zhang S. N., Jahoda K., Focke W., 1997, ApJ, 474, L57
- [] Dotani T., Negoro H., Mitsuda K., Inoue H., Nagase F., 1996, IAU Circ. 6415
- [] Done C., Mulcahey J. S., Mushotzky R. F., Arnaud K. A., 1992, ApJ, 395, 275
- [] Ebisawa K., Ueda Y., Inoue H., Tanaka Y., White N. E., 1996, ApJ, 467, 419
- [] Fransson C., Fabian A. C., 1980, A&A, 87, 102
- [] Gies D. R., Bolton C. T., 1982, ApJ, 260, 240
- [] Haberl F., White N. E., 1990, ApJ, 361, 225
- [] Haberl F., White N. E., Kallman T. R., 1989, ApJ, 343, 409
- [] Herrero A., Kudritzki R. P., Gabler R., Vilchez J. M., Gabler A., 1995, A&A, 297, 556
- [] Hutchings J. B., Crampton D., Glaspey J., Walker G. A. H., 1973, ApJ, 182, 549
- [1984] Kitamoto S., Miyamoto S., Tanaka Y., Ohashi T., Kondo Y., Tawara Y., Nakagawa M., 1984, PASJ, 36, 731
- [] Kitamoto S., Takahashi K., Yamashita K, 1990, PASJ 42, 85
- [] LaSala J., Charles P. A., Smith R. A. D., Bałucińska-Church M., Church M. J., 1998, MNRAS, In Press
- [1998] Levine A. M., Bradt H. V., Cui W., Jernigan J. G., Morgan E. H., Remillard R., Shirey R. E., Smith D. A., 1996, ApJ, 469, L33
- [1974] Li F. K., Clark G. W., 1974, ApJ, 191, L27
- [] Lucy L. B., Solomon P. M., 1970, ApJ, 159, 879
- [1974] Mason K. O., Hawkins F. J., Sanford P. W., Murdin P., Savage A., 1974, ApJ, 192, L65
- [] Marshall F. E., Mushotzky R. F., Petre R., Serlemitsos P. J., 1993, ApJ, 419, 301
- [] Morrison R., McCammon D., 1983, ApJ, 270, 119
- [] Ninkov Z., Walker G. A. H., Yang S., 1987, ApJ, 321, 425
- [] Petterson J. A., 1978, ApJ 224, 625
- [1980] Pravdo S. H., White N. E., Kondo Y., Becker R. H., Holt S. S., Serlemitsos P. J., McClusky G. E., 1980, ApJ, 237, L71
- [1984] Remillard R., Canizares C. R., 1984, ApJ, 278, 761
- [] Stark A. A., Gammie C. F., Wilson R. W., Bally J., Linke R. A., Heiles C., Hurwitz M., 1992, ApJ Suppl, 79, 77
- [] Treves A., Chiappetti L., Tanzi E. G., Tarenghi M., Gursky H., Dupree A. K., Hartmann L. W., Raymond J., Davis R. J., Black J., 1980, ApJ, 242, 1114
- [] van Genderen M., 1977, A&A, 54, 683
- [] White N. E., 1989, A&A Rev 1, 85
- [] White N. E., Kallman T. R., Swank J. H., 1983, ApJ, 269, 264
- [] White N. E., Swank J. H., 1982, ApJ, 253, L66