Hubble Space Telescope Imaging of the CFRS and LDSS Redshift Surveys – IV. Influence of mergers in the evolution of faint field galaxies from
Abstract
Hubble Space Telescope images of a sample of 285 galaxies with measured redshifts from the CFRS and Autofib–LDSS redshift surveys are analysed to derive the evolution of the merger fraction out to redshifts . We have performed visual and machine-based merger identifications, as well as counts of bright pairs of galaxies with magnitude differences mag. We find that the pair fraction increases with redshift, with up to of the galaxies being in physical pairs at . We derive a merger fraction varying with redshift as , after correction for line-of-sight contamination, in excellent agreement with the merger fraction derived from the visual classification of mergers for which . After correcting for seeing effects on the ground-based selection of survey galaxies, we conclude that the pair fraction evolves as . This implies that an average L∗ galaxy will have undergone 0.8 to 1.8 merger events from to , with 0.5 to 1.2 merger events occuring in a 2 Gyr time span at around . This result is consistent with predictions from semi-analytical models of galaxy formation. From the simple co-addition of the observed luminosities of the galaxies in pairs, physical mergers are computed to lead to a brightening of 0.5 mag for each pair on average, and a boost in star formation rate of a factor of 2, as derived from the average [O II] equivalent widths. Mergers of galaxies are therefore contributing significantly to the evolution of both the luminosity function and luminosity density of the Universe out to .
keywords:
cosmology: observations – galaxies: evolution – galaxies: interactions1 Introduction
Mergers of galaxies have long been known to play an important role in the evolution of galaxies. Detailed case studies in the local Universe have shown the powerful effect mergers can have on galaxy morphologies and on the triggering of star formation (e.g. Kennicutt 1996; Schweizer 1996). The importance of mergers has also been emphasized by computer simulations involving either major mergers of galaxies with comparable mass, or the merger of dwarf galaxies with a more massive galaxy (Mihos & Hernquist 1994a,b; Hernquist & Mihos 1995; Mihos 1995, hereafter M95).
If merging is at work at all during the lifetime of galaxies, then the space density, mass, luminosity, and morphology of galaxies must change with epoch. Several authors suggest that merging systems can explain part (or all) of the excess number of galaxies observed in deep photometric galaxy counts (Rocca-Volmerange & Guiderdoni 1990; Broadhurst, Ellis & Glazebrook 1992). Mergers can influence such surveys either by the separate counting of individual systems ultimately destined to merge, or through more subtle effects. For example, dissipative mergers are expected to trigger some degree of star formation, so in magnitude-limited samples one expects to observe less massive galaxies brightened above observational limits by merger-induced star-formation activity.
The evolution of the merger rate with redshift is a key observable that can be used to test galaxy formation models (see Abraham 1998 for a review). In particular, semi-analytical models for galaxy formation in hierarchical clustering scenarios postulate that galaxies assemble from the successive merger of smaller sub-units. Such models make concrete predictions for the relationships between evolution in the morphological mix and redshift-dependent merger rates (Baugh, Cole & Frenk 1996; Baugh et al. 1998; Kauffmann, White & Guiderdoni 1993; Kauffmann 1996).
Evolution of the luminosity function of galaxies at high redshifts (Lilly et al. 1995, Ellis et al. 1996) indicates that, on the whole, either the typical luminosity of galaxies was brighter by 1 magnitude at , or that there were 3 times more galaxies at this epoch, or that a combination of both luminosity and number density evolution is occurring. Disentangling the effects of these two phenomena is central to understanding the nature of field galaxy evolution. Luminosity evolution has been shown to play an important role in the evolution of disk galaxies, from observations with the Hubble Space Telescope (HST) of systems from the CFRS–LDSS sample (Schade et al. 1995; Lilly et al. 1998). On the other hand, number-density evolution remains poorly constrained.
There are several reasons why meaningful constraints on number-density evolution have been difficult to obtain. One needs large galaxy samples with redshifts measured up to large look-back times and deep high spatial resolution images in order to observe the close environment of galaxies at better than 1 kpc resolution. Furthermore, the time-scales associated with merging are not straightforward to constrain. There is considerable uncertainty in any transformation from an “instantaneous” merger rate (computed directly from observations at a given look-back time) to a “global” merger rate indicating the likelihood for a galaxy to experience merging from any epoch to the present.
Data from HST indicates that, at moderate redshifts, there is a larger proportion of faint galaxies exhibiting peculiar morphologies suggestive of merging (Griffiths et al. 1994; Driver et al. 1995; Glazebrook et al. 1995, Neuschaefer et al. 1997). Following early attempts to measure the evolution of the merger fraction (Zepf & Koo 1989), these HST observations complement studies of close pairs of galaxies from redshift survey samples (Carlberg et al. 1994; Yee & Ellingson 1995; Woods et al. 1995; Patton et al. 1997) out to intermediate redshifts . In a pair study of a complete sample of galaxies with measured redshifts, Patton et al. (1997) find that at a mean redshift , % of galaxies are in close physical pairs, compared to % locally (Patton et al. 1997), leading to a change in the merger rate with redshift proportional to .
The Canada–France Redshift Survey (CFRS, Lilly et al. 1995; Le Fèvre et al. 1995), and LDSS surveys (Glazebrook et al. 1995; Colless et al. 1993), provide samples with several hundred galaxies with redshifts measured up to . Well-defined sub-samples from these surveys have been observed with HST, allowing us to obtain quantitative information on the morphological type mix (Brinchmann et al. 1998), the central disk and bulge surface brightnesses (Lilly et al. 1998; Schade et al. 1999), and, in the present paper, the close environment of the survey galaxies and the merger rate as a function of redshift.
In the present paper we present the measurements of the merging rate of galaxies out to redshifts , from HST cycle 4 and cycle 5 imaging of a total sample of 285 galaxies. The paper is organized as follows. Our sample is described in Section 2. Visual identifications of merging galaxies, as well as pair counts based on both visual and computer-based classifications, are presented in Section 3. The evolution of the merger rate out to is computed in Section 4, and the luminosity enhancement and selection effects introduced by mergers on the magnitude limited sample are evaluated in Section 5. A discussion of the results is presented in Section 6. We use km s-1 Mpc-1 and throughout this paper.
2 HST imaging sample
Imaging data was primarily acquired during HST cycles 4 and 5 with the Wide Field and Planetary Camera 2 (WF/PC2) and the F814W filter. In addition, field CFRS 1415+52 (set on a deep VLA field; Fomalont et al. 1991) was observed with HST as part of the “Groth strip” campaign (Groth et al. 1994), and was included in the present data set. Exposure times varied between 4400s and 7400s, and allowed us to reach signal-to-noise ratios of S/N1 per WFPC2 pixel for mag arcsec-2. This surface brightness limit is deep enough to trace an unevolved Milky Way-like disk to three scale lengths at the redshift limit of our combined survey. The full CFRS+LDSS HST imaging dataset is described in detail in Brinchmann et al. (1998). A total of 232 CFRS galaxies and 53 Autofib+LDSS galaxies have both a securely measured redshift in the range (with a redshift identification secure at the 85% level: Le Fèvre et al. 1995; Brinchmann et al. 1998, Table II), and a deep HST/WFPC2 image. Galaxies in the CFRS are drawn from a purely -band selected sample, as defined in Lilly et al. (1995) and Le Fèvre et al. (1995). Galaxies in the LDSS sample are a purely -selected sample, as defined in Colless et al. (1993) and Glazebrook et al. (1995). Galaxies near the edge of the WFPC2 field (those systems for which a full kpc area around them was not visible) were removed from the sample. The redshift and magnitude distributions of the HST samples are similar to the distributions of their parent CFRS and LDSS samples (as described by Brinchmann et al. 1998).
3 Image Analysis
3.1 Visual identification of mergers
In this section we seek to identify merger events through visual classification. In this procedure we attempt to distinguish broadly between probable “major” and “minor” merging events. A major merger, involving galaxies of comparable masses, should produce strong morphological signatures, such as double nuclei, wisps, tails, shells, asymmetric morphology, and possibly be associated with the triggering of a recent starburst (Mihos & Hernquist 1994a; Liu & Kennicutt 1995). Minor mergers, involving a massive galaxy and a small dwarf, are likely to be more frequent (M95; Baugh, Cole & Frenk 1996), and produce more benign morphological signatures which might be difficult to identify during or shortly after the merging event, although significant changes of the star formation rate can result from this type of event. It is emphasized that the visibility of merger-induced features may be relatively short lived, depending on the respective masses of the galaxies involved (M95), making the identification of even relatively recently completed mergers a challenging task.
We have defined the following visual classification scheme to
identify merger events:
(0) not a merger: no trace of merger,
although some minor asymmetry may be present
(1) suspicious:
there is a suspicion that some merging event might be occurring,
with some asymmetry and traces of wisps, tails, etc.
(2)
probable merger / upcoming merger: there is a nearby galaxy but
the isophotes are not overlapping at the
mag arcsec-2 isophote level.
(3) on-going merger: a merging
event is most probably or certainly occurring, as evidenced by
strong asymmetry, double nuclei, prominent wisps, tails, etc.
In the following analysis, classes 2 and 3 are summed to produce the list of visually identified mergers. The separation in classes 2 and 3 is used in Section 5.2, but we emphasize that the separation between classes 2 and 3 is sensitive to the depth of the limiting isophote chosen, as the primary and companion galaxy may well be “bridged” by luminous material at levels fainter than the observations are able to reveal.
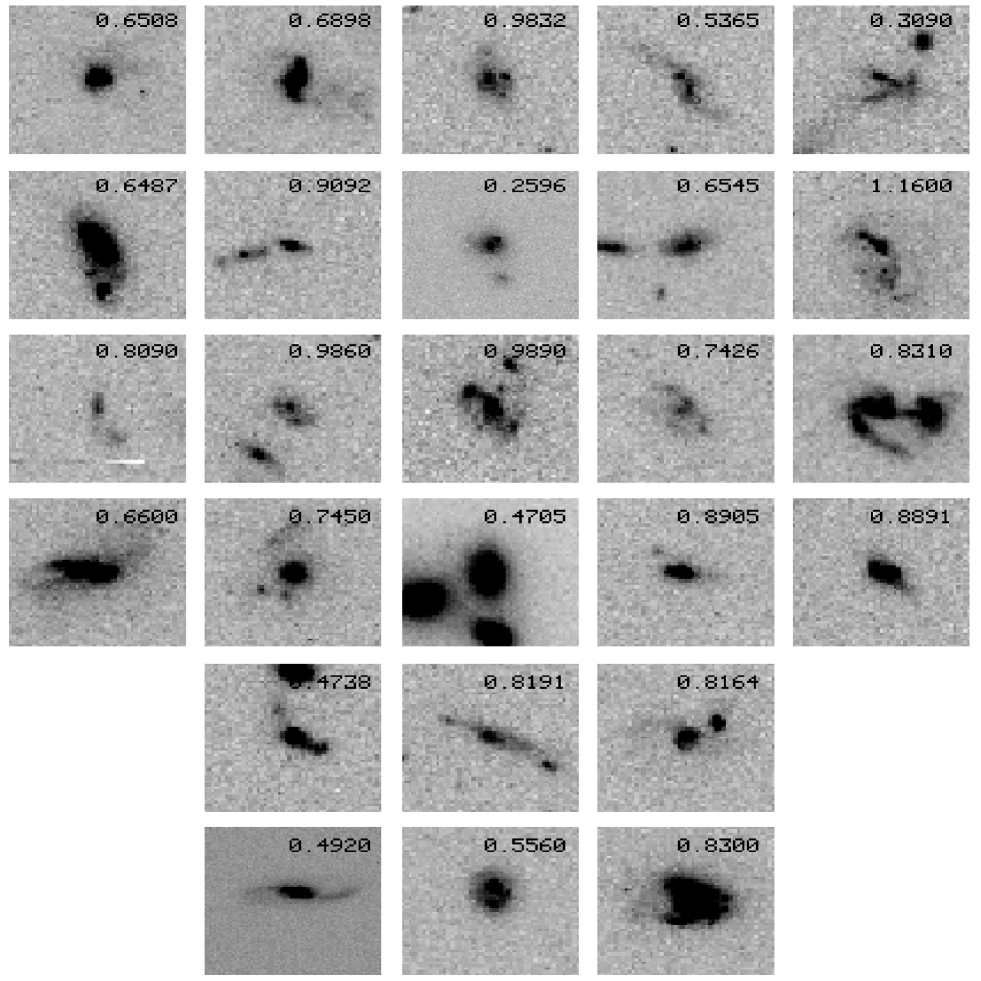
All galaxies in the sample have been visually examined by 3 of us (JB, OLF, SJL), and classified in the above scheme. When a classification was discrepant among the 3 observers, the median class has been taken as the final classification. A total of 261 galaxies have a secure redshift measurement; among these, 22 are classified in class 3, and 4 in class 2. This leads to an overall merger fraction for the whole sample of %. A total of 63 galaxies do not have a redshift, of which 3 are in class 2 and 4 are in class 3, giving a merger fraction for this sample of %. Galaxies without redshifts therefore have a merger fraction comparable to that for the whole sample, and no bias in the merger rate estimate is expected from restricting the analysis to galaxies with secure redshifts. The list of visually identified mergers is given in Table 1. Images of the mergers are presented in Fig. 1 and the histogram of the redshift distribution is shown in Fig. 2. The fraction of visually identified mergers vs. redshift is shown in Fig. 2: it is evident that most of the identified mergers are at the high redshift end of the sample.
3.2 Pair fraction
Another approach to identifying mergers is to count pairs of galaxies as observed in projection, and to use these pair counts to estimate the physical pair fraction in the sample (see e.g. Patton et al. 1997). Physical pairs of galaxies separated by small distances and with low relative speeds are bound and are destined to merge on relatively short timescales. We have performed a pair count analysis using both a visual approach (based on counts of galaxies with measured redshifts for which nearby galaxies form a pair as observed in projection), and using the machine-based automated approach described in Section 3.2.2. Because we usually have knowledge of the redshift for only one of the pair components, some of the pairs can be produced by foreground-background projection contamination. This effect needs to be corrected for in order to estimate physical pair counts, which can then be related to the merger rate. This section describes the manual and automated classification methods used to estimate the apparent pair fraction, leading to the computation of the physical pair fraction in the next Section.
| Num | Redshift | Rest | Merger | ||
|---|---|---|---|---|---|
| z | Ground | EW([O II]) | Class | ||
| 03.0523 | 0.6508 | 21.31 | 21.19 | 30.3 | 3 |
| 03.1540 | 0.6898 | 21.04 | 21.51 | 11.8 | 3 |
| 10.0761 | 0.9832 | 22.07 | 21.55 | 8.1 | 3 |
| 10.0765 | 0.5365 | 22.18 | 19.95 | 52.7 | 3 |
| 10.0802 | 0.3090 | 21.70 | 19.16 | 32.9 | 3 |
| 10.1183 | 0.6487 | 20.60 | 21.92 | 34.6 | 3 |
| 10.1220 | 0.9092 | 22.36 | 20.95 | 20.4 | 2 |
| 14.0377 | 0.2596 | 20.81 | 19.61 | 62.7 | 3 |
| 14.0485 | 0.6545 | 22.16 | 22.44 | 35.7 | 2 |
| 14.0547 | 1.1600 | 21.40 | 23.09 | 6.0 | 3 |
| 14.0665 | 0.8090 | 22.97 | 20.78 | 12.2 | 2 |
| 14.0743 | 0.9860 | 22.19 | 22.05 | 14.1 | 2 |
| 14.0846 | 0.9890 | 21.81 | 21.91 | 40.9 | 3 |
| 14.1126 | 0.7426 | 22.26 | 20.64 | 41.9 | 3 |
| 14.1129 | 0.8310 | 21.12 | 22.10 | 15.3 | 3 |
| 14.1139 | 0.6600 | 20.20 | 22.27 | 12.0 | 3 |
| 14.1415 | 0.7450 | 21.06 | 21.62 | 0. | 3 |
| 22.0497 | 0.4705 | 18.42 | 22.93 | 0. | 3 |
| 22.0576 | 0.8905 | 22.29 | 20.97 | 73.5 | 3 |
| 22.0599 | 0.8891 | 21.74 | 21.51 | 68.8 | 3 |
| 22.0919 | 0.4738 | 21.77 | 20.23 | 10.2 | 3 |
| 22.1313 | 0.8191 | 21.74 | 21.33 | 57.2 | 3 |
| 22.1453 | 0.8164 | 21.44 | 21.53 | 0. | 3 |
| 10.12073 | 0.4920 | 20.35 | 20.61 | 0. | 3 |
| 13.12106 | 0.5560 | 21.70 | 18.68 | 9.0 | 3 |
| 13.12545 | 0.8300 | 20.30 | 21.26 | 24.0 | 3 |
3.2.1 Visual identification of galaxy pairs
We have determined pair counts based on galaxies with at least one nearby companion galaxy within a kpc radius, and a magnitude difference mag between the main galaxy and the companion. Such systems are expected to merge within less than years (M95; Patton et al. 1997). The difference in magnitude is intended to identify unambigous pairs, and to produce pair counts less affected by the difficulties inherent in separating minor mergers of dwarf galaxies with bright galaxies from galaxies with large H II regions or asymmetric features.
These minor mergers can certainly contribute to the general evolution of the morphology and luminosity of galaxies, but the corresponding pair counts are subject to larger uncertainties than the bright pair counts, because of possible significant background contamination. The mag cut-off therefore leads to an underestimate of the true pair fraction.
The visual measurements were carried out as follows. For each galaxy in the CFRS-LDSS catalog with an HST/WFPC2 image, we measured the projected distances to putative companion galaxies, and their corresponding magnitude differences with respect to the primary galaxy. Objects sharing a common isophote with the primary galaxy were noted in an attempt to broadly distinguish between “upcoming” and “on-going” mergers (see Section 5.2). Galaxy pairs were flagged as “1” when the separation
between the primary galaxy and the companion was less than kpc, and the magnitude difference was less than 1.5 magnitude.

3.2.2 Automated identification of pairs: Lee classifier
In addition to the visual approach defined above, we have undertaken the measurement of a quantitative parameter indicative of merging. The degree of bimodality in the galaxy images is determined objectively from measurements of the Lee Ratio (Abraham et al. 1998), , for each of the galaxy images. Our definition of is a straightforward generalization of the maximum-likelihood statistic developed by Fitchett & Webster(1987) for use with sparsely sampled galaxy cluster data (see also Lee, 1979). Sky-subtracted 100x100 pixel “postage stamp” images were constructed for each galaxy in the sample, and the galaxian light isolated from the sky background at the 2 level. The galaxian light distribution at pixel in each of these images was then projected onto a line at angle , defining a profile , where is the distance along the axis of projection:
For each projection, a function was determined by subdividing the projection at a number of cuts:
where is the position of the cut, and [ and ] are the mean and standard deviations of the profile to the left [right] of the cut, and is the mean of the original profile, i.e.
The Lee Ratio is then defined as the ratio of the maximum to the minimum of the for all angles and all cuts:
was calibrated using images of synthetic “mergers” constructed by adding together distinct galaxy images with a range of relative brightnesses and displaced across a range of separations spanning the range observed in the HST image sample (Abraham et al. 1998). was computed in steps of 5 degrees. is most sensitive to cases where the magnitude difference between two galaxies is small, and where the isophotes between primary and companion galaxies are overlapping. The parameter is therefore sensitive only to major mergers. Values of are indicative of significant bimodality.
3.2.3 Comparison of manual and automated classifications
A comparison between manually and automatically classified () pairs of galaxy images was made. Of the 49 pairs identified by the manual approach, 37(80%) have a Lee ratio . The remaining 12 galaxies were examined in detail, and it was found that of these the manual classification had picked out 10 systems with well defined bimodal components, while 2 galaxies with low were wrongly classified as mergers during the manual classification. The majority of bimodal systems not flagged as such by were found to have been rejected because of the 2 isophote cut imposed on the data fed into the Lee classification program – at this level a few weakly bridged systems were split into individual objects which separately have low Lee ratios. Lowering the isophote limit to the level used for the manual classification in Section 3.2.1 recovered most of the same pairs identified in the manual classification. In addition, a total of 37 galaxy images (of 285) have but were not classified as major mergers through the visual classification scheme. Most of these were not classified as pairs either because the magnitude difference between the components of the pairs was , or because there was a companion galaxy, but outside of the kpc area, or because a bright unresolved object (presumably a star) was nearby. The manual and the classifications are therefore broadly consistent.
In Fig. 3, the parameter for all galaxies in the sample is presented, and the 49 galaxies manually classified as pairs are identified. This comparison leads to the final list of pairs reported in Table 2, and to the images shown in Fig. 4.

3.2.4 Comparison between visually identified mergers and galaxy pairs
Among galaxies visually classified as mergers, 21 galaxies are also classified as pairs, and 5 galaxies are not (galaxy numbers 10.1183, 14.377, 14.0547, 14.1415, 10.12073). These 5 galaxies exhibit signs of asymmetry, faint wisps, or tails – leading to the merger classification – but without double nuclei or close companions. The remaining systems all exhibit double nuclei or close companions, and warrant classification as pairs.
3.2.5 Physical pair fraction
The identification of pairs in our images is based on projected appearance. Since in essentially all cases only the redshift of the brightest galaxy is available from our ground-based surveys, we need to correct the number of observed pairs for the appearance of non-physical pairs originating in background/foreground contamination along the line of sight, before we can obtain an estimate of the true number of physical pairs. The background/foreground contamination correction was calculated using the counts published by Driver et al. (1995) and Abraham et al. (1996), integrated over the magnitude range and within a projected kpc radius area. At , the limiting magnitude of the HST images allows us to securely identify all galaxies brighter than . For each galaxy, this was then used with the K-correction, , of the primary galaxy to compute the apparent magnitude down to which the counts were to be performed, and the background/foreground contamination applied. It is noteworthy that the detailed form of the K-correction has only a minor effect on this calculation, since observed -band corresponds to rest -band at .
Our results are summarized in Table 3, which lists the numbers of galaxies, observed pairs, and expected line of sight contamination. The pair fraction reported in Table 3 has been computed as the fraction of pairs in the sample, corrected for the expected number of non-physical projected pairs. The statistics of our survey are such that the pair fraction can be measured with good precision for the highest two redshift bins, while at the numbers of pairs are smaller and the background/foreground contamination is higher because kpc projects to a larger projected angular area.
4 Evolution of the merger rate
Our data allow us to determine the first direct observational measurement of the merger fraction at redshifts . We can derive the merger fraction from both (complementary) approaches that we have followed. Within the current sample, both the fraction of mergers and the pair fraction rise by a factor of more than 2 between redshifts 0.5 and 0.9. Compared to local measurements of the merger fraction (Patton et al. 1997), the merger fraction at z0.9 is more than 9 times higher than in the local universe.
From the visual classification of mergers, we find that the merger fraction is %, %, %, at mean redshifts 0.37, 0.63 and 0.9 respectively. If we take the local merger value to be % (Patton et al. 1997), a least-squares fit of this data gives, for the evolution of the merger fraction parameterized as , and . Our redshift result is compatible with the merging fraction of at from Patton et al. (1997).
Our pair counts (corrected for background/foreground contamination) indicate that at redshifts and , % and % of the galaxy pairs are likely to be physical, respectively. However, as pointed out by Carlberg et al. (1994) and Patton et al. (1997), one needs to determine the fraction of these physical pairs which are likely to merge. Patton et al. (1997) suggest that, at the present epoch, 50% of the galaxy pairs with relative velocities less than 350 km s-1 are likely to merge. This is expected to change with redshift as . Applying this correction, we find that the merger fractions at and are % and %, respectively. Using all of the 4 CFRS–LDSS HST data points in Table 3 in combination with the lower redshift measurement of % at , and a local merging fraction of % (Patton et al. 1997), we find that the pair-count-estimated merger fraction evolves as , in excellent agreement with the merger fraction from the morphological criteria. The data points are represented in Fig. 6. To minimize the impact of the apparent magnitude selection on our sample, which selects predominantly low luminosity galaxies at low redshifts and high luminosity galaxies at high redshifts, we have repeated the above analysis, limiting our sample to galaxies with . We find that at redshifts and , % and % of the galaxy pairs are physical pairs likely to merge. Using our 4 data points and the data from Patton et al. (1997), we find that the best fit is and .
Therefore, using both visually identified mergers and pair counts, we conclude that the observed merger rate evolves with redshifts as with m ranging from 3.2 to 3.4, over the redshift range 0–1.
5 Luminosity enhancement from mergers
Mergers can change the luminosity function of galaxies through a combination of both number density and luminosity evolution. In addition to the obvious effects of density evolution, mergers may also brighten galaxies to the point where systems that would otherwise drop below the magnitude limits of a survey become included in the sample.
Two effects can contribute to the luminosity enhancement of a galaxy in a merging pair. In a dissipationless merger,the luminosities of the two galaxies add with a final luminosity being (at most) twice that of the most luminous pre-merging galaxy. However, merging may also trigger additional stellar formation, particularly during later stages of the merging process (Hernquist & Mihos 1995), increasing the total luminosity by adding to the overall stellar content of the combined system. As star-formation activity should have a longer timescale than the timescale during which the morphological evidence for a merger remains (M95), a global star formation increase might be expected in a galaxy population subjected to a higher rate of merging. These two effects are quantified in the following sections.
5.1 Luminosity brightening
The brightening of the galaxy population induced by merging can be one of the contributors to the observed evolution of the luminosity function (Lilly et al. 1995; Ellis et al. 1996). To estimate the brightening of the population from merging, we looked at the brightest pairs selected from our mag criterion. The minimum luminosity enhancement induced by a close pair, if destined to merge, has simply been taken as the co-addition of the luminosities of the galaxies in a pair, assuming no extra star formation triggered by the event. We have computed the magnitudes of each galaxy in a pair from the HST images (excluding close companions) and a conservative estimate of the final magnitude of the merged pair was obtained by simply adding the luminosities from the two galaxies, the resulting magnitude being equal to the ground based magnitude (Brinchmann et al. 1998). The luminosity enhancement estimated by this simple procedure is shown in column 8 of Table 2 for each pair, and is on average 0.5 mag for the sample of galaxies classified as pairs. There are 37 pairs above , of which 19 are expected to be the result of projection effects. This indicates that 18/151 galaxies, or % of the galaxies at will experience a brightening of at least 0.5 magnitude within the next billion years or so due to merging. As the merger timescales are subject to considerable uncertainties, we can only speculate that this fraction of galaxies is the minimum fraction of galaxies in the sample which would experience a brightening over a time span of Gyr. We note that some of these galaxies will be brought artificially into a magnitude limited sample produced from ground based observations, because the total magnitude of the galaxy is coming from closely paired galaxies as the result of projection effects (Table 3), with each of the individual galaxies in the pair being fainter than the magnitude limit of the sample, as described in Section 6.
5.2 Star formation rate increase
To estimate the star formation enhancement produced during the merger process, we have looked at the [O II]3727 equivalent width for three sub-samples: on-going mergers, upcoming mergers, and galaxies with no companions, as classified during the analysis detailed in Section 3.2.1. On-going major mergers, have been defined as systems with evidence for double nuclei within kpc, each galaxy having comparable luminosity (1.5 mag), sometimes associated with disrupted morphologies. Up-coming major mergers are defined as systems with a galaxy with mag at a distance kpc from a galaxy in the redshift sample, but where the isophotes of the two galaxies are not overlapping at the depth of our images. Of course a single galaxy can have a total number of upcoming or ongoing mergers larger than one. Differences in the [O II] equivalent width between the on-going and upcoming merger classes could then indicate the effect of merging on the star formation rate.
| Num | z | A | Rest | d | ||||
|---|---|---|---|---|---|---|---|---|
| Ground | EW([O II]) | ”/kpc | ||||||
| (1) | (2) | (3) | (4) | (5) | (6) | (7) | (8) | (9) |
| 3.0332 | 0.1880 | 21.88 | 17.63 | 1.2 | 0.323 | 6.7 | 1.39 | 0.55/2.2 |
| 3.0466 | 0.5304 | 22.47 | 19.60 | 1.74 | 0.208 | 20.3 | 0.65 | 1.95/14.2 |
| 3.0485 | 0.6056 | 22.22 | 20.24 | 2.44 | 9999 | 66.6 | 0.80 | 0.40/3.1 |
| 3.0488 | 0.6069 | 21.58 | 20.85 | 1.64 | 9999 | 67.8 | 0.50 | 0.56/4.3 |
| 3.0523 | 0.6508 | 21.31 | 21.19 | 1.85 | 0.362 | 30.3 | 1.38 | 0.35/2.7 |
| 3.0595 | 0.6061 | 21.46 | 20.78 | 1.96 | 9999 | 17.4 | 1.40 | 0.15/1.1 |
| 3.1056 | 0.9440 | 22.33 | 21.10 | 1.17 | 0.23 | 46.3 | 1.20 | 2.3/19.5 |
| 3.1319 | 0.6200 | 21.51 | 20.67 | 1.76 | 0.071 | 25,9 | 1.50 | 0.50/3.9 |
| 3.1540 | 0.6898 | 21.04 | 21.51 | 1.89 | 0.133 | 11.8 | 1.45 | 1.81/14.4 |
| 10.0761 | 0.9832 | 22.07 | 21.55 | 1.36 | 0.005 | 8.07 | 1.40 | 0.44/3.7 |
| 10.0765 | 0.5365 | 22.18 | 19.95 | 1.84 | 0.128 | 52.7 | 0.23 | 0.61/4.5 |
| 10.0794 | 0.5800 | 21.55 | 20.53 | 15.73 | 0.212 | 0. | 0.24 | 1.50/11.3 |
| 10.0802 | 0.3090 | 21.70 | 19.16 | 1.43 | 0.172 | 32.9 | 1.00 | 1.8/10.1 |
| 10.0805 | 0.1475 | 21.45 | 17.51 | 1.15 | 9999 | 0. | -0.08 | 4.4/14.8 |
| 10.1168 | 1.1592 | 22.22 | 21.99 | 9999 | 9999 | 103.3 | 0.10 | 0.77/6.6 |
| 10.1220 | 0.9092 | 22.36 | 20.95 | 4.40 | 0.09 | 20.43 | 0.46 | 1.43/12.0 |
| 10.1643 | 0.2345 | 20.77 | 18.93 | 4.38 | 0.177 | 0. | -0.81 | 3.84/18.1 |
| 10.1644 | 0.0767 | 19.56 | 17.24 | 3.48 | 0.220 | 0.05 | 0.81 | 3.84/7.6 |
| 14.0485 | 0.6540 | 22.16 | 20.44 | 5.42 | 0.089 | 35.7 | 0.35 | 2.3/18.0 |
| 14.0600 | 1.0385 | 21.53 | 22.16 | 9999 | 9999 | 26.5 | 1.26 | 0.21/1.8 |
| 14.0665 | 0.8090 | 22.41 | 20.65 | 3.78 | 0.233 | -9 | 0.36 | 1.12/9.2 |
| 14.0725 | 0.5820 | 22.32 | 19.76 | 1.64 | 0.213 | 31.0 | 1.50 | 0.55/4.1 |
| 14.0743 | 0.9860 | 21.65 | 21.93 | 1.54 | 0.131 | -9 | -0.14 | 1.83/15.6 |
| 14.0749 | 0.8180 | 22.45 | 20.53 | 1.74 | 0.207 | -9 | 0.33 | 0.39/3.2 |
| 14.0846 | 0.9820 | 21.81 | 21.79 | 1.72 | 0.276 | 40.9 | 1.49 | 0.85/7.2 |
| 14.0854 | 0.9920 | 21.50 | 22.21 | 4.65 | 0.06 | 0. | 1.31 | 2.18/18.1 |
| 14.0939 | 0.9180 | 21.20 | 22.15 | 2.30 | 0.219 | -9 | 0.49 | 1.35/11.4 |
| 14.1079 | 0.9011 | 21.95 | 21.35 | 1.17 | 0.106 | 25.2 | 0.68 | 0.40/3.4 |
| 14.1126 | 0.7426 | 22.26 | 20.64 | 1.26 | 0.109 | 41.9 | 0.95 | 0.20/1.6 |
| 14.1129 | 0.8310 | 21.05 | 22.01 | 2.52 | 0.310 | -9 | 0.26 | 0.81/6.7 |
| 14.1139 | 0.6600 | 20.20 | 22.27 | 2.68 | 0.279 | 12.0 | 0.62 | 0.55/4.3 |
| 14.1146 | 0.7437 | 21.72 | 21.06 | 1.70 | 0.210 | 39.0 | 1.32 | 0.51/4.1 |
| 14.1193 | 0.0780 | 21.48 | 16.66 | 1.79 | 0.279 | 0. | 0.50 | 1.20/2.4 |
| 14.1264 | 0.7030 | 22.90 | 19.96 | 9999 | 9999 | -9 | 0.02 | 2.02/16.1 |
| 14.1501 | 0.9890 | 21.74 | 21.85 | 2.51 | 0.324 | -9 | 0.03 | 0.65/5.5 |
| 22.0497 | 0.4700 | 18.42 | 22.93 | 1.86 | 9999 | 0. | -0.25 | 2.16/14.9 |
| 22.0576 | 0.8910 | 22.29 | 20.97 | 1.21 | 0.302 | 73.5 | 0.50 | 0.50/4.2 |
| 22.0585 | 0.2940 | 20.59 | 19.46 | 7.65 | 0.053 | 0. | 0.45 | 2.41/13.1 |
| 22.0599 | 0.8890 | 21.74 | 21.51 | 1.52 | 0.439 | 68.8 | 0.10 | 0.10/0.8 |
| 22.0919 | 0.4740 | 21.77 | 20.23 | 12.08 | 0.268 | 10.2 | 0.07 | 2.25/15.7 |
| 22.0953 | 0.9770 | 22.27 | 21.22 | 1.67 | 0.063 | 47.5 | 1.30 | 0.70/6.0 |
| 22.1313 | 0.8190 | 21.74 | 21.33 | 1.92 | 0.202 | 57.2 | 1.47 | 1.97/16.4 |
| 22.1453 | 0.8160 | 21.44 | 21.53 | 2.68 | 0.076 | 0. | 0.34 | 1.08/9.0 |
| 10.12525 | 0.4350 | 20.00 | 21.35 | 6.40 | 9999 | 2.1 | 0.67 | 2.55/17.1 |
| 13.12106 | 0.5560 | 21.70 | 18.68 | 1.27 | 0.132 | 9.0 | 1.47 | 0.60/4.4 |
| 13.12111 | 0.0890 | 22.60 | 14.40 | 2.60 | 0.260 | 37.7 | 1.10 | 4.4/9.8 |
| 13.12540 | 0.4520 | 22.60 | 17.61 | 1.81 | 9999 | 0 | 0.75 | 0.50/3.4 |
| 13.12545 | 0.8300 | 20.30 | 21.26 | 1.69 | 0.396 | 24.0 | 0.01 | 0.60/5.0 |
| 13.12549 | 0.4930 | 21.10 | 18.88 | 1.25 | 0.052 | 8.7 | 0.79 | 2.80/19.8 |
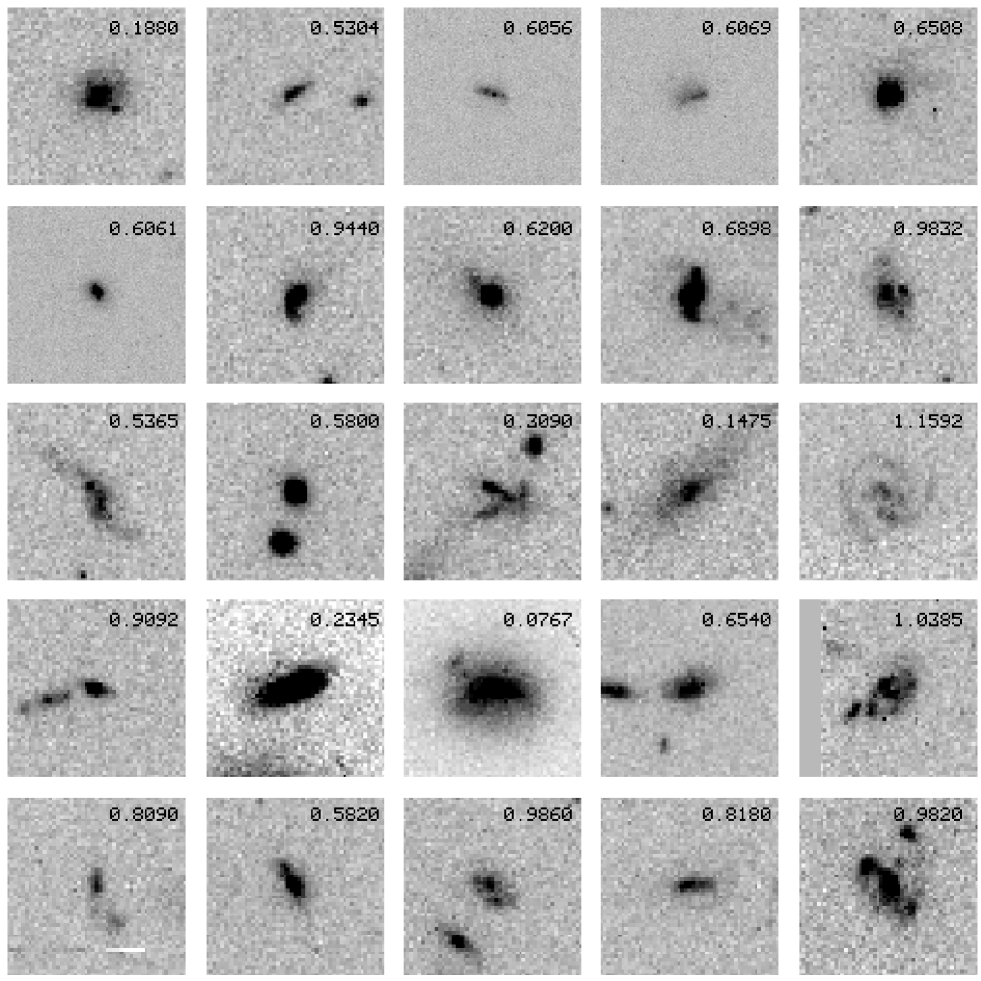
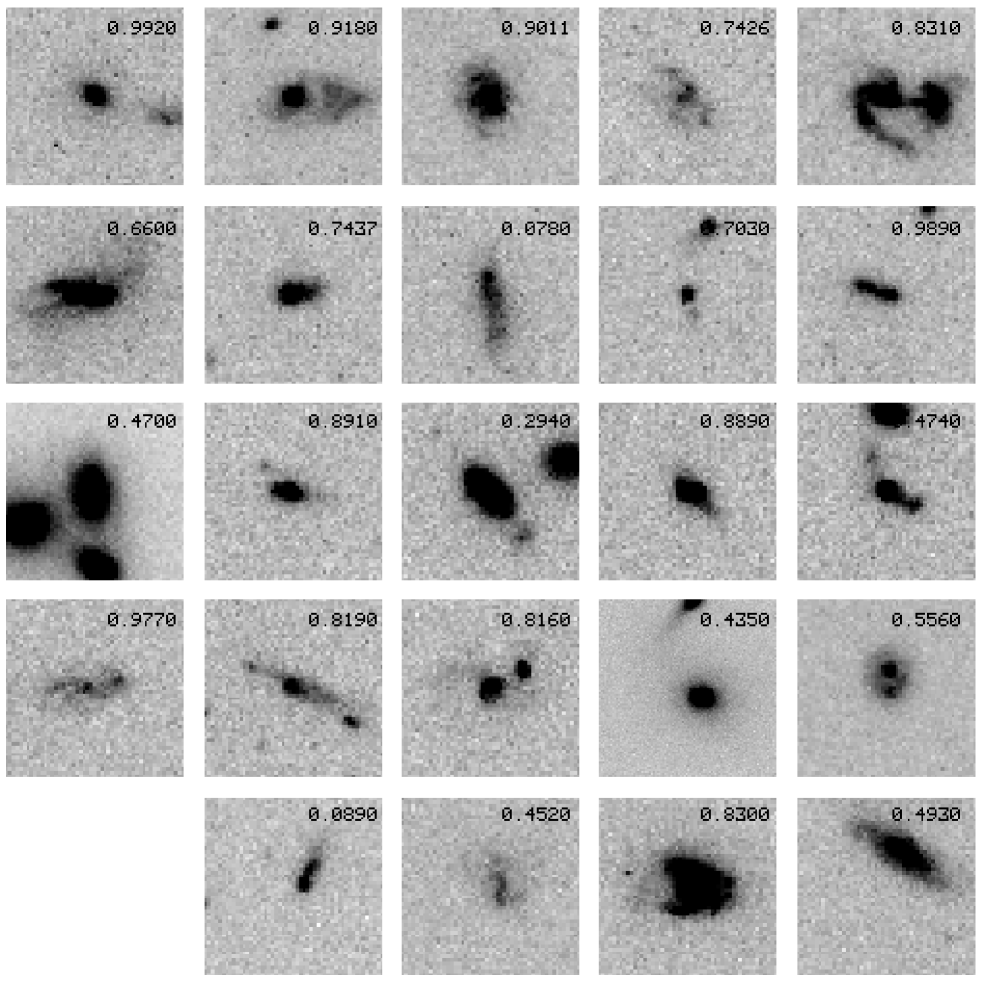
Galaxies classified as pairs. Each individual image is arcsec2, the measured redshift is indicated on the upper right corner of each image.
| Sample | z | Pair | Pair Fraction | |||
| Fraction | Corr. | |||||
| All CFRS+LDSS | 0–0.2 | 40 | 6 | 22 | 0 | 0 |
| All CFRS+LDSS | 0.2–0.5 | 98 | 11 | 19 | 0 | 0 |
| All CFRS+LDSS | 0.5–0.75 | 89 | 21 | 12.2 | 9.9 | 8.1 |
| All CFRS+LDSS | 0.75–1.3 | 62 | 21 | 8.4 | 20.3 | 19.4 |
| CFRS+LDSS | 0–0.2 | 8 | 0 | 7.1 | 0 | 0 |
| CFRS+LDSS | 0.2–0.5 | 33 | 2 | 4.3 | 0 | 0 |
| CFRS+LDSS | 0.5–0.75 | 57 | 12 | 6.6 | 9.5 | 7.8 |
| CFRS+LDSS | 0.75–1.3 | 59 | 21 | 8.0 | 22.0 | 21.0 |
| z | Up-coming | On-going | Other | |||
| mergers | mergers | galaxies | ||||
| 8.3 | 11 | 2.7 | 5 | 12.6 | 123 | |
| 0.5–0.75 | 15.0 | 7 | 37.7 | 15 | 18.9 | 67 |
| 24.8 | 5 | 46.4 | 9 | 19.7 | 48 |

Our results are summarized in Table 4, which shows that the [O II] equivalent width of up-coming mergers is not significantly different from the equivalent width of non-merging galaxies, while the equivalent width of on-going mergers at is Å, 2 times higher than for non-merger galaxies (Å). On-going mergers may thus have a star formation rate increased by a factor 2, with a corresponding luminosity increase, as a result of the merging process. It is noteworthy that a significant fraction of the star formation may be obscured by dust, as dust is often seen in merging systems, and therefore, that the star formation rate increase measured from [O II] should be taken as a lower limit (Hammer et al. 1998).
6 Bias in ground based selected samples from merger induced luminosity enhancement
In this section we examine the effect of having selected our galaxy sample from a redshift survey based on ground-based imaging. Some of the galaxies in the redshift survey are now identified from HST imaging as pairs of nearby galaxies unresolved in ground-based data. Seeing effects clearly lead ground-based surveys to include some galaxies in magnitude limited samples only because the added luminosity from a close companion is sufficient to produce a total blended luminosity above a limiting magnitude threshold. From the analysis of the magnitude difference with the closest companion as described in Section 5.1, we find that in the galaxies of the CFRS sample imaged with HST, 11 (of 232) galaxies have been included in the ground-based redshift survey because of this effect. This is most significant for , as 6 (of 73) galaxies above this redshift are in the complete HST-CFRS sample because of this effect, which enters at the % level. This bias also demonstrates the difficulties inherent in comparing deep galaxy counts obtained from ground-based and space-based observations.
Taking this effect into account would lower the physical pair fraction, corrected for background/foreground contamination, from 9.9% to 8.1% at and from 20.3% to 14.5% at . This would lower the parameter describing the physical pair rate change with redshift to .
7 Discussion and Conclusion
The visual classification of mergers, and the pair count analysis performed using manual classifications and using the Lee classifier, paint a consistent picture of the effects of mergers on high redshift galaxies. Our analysis shows that major mergers of galaxies () are playing an increasingly important role at higher redshifts, both in terms of number evolution and in inducing a significant luminosity enhancement. From the visual classification of mergers, we find that the merger fraction evolves as , with , in excellent agreement with the merger fraction derived from the pair counts, for which .
As shown explicitly in Section 6, ground-based magnitude-limited imaging samples can be biased by the effects of seeing, as close pairs of galaxies are counted singly. Around % of high redshift galaxies that are formally below the selection limit would be included in a ground based mag sample due to this effect. If our magnitude limited redshift survey had been defined from HST imaging data rather than from imaging data limited by ground based seeing, the pair fraction at would be lowered from to . After correction for this bias, we conclude that the merger fraction evolution exponent can best be parameterized as .
Transforming the observed merger fraction into a merger rate requires knowledge of the average timescale over which a merger is completed (i.e. over which morphological traces of the merger are gone at the 1 kpc resolution at which we are observing the present sample). Although there are considerable uncertainties in estimating this timescale, an upper limit of 400 Myr to 1 Gyr seems reasonable from both data and simulations (e.g. Patton et al. 1997; Mihos & Hernquist 1994b). Our results indicate that between redshift 0 and 0.9, the merger probability is , where is the merger timescale, and between and . Using a (conservative) range of merger timescales from 400 Myr to 1 Gyr, these relations suggest a galaxy will undergo on average 0.8 to 1.8 merger events from to , with 0.5 to 1.2 merger events occurring in a 2 Gyr time span at .
Semi-analytical models of galaxy formation in hierarchical clustering theories make strong predictions regarding the high-redshift merger rate. The model of Baugh et al. (1996) predicts that more than 50% of the elliptical galaxies, and 15% of the spiral galaxies suffered a major merger event in the redshift interval , while by , these numbers increase to more than 90% and 55% for ellipticals and spirals respectively, indicating the lower and upper limits for the whole population of galaxies (Baugh et al. 1996). These values appear broadly consistent with the numbers derived above from our data.
As the galaxies merge, two galaxies will be replaced by one which will be on average 0.5 magnitudes brighter from the simple co-addition of the initial luminosities, and an additional temporary star formation rate increase of a factor of 2, triggered by the merger event. With the increase in the number of mergers at high redshifts, merger events will contribute significantly to the evolution of the luminosity function by making L∗ brighter, and the number density smaller, with changing redshift. The analysis we have conducted has mainly been targeted at the most obvious merger events. We note that the number evolution and luminosity evolution that we have derived probably minimizes the full effect of mergers as the image resolution and depth of our HST data do not allow us to take into account mergers of smaller galaxies with bright galaxies in our sample (i.e. systems with mag).
Our results demonstrate the importance of mergers in the evolution of the luminosity function and of the luminosity density of the universe out to . The derivation of the merger fraction and of the merger rate at still higher redshifts is of great interest in order to determine the contribution of mergers to the putative peak or flattening in the UV luminosity density of the universe inferred to lie at a redshift between 1 and 2 (Madau et al. 1996).
References
- [1] Abraham R.G., Tanvir N.R., Santiago B.X., Ellis R.S., Glazebrook K., van den Bergh S., 1996, MNRAS, 279, 47
- [2] Abraham R.G., 1998, Invited review given at IAU symposium 186 “Galaxy Interactions at Low and High Redshifts” (Kyoto), in press (astro-ph/9802033).
- [3] Baugh C.M., Cole S., Frenk C.S., 1996, MNRAS, 283, 1361
- [4] Baugh C.M., Cole S., Frenk C.S., Lacey C.G., 1998, ApJ, 498, 504
- [5] Broadhurst T.J., Ellis R.S., Glazebrook K., 1992, Nature, 355, 55
- [6] Brinchmann J., Abraham R., Schade D., Tresse L., Ellis R.S., Lilly S.J., Le Fèvre O., Glazebrook K., Hammer F., Colless M., Crampton D., Broadhurst T.J., 1998, ApJ, 499, 112
- [7] Carlberg R.G., Pritchet C.J., Infante L., 1994, ApJ, 435, 540
- [8] Colless M., Ellis R.S., Broadhurst T.J., Taylor K., Peterson B.A., 1993, MNRAS, 261, 19
- [9] Driver S.P., Windhorst R.A., Ostander E.J., Keel W.C., Griffiths R.E., Ratnatunga K.U., 1995, ApJ, 449, L23
- [10] Ellis R.S., Colless M., Broadhurst T.J., Heyl J.S., Glazebrook K., 1996, MNRAS, 280, 235
- [11] Fitchett M., Webster R., 1987, ApJ, 317, 653
- [12] Fomalont E.B., Windhorst R.A., Kristian J.A., Kellerman K.I., 1991, AJ, 102, 1258
- [13] Glazebrook K., Ellis R.S., Colless M., Broadhurst T.J., Allington-Smith J., Tanvir N., 1995, MNRAS, 275, L19
- [14] Griffiths R.E., et al., 1994, ApJ, 435, L19
- [15] Groth E.J., Kristian J.A., Lynds R., O’Neil Earl J., Balsano R., Rhodes J., Idt W., 1994, BAAS, 185, 5309
- [16] Hammer F., Flores H., Lilly S. J., Crampton D., Le Fèvre O., Rola C., Mallen-Ornelas G., Schade D., Tresse L., 1997, ApJ, 481, 49
- [17] Hernquist L., Mihos J.C., 1995, ApJ, 448, 41
- [18] Kauffmann G., White S.D.M., Guiderdoni B., 1993, MNRAS, 264, 201
- [19] Kauffmann G., 1996, MNRAS, 281, 487
- [20] Kennicutt R.C., 1996, in “Galaxies: interactions and induced star formation”, Saas-Fee Advanced Course 26, Friedli, Martinod, Pfenniger, Eds., Springer.
- [21] Lee K.L., 1979, J. Am. Statistical Assoc., Vol.74, no367, p.708
- [22] Le Fèvre O., Crampton D., Hammer F., Tresse L., 1995, ApJ, 455, 60
- [23] Lilly S.J., Le Fèvre O., Crampton D., Hammer F., Tresse L., 1995, ApJ, 455, 50
- [24] Lilly S.J., Schade D., Ellis R.S., Le Fevre O., Brinchmann J., Abraham R., Tresse L., Hammer F., Crampton D., Colless M., Glazebrook K., Mallen-Ornelas G., Broadhurst T.J., 1998, ApJ, 500, 75
- [25] Liu C.T., Kennicutt R.C. Jr., 1995, ApJ, 450, 547
- [26] Madau P., Ferguson H.C., Dickinson M.E., Giavalisco M., Steidel C.C., Fruchter A., 1996, MNRAS, 283, 1388
- [27] Mihos J.C., 1995, ApJ, 438, L75 (M95)
- [28] Mihos J.C., Hernquist L., 1994a, ApJ, 425, L13
- [29] Mihos J.C., Hernquist L., 1994b, ApJ, 431, L9
- [30] Neuschaefer L.W., Im M., Ratnatunga K.U., Griffiths R.E., Casertano S., 1997, ApJ, 480, 59
- [31] Patton D.R., Pritchet C.J., Yee H.K.C., Ellingson E., Carlberg R.G., 1997, ApJ, 475, 29
- [32] Rocca-Volmerange B., Guiderdoni B., 1990, MNRAS, 247, 166
- [33] Schade D.J., Lilly S.J., Crampton D., Hammer F., Le Fèvre O., Tresse L., 1995, ApJ, 451, L1
- [34] Schade D., Lilly S.J., Crampton D., Ellis R.S., Le Fèvre O., Hammer F., Brinchmann J., Abraham R., Colless M., Glazebrook K., Tresse L., Broadhurst T., 1999, ApJ, in press (astro-ph/9906171)
- [35] Schweizer F., 1996, in “Galaxies: interactions and induced star formation”, Saas-Fee Advanced Course 26, Friedli, Martinod, Pfenniger, Eds., Springer.
- [36] Woods D., Fahlman G.G., Richer H.B., 1995, ApJ, 454, 32
- [37] Yee H.K.C, Ellingson E., 1995, ApJ, 445, 37
- [38] Zepf S.E., Koo D.C., 1989, ApJ, 337, 34