email: paj@astro.livjm.ac.uk 22institutetext: Department of Mathematical Physics & Astronomy, Universiteit Gent, Krijgslaan 281 (S9), B-9000 Gent, Belgium
email: Marc.Seigar@rug.ac.be
The nature of near-infrared emission from spiral galaxies
Abstract
We present K-band spectroscopy for several regions of three nearby spiral galaxies, NGC 613, NGC 628 and NGC 7741. Analysis of the depth of the 2.293m CO absorption feature in these spectra reveals that some regions have deep absorptions, indicative of recent star formation, while others have anomalously shallow absorptions. We interpret the latter as evidence for a significant but localised contribution to the 2.3 m light from hot dust with an effective temperature of 1000 K, which could have a significant effect on the K-band morphologies of star-forming galaxies.
Key Words.:
galaxies: spiral - galaxies: stellar content1 Introduction
The stars which dominate the stellar mass in galaxies are effectively invisible. Most of the optical light in the solar neighbourhood comes from A dwarfs and K & M giants, whereas the local stellar mass is dominated by G, K and (particularly) M dwarfs, which contribute a negligible fraction of the visible light (Kroupa, Tout & Gilmore krou (1990), Binney & Merrifield binn (1998)). In actively star-forming systems the disparity between the luminous and mass-bearing stellar components is even greater. For this reason, and because of the diminished effects of dust obscuration, near-infrared (near-IR) imaging has become a key observational technique for determining the morphologies and stellar contents of galaxies. For example, near-IR imaging has been widely used to determine the underlying structure of spiral arms in disk galaxies (e.g. Rix & Rieke rix93 (1993), Block et al. bloc (1994), Rix & Zaritsky rix95 (1995), Seigar & James 1998b ), since arms are both extremely dusty and associated with star formation. In this paper we will look in more detail at the assumption that near-IR light is a good tracer of the stellar mass in galaxies.
The hot OB stars which can dominate the blue light of a star-forming galaxy have relatively little impact on the K-band (2.2 m) emission (Persson et al. pers (1983)). However, by 107 years after the onset of a burst of star formation, the most massive stars will have evolved to the red supergiant phase and will be contributing significantly to the near-IR light output (Persson et al. pers (1983)). In addition, hot (600–1000K) dust associated with OB associations gives rise to mid-infrared emission with a short-wavelength ‘tail’ which extends into the K window (Doyon, Joseph & Wright doyo (1994)). For extreme ‘starbursting’ objects, the supergiant plus dust emission can exceed that of the old stellar population in the K-band (e.g. Ridgway, Wynn-Williams & Becklin ridg (1994), Doyon et al. doyo (1994), Puxley, Doyon & Ward puxl (1997)). For normal disk galaxies, the effects will be more modest, but still significant.
Rhoads (rhoa (1998)) has addressed the question of the supergiant contribution to K-band disk light by mapping the depth of the 2.3 m CO photospheric absorption over the disks of three nearby spiral galaxies. This feature is stronger in supergiant stars than in the old stellar population (Frogel et al. frog (1978), Doyon et al. doyo (1994)), and extends over a sufficiently broad wavelength range to be easily quantified as a colour change in narrow band filters. Using this technique, Rhoads (rhoa (1998)) determines the supergiant contribution to the three galaxies (NGC 278, NGC 2649 and NGC 5713) to be only 3 of the overall near-IR flux, but rising locally in regions of strong star formation to as much as 33. This is an important result, if generally true, since this is a significant fraction of the arm-interarm contrast in near-IR images of normal spirals (Rix & Zaritsky rix95 (1995), Seigar & James 1998b ), making it very uncertain whether near-IR features reflect changes in the overall stellar mass density, or in the location of the young supergiant population. Given an age of 1–2107 years, and assuming a formation velocity dispersion of 10 kms-1 for Population I stars, the supergiants will have typically moved only 0.1–0.2 kpc from their birthplaces in the disk, whereas the late K or early M giants which dominate the red light from the older stellar population (Frogel et al. frog (1978), James & Mobasher jame (1999)) will be well mixed with other stellar types. Thus it is important to quantify the relative contributions from giant and supergiant stars.
Doyon et al. (doyo (1994)) point out that extreme caution must be used in interpreting filter CO measurements of the type used by Rhoads (rhoa (1998)) in regions of strong star formation, due to hot dust, non-thermal emission and extinction, which can significantly affect the shape of the underlying galaxy continuum. More reliable measurements can be obtained using long slit spectroscopy, with the wavelength range covering both the CO absorption and the continuum emission at shorter wavelengths, which enables the continuum slope to be determined explicitly. This is the strategy we have adopted for the present paper. We have obtained low-resolution, long-slit spectroscopy covering the full K-band for bulge and disk locations in NGC 613 and NGC 628, and for the bar of NGC 7741. We present spectroscopic CO indices for all these regions, and use them to determine the fraction of light contributed by supergiant stars. We also compare the spectroscopic properties of bulges with those of inner disk regions, and with elliptical galaxies.
It should be noted that Oliva et al. oliv (1995) conclude that CO absorption strength is not a clear indicator of recent star formation in stellar populations. They find that an old population of high-metallicity giants can have the same CO index as a starburst dominated by low metallicity supergiants. However, their data (see Table 2 of Oliva et al. oliv (1995)) do show significantly deeper CO absorptions in both the centres of HII galaxies and young (6–17 Myr) LMC clusters than in 4 comparison ellipticals or the bulges of 3 spiral galaxies. Thus, whilst there is clearly scope for ambiguity of interpretation, and the possibility of metallicity effects must be considered when interpreting results, empirically it appears that CO strength does contain information on star formation history.
The organisation of the present paper is as follows. Section 2 contains a description of the galaxies observed, and of the spectroscopic observations obtained. The data reduction procedures are described in section 3, and section 4 contains the interpretation of the observed spectral indices in terms of the fraction of light from old and young stars, and from hot dust, in the different galaxy regions. Section 5 summarises the conclusions reached, and contains suggestions for future work to be undertaken in this area.
2 Observations
2.1 Instrumental set-up
All observations presented here were taken on four half-nights, 1997 August 3,5,6 and 7. The instrument used was the facility near-IR spectrometer CGS4 on the United Kingdom Infrared Telescope, UKIRT. This was configured with the short, 150 mm focal length camera, giving 123 pixels, and the 75 line/mm grating. The grating angle was set to give a total spectral range of 1.97–2.63m (larger than the atmospheric K window), and the dispersion was 0.00258m/pixel. We used the 2–pixel wide slit, oriented N–S for all observations, and moved the array by one pixel between sub-integrations to give automatic bad pixel replacement, and Nyquist sampling over the resolution permitted by the slit. The slit is 90′′ long. For NGC 7741 this was large enough for us to keep the galaxy bar on the slit in both beamswitch positions, but the larger sizes of NGC 613 and NGC 628 required the observation of completely offset positions for sky monitoring. This was done by alternating one-minute integrations at the main and sky positions.
At regular intervals, A-type stars were observed to permit variations in atmospheric transparency to be ratioed out of the galaxy spectra. A-stars were chosen as they are much too hot to have molecules in their photospheres, and thus they have no CO absorptions (and indeed no other strong features around the wavelength range of interest here). Care was taken to observe stars at the same airmass as the corresponding galaxy.
2.2 Observed galaxies
NGC 613 is a barred spiral, classified as SBbc in the Third Reference Catalogue of Bright Galaxies (de Vaucouleurs et al. deva (1991); henceforth RC3). It has a major axis diameter of 55, a total blue magnitude of 10.73, a recession velocity of 1475 kms-1, and a distance of 17.9 Mpc (Jungwiert, Combes & Axon jung (1996)), assuming H75 km s-1Mpc-1 (throughout the present paper) and correcting for a Virgo infall model. Thus 1′′ corresponds to 86 pc at NGC 613. It shows clear sign of an active galactic nucleus, and Véron-Cetty & Véron (vero (1986)) classified it as a ‘Composite’ galaxy, with central spectral features showing both Seyfert activity and vigorous star formation.
NGC 628 (M74) is classified as an Sc (RC3), and has a major axis diameter of 105 and a total blue magnitude of 9.95. Sharina, Karachentsev & Tikhonov (shar (1996)) calculate a distance of 7.3 Mpc for NGC 628, such that 1′′ corresponds to 35 pc. It has a recession velocity of 657 kms-1. There is no evidence of any nuclear activity in NGC 628 (AGN or vigorous star formation), and Wakker & Adler (wakk (1995)) note that the density of molecular material has a local minimum around the nuclear region. They find evidence for a ring of enhanced CO emission with a diameter of 45′′, centred approximately on the nucleus.
Finally, NGC 7741 is a strongly barred spiral, classified as SBcd by RC3. It has a recession velocity of 751 kms-1, a diameter of 44 and a total blue magnitude of 11.84. Tully (tull (1988)) gives its distance as 12.3 Mpc, such that 1′′ projects to 60 pc.
3 Data reduction
All data reduction was performed using the FIGARO and KAPPA packages provided by the Starlink project. Bias subtraction, flat fielding, bad pixel removal and sky subtraction were done automatically at the telescope. Some sky line residuals remained, and these were removed by fitting across regions of sky at the ends of the slit. One-dimensional spectra were then extracted by adding rows of pixels clearly containing galaxy signal. Simple addition of these rows was found to be more reliable than using the FIGARO ‘optimal extraction’ procedure. The A-star spectra were extracted in the same way, and were then divided into each of the galaxy spectra to correct for spectral variation in the atmospheric transmission. No attempt was made to flux calibrate any of the spectra.
The next stage was to correct for variations in the level and slope of the continuum in the galaxy spectra. This was done using a routine written by Dr Clive Davenhall under the Starlink QUICK facility. The routine fits a power-law function to continuum regions of the spectrum, with the only free parameters being the index of the power law and a multiplicative normalisation constant (see Doyon et al. 1994 for a physical justification of this choice of function). Regions affected by strong spectral features (principally Brackett 2.166m, and of course the CO absorption) are masked and not included in the fit. The routine produces a pure power-law ‘spectrum’ over the full wavelength range of the input spectrum. The latter is then divided by the former to produce a ‘rectified’ spectrum with a continuum level of 1.0 at all wavelengths.
These rectified spectra were then wavelength calibrated using CGS4 argon arcs taken near in time to the corresponding spectra, and the wavelength scales were corrected to the galaxy rest frame using the recession velocities given above.
It is simple to measure CO absorption strength from a rectified spectrum, simply by calculating the mean level over some standard wavelength interval. In the present paper, we use two measures. The first is the spectroscopic index proposed by Doyon et al. (doyo (1994)):
where is the mean level in a rectified spectrum between 2.31 and 2.4m. The second measure was proposed by Puxley et al. (puxl (1997)) to give strong discrimination between different stellar populations, and is the equivalent width (henceforth ) in nm of the CO absorption between 2.2931 and 2.32m.
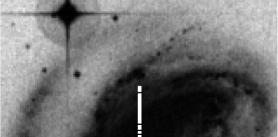
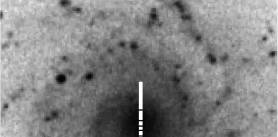
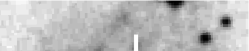
Table 1 contains and values for the following regions of the target spirals:
NGC 613: The 25 wide slit was first positioned on the infrared emission peak at the centre of the galaxy, in a N–S orientation (this position angle was used for all spectra discussed here). Spectra were extracted for three regions along the slit: the 4′′ length centred on this nuclear position (Region 1), the 16′′ centred on the nucleus (Region 2), and an outer bulge/inner disk region sampling light from 8′′–39′′ from the nucleus. The slit was also positioned on a strong spiral arm, 80′′ W and 50′′ S of the nucleus. Again, three spectra were extracted from this slit position. Region 4 comprised the 11′′ centred on the K-band peak from the arm, Region 5 was the 17′′ immediately S of Region 4 and Region 6 the 31′′ immediately N of Region 4. These slit positions are shown superimposed on an optical image of NGC 613 in Fig. 1, and the horizontal black lines on the slits delimit the positions of Regions 1–6. Note that the slit positions shown in Figs. 1–3 are only approximate, since the slits were actually centred on the K-band peak of the galaxy, which may not be coincident with the optical centre of the galaxy.
NGC 628: The slit was positioned on the infrared emission peak at the centre of the galaxy. Spectra were extracted for three regions along the slit: the 4′′ centred on the nucleus (Region 1), the 15′′ centred on the nucleus (Region 2), and an outer bulge region sampling light 7′′–18′′ from the nucleus (Region 3). The slit position and region delimiters are shown in Fig. 2.
NGC 7741: The slit was positioned 15′′ W of the nuclear infrared peak, and lay almost perpendicular to the bar. The spectra were noisy, and only two regions could be usefully defined: Region 1 was the 5′′ centred on the K-band bar peak, and Region 2 the 7′′ immediately N of Region 1. The slit position and region delimiters are shown in Fig. 3.

Fig. 4 shows the correlation between the two measures of CO strength, COsp and , where the data points are taken from Table 1. Most of the points show a good correlation between the two estimates, consistent with the estimated errors. These errors included two components. The first was calculated from the standard deviation in the fitted continuum points, on the assumption that the noise level remains constant through the CO absorption, giving an error on both the continuum level and on the mean level in the CO absorption, whch were added in quadrature. The second error component came from the formal error provided by the continuum fitting procedure. This procedure could leave a residual tilt or curvature in the spectrum, and the formal error was used to quantify this contribution.
Two of the points in fig. 4 (both from the disk of NGC 613) are displaced significantly to the right of this correlation, indicating anomalously low values or (more probably) anomalously high COsp values. This latter could occur due to errors in the extrapolating of the underlying continuum from 2.28 m to 2.4 m, and may indicate that the second error component mentioned above was underestimated, at least for the COsp values. This is likely to be a problem for rapidly star-forming systems, where continuum slope variations are more likely, and argues for using the definition of Puxley et al. puxl (1997) for such objects.
4 Analysis of CO indices
We will now discuss the CO strengths measured in the 3 spiral galaxies. It is useful to compare these with the results of James & Mobasher (jame (1999)) who made CO absorption measurements, with the same telescope/instrument combination, for a sample of 50 elliptical galaxies from rich cluster, group and isolated field environments. They found that the weakest CO absorptions occurred in the 10 isolated elliptical galaxies, which have 0.230.01, 2.80.1 nm. We take these as the baseline levels for a pure old stellar population, but with relatively high metallicity, and the mean spectrum for the 10 ellipticals is shown for comparison purposes as the solid line in Fig. 5 and Fig. 6. (Note that a different instrumental set-up was used for the elliptical spectroscopy and the wavelength range is correspondingly smaller.) CO strengths were typically found by James & Mobasher (jame (1999)) to be larger by 10–15% for cluster ellipticals, presumably due to metallicity and star formation history effects. For a young stellar population, 1–2107 years after a burst of star formation, population synthesis models predict peak CO absorption strengths of 0.40.04, 5.30.5 nm (e.g. Rhoads rhoa (1998), Origlia et al. orig (1999)), which is supported by observations of young LMC clusters by Persson et al. pers (1983). We can then interpret any measured CO strengths lying between these extremes as a weighted sum of young and old populations.
However, a surprising result shown in Table 1 is that several regions show CO absorptions significantly weaker than those expected for old stellar populations, regardless of whether or is used. This is the case for the arm (Region 4) of NGC 613, the central nucleus (Region 1) of NGC 628, and the bar (Region 1) of NGC 7741 (Fig. 5). Such an effect could in principle result from incorrect sky subtraction, which could effectively cause a positive flux offset at all wavelengths and hence decrease the measured and COsp values. However, in every case there are spectra of lower-surface-brightness regions extracted from the same observations, which should show this effect even more strongly, but do not.
The shallow CO features could be explained in terms of metallicity effects. Doyon et al. doyo (1994) find a trend in CO strength with metallicity such that
and Origlia et al. ori97 (1997) find that low metallicity ( between –0.64 and –2.01) globular clusters have significantly lower CO equivalent widths than do elliptical or spiral galaxies. Thus metallicity effects can clearly cause significant differences in CO indices between different objects, or between different stellar components (e.g. bulge, disk and halo) of a given galaxy. However, we do not favour this explanation for the CO index differences found in the present paper, as this would require significantly lower metallicities within, for example, the NGC 613 arm or the NGC 7741 bar, than in the disk material immediately surrounding these features, and at the same galactocentric distances.
Low CO strengths could also be explained by extremely young starburst populations, where even the near-IR light could be dominated by Main Sequence stars. However, supergiants cause a deep CO absorption in the integrated light by 107 years after a burst of star formation (Persson et al. pers (1983), Doyon et al. doyo (1994), Rhoads rhoa (1998)). Thus it is hard to contrive a significant stellar contribution to the light output which gives a CO depth as weak as that measured in these three regions.


A final possibility is that there is a significant non-stellar continuum at these wavelengths. If present, such a component would dilute the stellar light and reduce the measured strength of the CO feature. The most obvious possibility is hot dust, which can radiate significantly in the K-band in strongly star-forming regions of galaxies (Giuricin et al. giur (1993)) and would be expected to affect only localised regions within a given galaxy. We can put a lower limit on the fraction of the galaxy light at 2.3m contributed by such a component, by assuming that the underlying stellar population must have a COsp index of at least 0.23, and an of at least 2.8 nm. This gives two estimates of the fraction of light which must be contributed by any dust emission in each of the three regions of low indices. For the NGC 628 nucleus, these fractions are 25% and 27% of the total light at 2.3m, for the NGC 613 arm 27% and 19%, and for the NGC 7741 bar 34% and 41% respectively. For any reasonable dust temperature (i.e. 1000K) such a component would have a negligible emission at J and H, and hence J–K and H–K colours should be redder by 0.3 magnitudes in such regions of dust emission. Spiral galaxy nuclei frequently show such colour excesses (Glass & Moorwood glas (1985), Seigar & James 1998a ), but such colour changes in arms (e.g. Rix & Rieke rix93 (1993) ) and bars are generally attributed to reddening by dust lanes.
A cleaner test for dust emission would be to detect the emission at longer wavelengths, e.g. in the L (3.8m) band. If 1000K dust contributes 20% of the 2.3m light, it should contribute 40% at 3.8 m, assuming the stellar light to have an effective temperature of 4000 K (K5 giants) and a dust emissivity law. For cooler dust the predicted L excess is greater, and 600 K dust would have to be completely dominant at 3.8m to contribute significantly at 2.3m. Whilst the latter is ruled out by measured JHKL colours of normal galaxies, K-L colour excesses of 0.4–0.7 mag, as predicted for 1000K dust, are frequently seen in star-forming nuclei (Glass & Moorwood glas (1985), Giuricin et al. giur (1993)). It would be very interesting to test whether such excesses are ever seen in strong bars or arms, as the hot dust interpretation of our present data would seem to require. Of course, if there is a significant supergiant population in these regions, as is very likely, the intrinsic CO depth would be greater than we have assumed here, and the required dust component would be correspondingly brighter. With the present data it is impossible to disentangle these two effects.
Table 1 also lists some regions with CO absorptions significantly deeper than would be expected for an old stellar population. From the measured indices and values it is possible to estimate the fraction of light contributed by old and young stellar populations, but it should be emphasised that these are only indicative estimates, and for these regions we neglect the effect of any hot dust or other non-stellar continuum emission. The region with the most significant evidence for a young stellar population is the central nucleus of NGC 613 (Region 1), shown in Fig. 6, which requires 13–24% of the K-band light to be provided by a young population. For Region 2 the fraction is down to 5–19%, while for Region 3 the CO strength is consistent with a purely old stellar population. Thus the outer bulge appears indistinguishable from an elliptical galaxy (as was found by Oliva et al. oliv (1995) for the 3 spirals in their sample), and while the central star formation found by Véron-Cetty & Véron (vero (1986)) is clearly detected here, it appears to be confined to the central 8′′ in radius.
NGC 613 Region 5 is a disk region south of a bright spiral arm, and lies on its leading edge if we assume the arms to be trailing. This region also has a deep CO absorption, implying that 10–30% of the K light comes from recently formed supergiants. There is some evidence for even deeper CO absorption in the disk region (6) on the trailing, concave, side of the arm, but this spectrum is very noisy.
The final region showing marginal evidence for a supergiant population is NGC 628 Region 3, the outer bulge, where is slightly larger than would be expected for an old stellar population, and also larger than in the nuclear regions of NGC 628. Region 3 lies just within the peak of the ring of molecular material detected in CO emission by Wakker & Adler wakk (1995), strengthening the identification of deeper CO absorptions with recent star formation.
5 Conclusions and future work
The principal new result of this paper is that we have found regions of two of the three disk galaxies studied where CO indices are anomalously weak, even when compared with elliptical galaxies specifically selected for the weakness of this feature. Whilst this feature does show metallicity dependence, we feel that the required variations in metallicity within the disks of the individual galaxies studied weigh against this as the dominant cause of our findings. We suggest that our observations indicate the presence of significant continuum emission at 2.3 m, most likely from dust at an effective temperature of 1000K. This component appears to contribute at least 20% of the K-band light in some parts of these galaxies, and would be clearly detected in mid-infrared imaging.
For the NGC 613 central bulge and disk interarm regions, and for the outer bulge of NGC 628, we find evidence for supergiant emission contributing 5–30% of the local K-band surface brightness of these galaxies. These numbers are in good agreement with those measured by Rhoads (rhoa (1998)), and confirm his conclusion that caution should be used when interpreting K-band imaging as an indicator of the old stellar mass distribution in star-forming galaxies. If there were a significant hot dust component in these regions, the intrinsic CO depths would have to be correspondingly greater, and hence the fraction of supergiant light quoted above should be considered a lower limit.
The outer bulge of NGC 613 has a K-band spectrum essentially identical to that of the comparison elliptical galaxies, and thus appears to be dominated by an old stellar population, subject to the uncertainties given above.
We have thus identified a source of uncertainty in the interpretation of K-band imaging of star-forming galaxies, in addition to the supergiant light contribution studied by Rhoads (rhoa (1998)). Some of our spectra, and particularly those taken in regions of local maxima in the K-band light, appear to have an excess continuum source, which we interpret as hot dust with an effective temperature of 1000K. The simplest way to confirm this conclusion would be to combine spectroscopy of the type presented here with HKL imaging of the same regions, which should reveal strong local excesses in the L-band light, and with spatially-resolved metallicity measurements.
Acknowledgements.
We thank the anonymous referee for many useful comments which significantly improved the content and presentation of the paper. The United Kingdom Infrared Telescope is operated by the Joint Astronomy Centre on behalf of the U.K. Particle Physics and Astronomy Research Council.References
- (1) Binney, J.J., Merrifield, M.R., 1998, Galactic Astronomy, Princeton University Press, p. 124
- (2) Block, D.L., Bertin, G., Stockton, A., Grosbol, P., Moorwood, A.F.M., Peletier, R.F., 1994, A&A, 288, 365
- (3) De Vaucouleurs, G., de Vaucouleurs, A., Corwin Jr., H.G., Buta, R.J., Paturel, G., Fouqué, P., 1991, Third reference catalogue of bright galaxies, Springer-Verlag, New York (RC3)
- (4) Doyon, R., Joseph, R.D., Wright, G.S., 1994, ApJ, 421, 101
- (5) Frogel, J.A., Persson, S.E., Aaronson, M., Matthews, K., 1978, ApJ, 220, 75
- (6) Giuricin, G., Biviano, A., Girardi, M., Mardirossian, F., Mezzetti, M., 1993, A&A, 275, 390
- (7) Glass, I.S., Moorwood, A.F.M., 1985, MNRAS, 214, 429
- (8) James, P.A., Mobasher, B., 1999, MNRAS, 306, 199
- (9) Jungwiert, B., Combes, F., Axon, D.J., 1996, A&AS, 125, 479
- (10) Kroupa, P., Tout, C.A., Gilmore, G., 1990, MNRAS, 262, 545
- (11) Oliva, E., Origlia, L., Kotilainen, J.K., Moorwood, A.F.M., 1995, A&A, 301, 55
- (12) Origlia, L, Ferraro, F.R., Fusi Pecci, F., Oliva, E., 1997, A&A, 321, 859
- (13) Origlia, L, Goldader, J.D., Leitherer, C., Schaerer, D., Oliva, E., 1999, ApJ, 514, 96
- (14) Persson, S.E., Aaronson, M., Cohen, J.G., Frogel, J.A., Matthews, K., 1983, ApJ, 266, 105
- (15) Puxley, P.J., Doyon, R., Ward, M.J., 1997, ApJ, 476, 120
- (16) Rhoads, J.E., 1998, AJ, 115, 472
- (17) Ridgway, S.E., Wynn-Williams, C.G., Becklin, E.E., 1994, ApJ, 428, 609
- (18) Rix, H.-W., Rieke, M.J., 1993, ApJ, 418, 123
- (19) Rix, H.-W., Zaritsky, D., 1995, ApJ, 447, 82
- (20) Seigar, M.S., James, P.A., 1998a, MNRAS, 299, 672
- (21) Seigar, M.S., James, P.A., 1998b, MNRAS, 299, 685
- (22) Sharina, M.E., Karachentsev, I.D., Tikhonov, N.A., 1996, A&A, 119, 499
- (23) Tully, R.B., 1988, Nearby Galaxies Catalog, Cambridge University Press, Cambridge
- (24) Véron-Cetty, M.-P., Véron, P., 1986, A&AS, 66, 335
- (25) Wakker, B.P., Adler, D.S., 1995, AJ, 109, 134