VLT Spectroscopy of the z=4.11 Radio Galaxy TN J13381942††thanks: Based on observations at the ESO VLT Antu telescope
Abstract
We present optical, infrared and radio data of the radio galaxy TN J13381942 including an intermediate resolution spectrum obtained with FORS1 on the VLT Antu telescope. TN J13381942 was the first radio galaxy to be discovered in the southern hemisphere and is one of the most luminous Ly objects in its class. The Ly and rest–frame optical emission appear co–spatial with the brightest radio hotspot of this very asymmetric radio source, suggesting extremely strong interaction with dense ambient clouds.
The Ly is spatially extended by 4″(30 kpc), has an enormous rest–frame equivalent width, Å, and has a spectral profile that is very asymmetric with a deficit towards the blue. We interpret this blue-ward asymmetry as being due to absorption of the Ly photons by cold gas in a turbulent halo surrounding the radio galaxy and show that the required neutral hydrogen column density must be in the range cm-2. The two-dimensional spectrum indicates that the extent of the absorbing gas is comparable (or even larger) than the 4″(30 kpc) Ly emitting region.
The VLT observations are sufficiently sensitive to detect the continuum flux both blue-ward and red-ward of the Ly emission, allowing us to measure the Ly forest continuum break (Ly ’discontinuity’, ) and the Lyman limit. We measure a , which is lower than the values found for quasars at this redshift. We interpret this difference as possibly due to a bias towards large introduced in high–redshift quasar samples that are selected on the basis of specific optical colors. If such a bias would exist in optically selected quasars, – and even in samples of Lyman break galaxies –, then the space density of both classes of object will be underestimated. Furthermore, the average H i column density along cosmological lines of sight as determined using quasar absorption lines would be overestimated. Because of their radio-based selection, we argue that radio galaxies are excellent objects for investigating statistics.
Key Words.:
Galaxies: active – galaxies: individual: TN J13381942 – cosmology: observations1 Introduction
Within standard Cold Dark Matter scenarios the formation of galaxies is a hierarchical and biased process. Large galaxies are thought to be assembled through the merging of smaller systems, and the most massive objects will form in over–dense regions, which will eventually evolve into the clusters of galaxies (Kauffmann et al. (1999)). It is therefore important to find and study the progenitors of the most massive galaxies at the highest possible redshifts.
Radio sources are convenient beacons for pinpointing massive elliptical galaxies, at least up to redshifts (Lilly & Longair (1984); Best, Longair & Röttgering (1998)). The near–infrared ‘Hubble’ relation for such galaxies appears to hold up to , despite large K–correction effects and morphological changes (Lilly and Longair 1984; van Breugel et al. 1998, 1999). This suggests that radio sources may be used to find massive galaxies and their likely progenitors out to very high redshift.
While optical, ‘color–dropout’ techniques have been successfully used to find large numbers of ’normal’ young galaxies (without dominant AGN) at redshifts surpassing those of quasars and radio galaxies(Weymann et al. (1998)), the radio and near–infrared selection technique has the additional advantage that it is unbiased with respect to the amount of dust extinction. High redshift radio galaxies (HzRGs) are therefore also important laboratories for studying the large amounts of dust (Dunlop et al. (1994); Ivison et al. (1998)) and molecular gas (Papadopoulos et al. (1999)), which are observed to accompany the formation of the first forming massive galaxies.
Using newly available, large radio surveys we have begun a systematic search for HzRGs to be followed by more detailed studies of selected objects. In this Letter, we present deep intermediate resolution VLT/FORS1 spectroscopy of TN J13381942 which, at , was the first radio galaxy discovered in the southern hemisphere (De Breuck et al. 1999a ), and is one of the brightest and most luminous Ly objects of its class.
In §2, we describe the discovery and previous observations of TN J13381942. In §3 we describe our VLT observations, and in §4 we discuss some of the implications of our results. Throughout this paper we will assume km s-1Mpc-1, =0.15, and . At , this implies a linear size scale of 7.5 kpc/arcsec.
2 Source selection and previous observations
The method we are using to find distant radio galaxies is based on the empirical correlation between redshift and observed spectral index in samples of low-frequency selected radio sources (e.g., Carilli et al. (1999)). Selecting radio sources with ultra steep spectra (USS) dramatically increases the probability of pinpointing high-z radio galaxies, as compared to observing radio galaxies with more common radio spectra. This method, which can to a large extent be explained as a K-correction induced by a curvature of the radio spectra, has been shown to be extremely efficient (e.g., Chambers, Miley & van Breugel (1990); van Breugel et al. 1999a ).
We constructed such a USS sample (; De Breuck et al. 1999b ), consisting of 669 objects, using several radio catalogs which, in the southern hemisphere, include the Texas 365 MHz catalog (Douglas et al. (1996)) and the NVSS 1.4 GHz catalog (Condon et al. (1998)).
As part of our search–program we observed TN J13381942 () with the ESO 3.6m telescope in 1997 March and April (De Breuck et al. 1999a ). The radio source was first identified by taking a 10 minute band image. Followup spectroscopy then showed the radio galaxy to be at a redshift of , based on a strong detection of Ly, and weak confirming C 1549 and He 1640. At this redshift its derived rest–frame low frequency (178 MHz) radio luminosity is comparable to that of the most luminous 3CR sources.
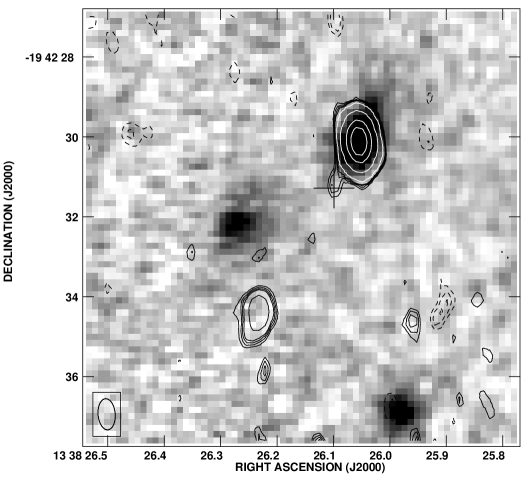
More detailed radio information was obtained with the VLA at 4.71 GHz and 8.46 GHz on 1998 March 24, as part of a survey to measure rotation measures in HzRGs (Pentericci et al. (1999)). We detect two radio components ( mJy; mJy) separated by 55 in the field of the radio galaxy (Fig. 1). The bright NW component has a very faint radio companion ( mJy) at 14 to the SE. Our present observations show that all components have very steep radio spectra with , , and . The proximity and alignment of such rare USS components strongly suggests that they are related and part of one source. While further observations over a wider frequency range would be useful to confirm this, for now we conclude that TN J13381942 is a very asymmetric radio source, and identify component C at and with the radio core. Such asymmetric radio sources are not uncommon (e.g., McCarthy, van Breugel & Kapahi (1991)), and are usually thought to be due to strong interaction of one of its radio lobes with very dense gas or a neighboring galaxy (see for example Feinstein et al. (1999)).
We also obtained a band image with the Near Infrared Camera (NIRC; Mathews & Soifer (1994)) at the Keck I telescope on UT 1998 April 18. The integration time was 64 minutes in photometric conditions with 05 seeing. Observing procedures, calibration and data reduction techniques were similar to those described in van Breugel et al. (1998). Using a circular aperture of 3″, encompassing the entire object, we measure (we do not expect a significant contribution from emission lines at the redshift of the galaxy). In a 64 kpc metric aperture, the magnitude is , which puts TN J13381942 at the bright end, but within the scatter, of the relationship (van Breugel et al. (1998)).
We determined the astrometric positions in our band image using the USNO PMM catalog (Monet et al. (1998)). We next used the positions of nine stars on the R-band image in common with the Keck band to solve the astrometry on the band image. The error in the relative near–IR/radio astrometry is dominated by the absolute uncertainty of the optical reference frame, which is 04 (90% confidence limit; Deutsch (1999)). In figure 1, we show the overlay of the radio and band (rest-frame band) images. The NW hotspot coincides within 0035 of the peak of the band emission, while some faint diffuse extensions can be seen towards the radio core and beyond the lobe. The positional difference between the peak of the band emission and the radio core is 14 (), which suggests that the AGN and peaks of the band and Ly emission may not be co–centered.
3 VLT observations
Because of the importance of TN J13381942 as a southern laboratory for studying HzRGs, we obtained a spectrum of this object with high signal–to–noise and intermediate spectral resolution with FORS1 on the ANTU unit of the VLT on UT 1999 April 20. The purpose of these observations was to study the Ly emission and UV–continuum in detail.
The radio galaxy was detected in the acquisition images ( s; in a 2″ aperture). We used the 600R grism with a 13 wide slit, resulting in a spectral resolution of 5.5 Å (FWHM). The slit was centered on the peak of the band emission at a position angle of 210° North through East. To minimize the effects of fringing in the red part of the CCD, we split the observation into two 1400 s exposures, while offsetting the object by 10″ along the slit between the individual exposures. The seeing during the TN J13381942 observations was 07 and conditions were photometric.
Data reduction followed the standard procedures using the NOAO IRAF package. We extracted the one-dimensional spectrum using a 4″ wide aperture, chosen to include all of the Ly emission. For the initial wavelength calibration, we used exposures of a HeArNe lamp. We then adjusted the final zero point of the wavelength scale using telluric emission lines. The flux calibration was based on observations of the spectrophotometric standard star LTT2415, and is believed to be accurate to . We corrected the spectrum for foreground Galactic extinction using a reddening of determined from the dust maps of Schlegel, Finkbeiner & Davis (1998).

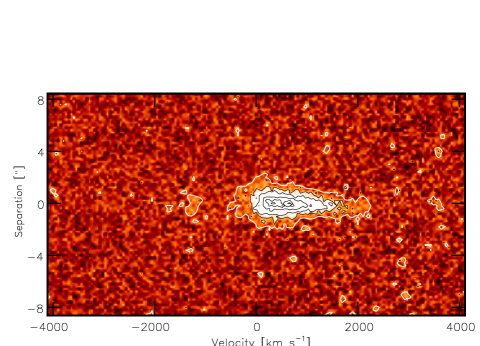
In figure 2 we show the observed one dimensional spectrum and in figure 3 the region of the two-dimensional spectrum surrounding the Ly emission line. Most notable is the large asymmetry in the profile, consistent with a very wide ( km s-1) blue-ward depression. Following previous detection of Ly absorption systems in HzRGs (Röttgering et al. (1995); van Ojik et al. (1997); Dey (1999)) we shall interpret the blue-ward asymmetry in the Ly profile of TN J13381942 as being due to foreground absorption by neutral hydrogen.
The rest–frame equivalent width of Ly in TN J13381942 Å, is twice as high as in the well–studied radio galaxy 4C 41.17 (; Dey et al. (1997)). The large Ly luminosity ( erg s-1 after correction for absorption) makes TN J13381942 the most luminous Ly emitting radio galaxy known.
Following Spinrad et al. (1995), we measure the continuum discontinuity across the Ly line, defined as [] = . Similarly, for the Lyman limit at = 912Å, we find [] = , though this value is uncertain because the flux calibration at the edge of the spectrum is poorly determined.
The presence of these continuum discontinuities further confirm our measured redshift. However, the redshift of the system is difficult to determine accurately because our VLT spectrum does not cover C 1549 or He 1640. Furthermore, since the Ly emission is heavily absorbed, it is likely that the redshift of the peak of the Ly emission (at , ) does not exactly coincide with the redshift of the galaxy. We shall assume .
4 Discussion
TN J13381942 shares several properties in common with other HzRGs but some of its characteristics deserve special comment. Here we shall briefly discuss these.
4.1 Ly emission
Assuming photoionization, case B recombination, and a temperature of K we use the observed Ly emission to derive a total mass () of the H ii gas (e.g., McCarthy et al. (1990)) using M⊙. Here is the filling factor in units of 10-5, is the Ly luminosity in units of ergs s-1, and is the total volume in units of cm3. Assuming a filling factor of 10-5 (McCarthy et al. (1990)), and a cubical volume with a side of 15 kpc, we find M⊙. This value is on the high side, but well within the range that has been found for HzRGs (e.g., van Ojik et al. (1997))).
Previous authors have shown that gas clouds of such mass can cause radio jets to bend and decollimate (e.g., van Breugel Filippenko Heckman & Miley (1985); Lonsdale & Barthel (1986); Barthel & Miley (1988)). Likewise, the extreme asymmetry in the TN J13381942 radio source could well be the result of strong interaction between the radio–emitting plasma and the Ly gas.
4.2 Ly absorption
Our spectrum also shows evidence for deep blue-ward absorption of the Ly emission line. We believe that this is probably due to resonant scattering by cold H i gas in a halo surrounding the radio galaxy, as seen in many other HzRGs (c.f., Röttgering et al. (1995), van Ojik et al. (1997), Dey (1999)). The spatial extent of the absorption edge as seen in the 2-dimensional spectrum (Fig. 3) implies that the extent of the absorbing gas is similar or even larger than the 4″(30 kpc) Ly emitting region.
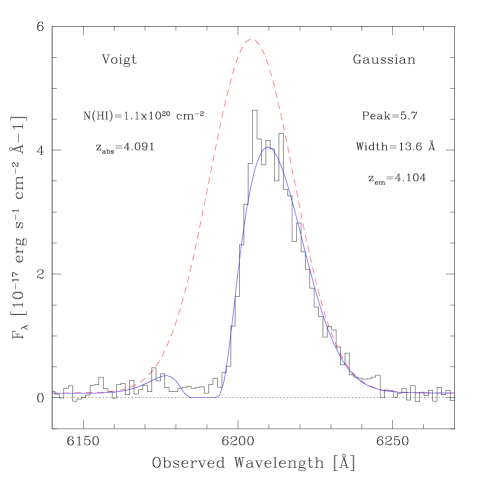
To constrain the absorption parameters we constructed a simple model that describes the Ly profile with a Gaussian emission function and a single Voigt absorption function. As a first step, we fitted the red wing of the emission line with a Gaussian emission profile. Because the absorption is very broad, and extends to the red side of the peak, the parameters of this Gaussian emission profile are not well constrained. We adopted the Gaussian that best fits the lower red wing as well as the faint secondary peak, 1400 km s-1 blue-wards from the main peak. The second step consisted of adjusting the parameters of the Voigt absorption profile to best match the sharp rise towards the main peak. The resulting model (shown along with the parameters of both components in figure 4) adequately matches the main features in the profile. We varied the parameters of both components, and all acceptable models yield column densities in the range cm-2.
The main difference between our simple model and the observations is the relatively flat, but non–zero flux at the bottom of the broad depression. This flux is higher than the continuum surrounding the Ly line, indicating some photons can go through (i.e., a filling factor less than unity) or around the absorbing cloud. If the angular size of absorber and emitter are similar, the size of the absorber is 10 kpc. The total mass of neutral hydrogen then is , comparable to or somewhat less than the total mass of H ii.
4.3 Continuum
Following Dey et al. (1997), and assuming that the rest frame UV continuum is due to young stars, one can estimate the star–formation rate (SFR) in TN J13381942 from the observed rest–frame UV continuum near 1400 Å. From our spectrum we estimate that , resulting in a UV luminosity erg s-1 Å-1 and implying a SFR between 90 720 h M⊙ yr-1 in a kpc2 aperture. These values are similar to those found for 4C 41.17. In this case detailed HST images, when compared with high resolution radio maps, strongly suggested that this large SFR might have been induced at least in part by powerful jets interacting with massive, dense clouds (Dey et al. (1997); van Breugel et al. 1999b ; Bicknell et al. (1999)). The co–spatial Ly emission–line and rest–frame optical continuum with the brightest radio hotspot in TN J13381942 suggests that a similar strong interaction might occur in this very asymmetric radio source.
The decrement of the continuum blue-wards of Ly (Fig. 2) due to the intervening H i absorption along the cosmological line of sight is described by the “flux deficit” parameter (Oke & Korycanski (1982)). For TN J13381942 we measure , comparable to the that Spinrad et al. (1995) found for the radio galaxy 8C 1435+64 (uncorrected for Galactic reddening). This is only the second time the parameter has been measured in a radio galaxy.
The decrement described by is considered to be extrinsic to the object toward which it has been measured, and should therefore give similar values for different classes of objects at the same redshift. Because they have bright continua, quasars have historically been the most popular objects to measure . For , quasars have measured values of (e.g., Schneider, Schmidt & Gunn 1991, 1997 ). Similar measurements for color selected Lyman break galaxies do not yet exist.
Other non-color selected objects, in addition to radio galaxies, which do have reported measurements are serendiptiously discovered galaxies (, Dey et al. (1998)) and narrow-band Ly-selected galaxies (, Hu, McMahon & Cowie (1999)). Because of their larger redshifts these galaxy values can not directly be compared with those of quasars (, Songaila et al. (1999)). However, they seem to fall slightly () below the theoretical extrapolation of Madau (1995) at their respective redshifts, which quasars do follow rather closely. This is also true for the two radio galaxies () at their redshifts. Thus it appears that non-color selected galaxies, whether radio selected or otherwise, have values which fall below those of quasars.
Although, with only two measurements, the statistical significance of the low radio galaxy values is marginal, the result is suggestive. It is worthwhile contemplating the implications that would follow if further observations of radio galaxies and other objects selected without an optical color bias confirmed this trend. Given that optical color selection methods (often used to find quasars, and Lyman break galaxies) favour objects with large values, it is perhaps not surprising that non-color selected objects might have lower values of . Consequently, quasars and galaxies with low values might be missed in color–based surveys. This then could lead to an underestimate of their space densities, and an overestimate of the average H i columns density through the universe.
Radio galaxies have an extra advantage over radio selected quasars (e.g., Hook & McMahon (1998)), because they very rarely contain BAL systems (there is only one such example, 6C 1908+722 at ; Dey (1999)). Such BAL systems are known to lead to relatively large values of , indicating that part of the absorption is not due to cosmological HI gas, but due to absorption within the BAL system (Oke & Korycanski (1982)). A statistically significant sample of radio galaxies would therefore determine the true space density of intervening H i absorbers.
5 Conclusions
Because of its enormous Ly luminosity and strong continuum, its highly asymmetric and broad Ly profile, and its very asymmetric radio/near–IR morphology TN J13381942 is a unique laboratory for studying the nature of HzRGs. It is particularly important to investigate the statistical properties of similar objects by extending the work begun here to a significant sample of HzRGs. The VLT will be a crucial facility in such a study.
Acknowledgements.
We thank the referee, Hy Spinrad, for his comments, which have improved the paper. We also thank Remco Slijkhuis for his help in using the ESO archive, and Mỹ Hà Vuong for useful discussions. The W. M. Keck observatory is a scientific partnership between the University of California and the California Institute of Technology, made possible by the generous gift of the W. M. Keck Foundation. The National Radio Astronomy Observatory is operated by Associated Universities Inc., under cooperative agreement with the National Science Foundation. The work by C.D.B., W.v.B., D.M. and S.A.S. at IGPP/LLNL was performed under the auspices of the US Department of Energy under contract W-7405-ENG-48. DM is also supported by Fondecyt grant No. 01990440 and DIPUC.References
- Barthel & Miley (1988) Barthel, P. D., & Miley, G. K. 1988, Nature, 333, 319
- Best, Longair & Röttgering (1998) Best, P. N,, Longair, M. N., & Röttgering, H. J. A. 1998, MNRAS, 295, 549
- Bicknell et al. (1999) Bicknell, G., Sutherland, R., van Breugel, W., Dopita, M., Dey, A., & Miley, G. 1999, ApJ, in press, astro-ph/9909174
- Carilli et al. (1999) Carilli, C., Röttgering, H., Miley, G., Pentericci, L, & Harris, D. 1998, in ’The Most Distant Radio Galaxies’, ed. H. Röttgering, P. Best & M. Lehnert (Amsterdam: KNAW), p. 123
- Chambers, Miley & van Breugel (1990) Chambers, K. C., Miley, G. K., & van Breugel, W. J. M. 1990, ApJ, 363, 21
- Condon et al. (1998) Condon, J. J., Cotton, W. D., Greisen, E. W., Yin, Q. F., Perley, R. A., Taylor, G. B. & Broderick, J. J. 1998, AJ, 115, 1693
- (7) De Breuck, C., van Breugel, W., Röttgering, H., Miley, G., & Carilli, C. 1998, in “Looking Deep in the Southern Sky”, ed. R. Morganti & W. Couch (Berlin Heidelberg: Springer), p. 246
- (8) De Breuck, C., van Breugel, W., Röttgering, H.,& Miley, G. 1999, A&AS, in preparation
- Deutsch (1999) Deutsch, E. W. 1999, AJ, in press, astro-ph/9906177
- Dey et al. (1997) Dey, A., van Breugel, W., Vacca, W., & Antonucci, R. 1997, ApJ, 449, 698
- Dey et al. (1998) Dey, A. , Spinrad, H. , Stern, D. , Graham, J. R. & Chaffee, F. H. 1998, ApJ, 498, L93
- Dey (1999) Dey, A. 1999, in ’The Most Distant Radio Galaxies’, ed. H. Röttgering, P. Best & M. Lehnert (Amsterdam: KNAW), p. 19
- Douglas et al. (1996) Douglas, J. N., Bash, F. N., Bozyan, F. A., Torrence, G. W., & Wolfe, C. 1996, AJ, 111, 1945
- Dunlop et al. (1994) Dunlop, J. S., Hughes, D. H., Rawlings, S., Eales, S. A., & Ward, M. J. 1994, Nature, 370, 347
- Feinstein et al. (1999) Feinstein, C., Macchetto, F., Martel, A., Sparks, W., & McCarthy, P. 1999, astro-ph/9906059
- Hook & McMahon (1998) Hook, I., & McMahon 1998, MNRAS, 294, 7
- Hu, McMahon & Cowie (1999) Hu, E. M., McMahon, R. G., & Cowie, L. L., ApJ, 522, 9L
- Ivison et al. (1998) Ivison, R. J. et al. 1998, ApJ, 494, 211
- Kauffmann et al. (1999) Kauffmann, G., Colberg, J. M., Diaferio, A., & White, S. D. M. 1999, MNRAS, 303, 188
- Lilly & Longair (1984) Lilly, S. J. & Longair, M., 1984, MNRAS, 211, 833
- Lonsdale & Barthel (1986) Lonsdale, C. J. & Barthel, P. D. 1986, ApJ, 303, 617
- Madau (1995) Madau, P. 1995, ApJ, 441, 18
- Mathews & Soifer (1994) Mathews, K., & Soifer, B. T., 1994, in Proc. Infrared Astronomy with Arrays: The Next Generation, ed. I. McClean (Dordrecht: Kluwer), p. 239
- McCarthy et al. (1990) McCarthy, P. J., Spinrad, H. , Dickinson, M. , van Breugel, W. , Liebert, J. , Djorgovski, S. & Eisenhardt, P. 1990, ApJ, 365, 487
- McCarthy, van Breugel & Kapahi (1991) McCarthy, P., van Breugel, W., & Kapahi, V. K. 1991, ApJ, 371, 478
- Monet et al. (1998) Monet, D. et al. 1998, USNO-SA2.0, (U.S. Naval Observatory, Washington DC)
- Papadopoulos et al. (1999) Papadopoulos, P. P., Röttgering, H. J. A., van der Werf, P. P., Guilloteau, S., Omont, A., Tilanus, R. P. J., and van Breugel, W. J. M. 1999, ApJ, in press
- Pentericci et al. (1999) Pentericci, L. et al. 1999, in preparation
- Oke & Korycanski (1982) Oke, J. B., & Korycanski, D. G., ApJ, 255, 11
- Röttgering et al. (1995) Röttgering, H. J. A., Hunstead, R. W., Miley, G. K., van Ojik, R., & Wieringa, M. H. 1995, MNRAS, 277, 389
- Schlegel, Finkbeiner & Davis (1998) Schlegel, D. J., Finkbeiner, D. P., Davis, M. 1998, ApJ, 500, 525
- Schneider, Schmidt & Gunn (1991) Schneider, D. P., Schmidt, M, & Gunn, J. E. 1991, AJ, 101, 2004
- Schneider, Schmidt & Gunn (1997) Schneider, D. P., Schmidt, M, & Gunn, J. E. 1997, AJ, 144, 36
- Songaila et al. (1999) Songaila, A., Hu, E. M., & Cowie, L. L. 1999, ApJ, in press, astro-ph/9908321
- Spinrad et al. (1995) Spinrad, H., Dey, A., & Graham, J. R. 1995, ApJ, 438, 51
- van Breugel Filippenko Heckman & Miley (1985) van Breugel, W., Filippenko, A. V., Heckman, T. & Miley, G. 1985, ApJ, 293, 83
- van Breugel et al. (1998) van Breugel, W., Stanford, S. A., Spinrad, H., Stern, D., & Graham, J. R. 1998, ApJ, 502, 614
- (38) van Breugel, W., De Breuck, C., Stanford, S. A., Stern, D., Röttgering, H., & Miley, G. 1999, ApJ, 518, 61
- (39) van Breugel, W. et al. 1999, in ’The Most Distant Radio Galaxies’, ed. H. Röttgering, P. Best & M. Lehnert (Amsterdam: KNAW), p. 49
- van Ojik et al. (1996) van Ojik, R., Röttgering, H., Carilli, C., Miley, G., Bremer, M., & Machetto, F. 1996, A&A, 313, 25
- van Ojik et al. (1997) van Ojik, R., Röttgering, H., Miley, G., & Hunstead, R. W. 1997, A&A, 317, 358
- Weymann et al. (1998) Weymann, R. J. et al. 1998, ApJ, 505, L95