Discovery of Damped Lyman-Alpha Systems at Redshifts Less Than 1.65 and Results on their Incidence and Cosmological Mass Density1
Abstract
We present results from an efficient, non-traditional survey to discover damped Ly (DLA) absorption systems with neutral hydrogen column densities atoms cm-2 and redshifts . In the past, identification of DLA systems at has been difficult due to their rare incidence and the need for UV spectroscopy to detect Ly absorption at these low redshifts. Our survey relies on the fact that all known DLA systems have corresponding Mg II absorption. In turn, Mg II absorption systems have been well-studied and their incidence at redshifts as a function of the Mg II rest equivalent width, , is known (Steidel & Sargent 1992). Therefore, by observing the Ly line corresponding to identified low-redshift Mg II systems and determining the fraction of these that are damped, we have been able to infer the statistical properties of the low-redshift DLA population. In an earlier paper (Rao, Turnshek, & Briggs 1995), we presented initial results from an archival study with data from HST and IUE. Now, with new data from our HST GO program, we have more than doubled the sample of Mg II systems with available ultraviolet spectroscopic data. In total we have uncovered 12 DLA lines in 87 Mg II systems with Å. Two more DLA systems were discovered serendipitously in our HST spectra. At the present time the total number of confirmed DLA systems at redshifts is 23.
The significant results of the survey are: (1) the DLA absorbers are drawn almost exclusively from the population of Mg II absorbers which have Å. Moreover, half of all absorption systems with both Mg II and Fe II Å are DLA systems. (2) The incidence of DLA systems per unit redshift, , decreases as a function of decreasing redshift. The low redshift data are consistent with the larger incidence of DLA systems seen at high redshift (Wolfe et al. 1995) and the inferred low incidence for DLA at derived from 21 cm observations of gas-rich spirals (Rao, Turnshek, & Briggs 1995). However, the errors in our determination are large enough that it is not clear if the decrease per comoving volume begins to be significant at , or possibly does not set in until . (3) On the other hand, the cosmological mass density of neutral gas in low-redshift DLA absorbers, , is observed to be comparable to that observed at high redshift. In particular, there is no observed trend which would indicate that at low redshift is approaching the value at , which is a factor of lower than . (4) The low-redshift DLA absorbers exhibit a larger fraction of very high column density systems in comparison to determinations at both high redshift and at . In addition, at no redshift is the column density distribution of DLA absorbers observed to fall off in proportion to with increasing column density, a trend that is theoretically predicted for disk-like systems. We discuss this and other mounting evidence that DLA absorption does not arise solely in luminous disks but in a mixture of galaxy types.
Although we have doubled the sample of confirmed low-redshift DLA systems, we are still confronted with the statistics of small numbers. As a result, the errors in the low-redshift determinations of and are substantial. Therefore, aside from the above evolutionary trends, we also discuss associated limitations caused by small number statistics and the robustness of our results. In addition, we note concerns due to gravitational lensing bias, reliance on the Mg II statistics, dust obscuration, and the sensitivity of local H I 21 cm emission surveys.
Subject headings:
cosmology: observations - quasars: absorption spectra - surveys - galaxies: observations - galaxy formation1. Introduction
QSO absorption-line systems provide one of the most powerful probes of the gaseous components associated with cosmologically distant galaxies. Except for the small fraction of absorption-line systems that are ejected from QSOs, the absorption lines reveal the presence of intervening gaseous clouds all the way up to the redshifts of the most distant QSOs in the Universe. Thus, independent of galaxy luminosity, and provided that dust obscuration effects are small, QSO absorption lines can probe the gas in galaxies up to redshift , back to a time when the Universe was less than 10% of its present age. The absorbing clouds are empirically found to have neutral hydrogen column densities in the range atoms cm-2, and they are thought to be associated with anything from primordial clouds in the intergalactic medium (possibly the weakest “Ly forest” systems) to low-luminosity galaxies, interacting systems, low surface brightness (LSB) galaxies, and the evolved gaseous spheroidal and disk components of the most luminous galaxies.
Yet, despite the wealth of information on QSO absorption lines that has been gleaned from ground-based studies — and now from many years of observation with the Hubble Space Telescope (HST) — there is still much to be learned about the low-redshift (), high column density absorbers referred to as damped Ly (DLA) systems. Historically these relatively rare high column density systems were the subject of intensive searches because, by comparison with the Ly absorption signature produced by the Galaxy, they were thought to represent the signature of the most luminous high-redshift gas-rich disk galaxies (Wolfe et al. 1986, hereafter WTSC86). However, we now know that this is not the only explanation for DLA systems and, in fact, the most luminous disk galaxies may not even dominate the population of DLA galaxies (e.g. Le Brun et al. 1997, Rao & Turnshek 1998).
The DLA systems are classically defined to have neutral hydrogen column densities atoms cm-2 in statistical surveys (WTSC86). There is a practical reason for this definition — although damping wings in a Ly absorption-line profile with low velocity dispersion ( km s-1) set in at column densities of a few times atoms cm-2, they still have relatively small rest equivalent widths (e.g. Å). Only Ly absorption lines with considerably larger rest equivalent widths, say Å, are easily recognized in low-resolution spectra. In turn, low-resolution spectroscopy offers an efficient way to survey the Ly forest and search for rare DLA absorption lines. Thus, a 10 Å rest equivalent width threshold is adopted in DLA spectroscopic surveys and this corresponds to atoms cm-2 in the limit of radiative damping.
In the past, surveys for DLA absorption have been used to study the distribution of neutral hydrogen at high redshift (WTSC86; Lanzetta et al. 1991; Wolfe et al. 1995, hereafter WLFC95). These high-redshift studies indicate that DLA absorbers contain the bulk of the observable neutral gas mass in the Universe. However, spectroscopic detection of these absorbers using ground-based telescopes can only be done at redshifts . The detection of DLA at lower redshifts, where observations of Ly require UV data, has been difficult due to limited HST resources. But for cosmologies and = 0, corresponds to a lookback time of 62% of the age of the Universe ( 77% for = 0.5). Thus, the determination of the statistics and properties of DLA systems at these redshifts is crucial for understanding the formation and evolution of galaxies. Since the occurrence of a DLA system is relatively rare and the number of QSOs studied in the UV has, until recently, been small, progress in this area has been slow. The HST QSO Absorption Line Key Project survey found only one DLA system with redshift towards Q0935+417 (Jannuzi et al. 1998) in a redshift path of . Moreover, only two DLA systems have been confirmed from an IUE survey (Lanzetta, Wolfe, & Turnshek 1995, hereafter LWT95) which originally reported the discovery of 14 low-redshift DLA candidate systems. One of these is the Key Project system towards Q0935+417 and the other is the system towards EX 0302223 (Pettini & Bowen 1997; Boissé et al. 1998). Four of the 14 systems had Å and formed the final sample from which they derived the low-redshift DLA statistics; the system towards EX 0302223 was not one of these four. Thus, the IUE data and the statistical results derived from them, which were subsequently reported in many studies (e.g., WLFC95, Storrie-Lombardi et al. 1996a, Storrie-Lombardi, McMahon, & Irwin 1996b, Pei, Fall, & Hauser 1999), should now be considered unreliable.
Previously, we used unbiased results that could be extracted from HST and IUE archival spectra to place limits on the properties of the low-redshift DLA population (Rao, Turnshek, & Briggs 1995, hereafter RTB95). In this paper, we discuss our recently completed HST-FOS observing program to discover low-redshift () DLA systems. Coupled with our earlier archival work, we have now completed an unbiased study of the Ly absorption line in 87 Mg II absorption-line systems, 12 of which we find to be DLA systems which formally meet the classical criterion of atoms cm-2. In addition, two new classical DLA systems with no existing Mg II information were discovered serendipitously in our HST spectra. Consequently, our survey has greatly increased the number of known low-redshift DLA systems. Including the 14 classical DLA systems which were uncovered in this survey, at the present time there are 23 published low-redshift () DLA systems for which atoms cm-2 has been confirmed on the basis of UV spectroscopy of the Ly absorption-line profile or 21 cm absorption. Although DLA systems with somewhat lower column densities can often be detected using HST spectra, we have set our threshold column density for detection to the classical value so that meaningful comparisons between the statistics of these systems at low redshift and those found in high-redshift surveys can be made.
In §2, we describe the survey, some ancillary data which we use, and the analysis which leads to the identification of the DLA systems. In §3, we discuss the statistical properties of the Mg II sample. In §4, we derive the incidence of low-redshift DLA systems, , and their cosmological mass density, , and compare them to determinations at high redshift. In §5, we derive the DLA column density distribution, , and consider its evolution. We find that while the incidence of DLA systems at low redshift shows some indication of dropping with decreasing redshift to a value consistent with observations of the H I cross-sections of local spirals, there is no clear evidence that their cosmological mass density drops from the large values observed at high redshift to the value inferred at (although the error bars remain large). Moreover, contrary to previous claims, there is evidence that the DLA column density distribution flattens at low redshift when compared to the high-redshift DLA column density distribution. In §6, we discuss the limitations of our results as well as concerns about the possible effects of obscuration by dust and gravitational lensing. We discuss the nature of the DLA absorber population in §7 and the conclusions are summarized in §8.
2. UV Spectroscopic Survey for DLA Systems
The details of our spectroscopic survey for DLA systems are presented below. First we discuss the unbiased method of searching for DLA which allows us to derive the statistical properties of the DLA absorbers (§2.1). We then describe the extent to which the survey relies on archival observations (§2.2) and new observations (§2.3); the role of 21 cm observations in the exclusion and selection of objects is also described (§2.4). The identified DLA systems are presented in §2.5 and an object of special interest, which was a DLA candidate but is now identified as a grouping of Ly absorption lines on a supercluster size scale, is discussed in §2.6.
2.1. Unbiased Selection of Mg II Systems for UV Spectroscopic Study
The Mg II selection method for finding DLA systems with was discussed in RTB95. In brief, since all DLA systems discovered so far exhibit metal-line absorption (Turnshek et al. 1989; Lu et al. 1993; Wolfe et al. 1993; Lu & Wolfe 1994), the probability of finding DLA lines is greatly increased if a search is restricted to QSOs whose spectra show intervening metal-line absorption. Mg II absorption lines can be detected from the ground with optical spectroscopy for redshifts , and their statistical properties are known (Steidel & Sargent 1992, hereafter SS92). Thus, if the fraction of DLA systems in an unbiased sample of Mg II systems can be determined, then the unbiased incidence of DLA systems at redshifts as low as can be constructed from the known incidence of the Mg II systems.
Our initial Mg II sample was drawn from a list of over 360 Mg II systems in the literature with (Rao 1994). The sample of Mg II systems used to search for DLA absorption was constructed after excluding (1) Mg II absorption lines with rest equivalent width Å, (2) systems for which the predicted position of the Ly line fell within a broad absorption line (BAL) trough in the spectrum of a BAL QSO (Turnshek 1988; Turnshek 1997a,b), (3) previously known H I 21 cm absorbers (§2.4), (4) systems for which the predicted position of the Ly line was shortward of a known Lyman series absorption edge (i.e. a Lyman limit), and (5) Mg II systems within 1000 km s-1 of the QSO emission redshift. Furthermore, in accordance with the criterion adopted by SS92, Mg II systems within 1000 km s-1 of each other were considered to be a single system. This resulted in a sample of 243 Mg II systems which could be observed for follow-up study if unlimited telescope time were available. These 243 systems define our total possible sample.
2.2. Update on HST and IUE Archival Data
The archival study of RTB95 included 43 Mg II systems which satisfied the selection criteria above (§2.1) and which had adequate UV spectral data (see Table 1 in RTB95) to search for DLA or DLA candidates. Two DLA lines ( in PKS 0454+039 and in 3C336 (1622+259)) and four candidates were identified. With the availability of additional archival data, the archival portion of the RTB95 survey has now been updated and modified as explained below.
One of the four RTB95 DLA candidates, the system towards EX 0302223, has now been confirmed as a DLA system. Two candidates, the system towards Q0151+045 and the system towards PG 1247+268, were remeasured using HST-FOS data and they did not meet the minimum H I column density criterion. The fourth RTB95 DLA candidate, the system towards PG 0117213, was observed with HST-FOS in spectropolarimetric mode (see figure 3 in Koratkar et al. 1998 for the recalibrated spectrum). We have determined that this candidate system is not damped, but discuss it in §2.6 as an object of special interest. In addition, although RTB95 discounted the IUE spectrum of the system in Q0957+561A as showing atoms cm-2, we have now remeasured its spectrum using higher resolution and signal-to-noise ratio HST-FOS data and find it to be classically damped. Also, we find one of the six new archival systems, in Q1209+107, to be damped. In order to treat all of the sample data consistently, we have remeasured the H I column densities and uncertainties for the archival DLA systems by fitting Voigt profiles to the data, even when the DLA systems in these objects were previously studied by others (see §2.5). These details, including six more systems that have since appeared in the HST archives and which we have added to our observed sample, are given in Table 1. Finally, we note that in Table 1 of RTB95 it was erroneously reported that the Mg II system in Q0420014 was part of our sample, however there is no available UV spectrum of this object in the required wavelength range. Thus, this system is now explicitly excluded from the observed sample. Currently, the total number of archival Mg II systems included in our Ly survey is 48.
| QSO | Coordinate | aa Apparent magnitude and emission redshift are from Véron-Cetty & Véron (1998). | aa Apparent magnitude and emission redshift are from Véron-Cetty & Véron (1998). | Mg II | Ref.bb Reference for , , and Mg I. | Mg Icc ’+’ indicates the presence of, and ’’ indicates the absence of the said absorption line. ’…’ is entered where no data are available. | DLAcc ’+’ indicates the presence of, and ’’ indicates the absence of the said absorption line. ’…’ is entered where no data are available. | Sourcedd The Principal Investigator of the HST archival program and the proposal identification number (PID) are listed. | |
|---|---|---|---|---|---|---|---|---|---|
| Designation | (Å) | ||||||||
| PG 0117+213 | 0117+213 | 16.1 | 1.491 | 0.5761 | 0.91 | 1 | + | Koratkar, PID 6109 | |
| Q 0151+045 | 0151+045 | 16.9 | 0.404 | 0.1602 | 1.55 | 2 | + | Tytler, PID 4396 | |
| EX 0302223 | 0302-223 | 16.4 | 1.409 | 1.0096 | 1.16 | 3 | + | + | Burbidge, PID 6224 |
| Q 0333+321 | 0333+321 | 17.5 | 1.259 | 0.9531 | 0.47 | 1 | Wills, PID 5441 | ||
| PKS 0454+039 | 0454+039 | 16.5 | 1.343 | 0.8596 | 1.53 | 3 | + | + | Bergeron, PID 5351 |
| Q 0957+561A | 0957+561A | 17.0 | 1.414 | 1.3911 | 2.12 | 4 | + | Burbidge, PID 5683 | |
| Q 1209+107 | 1209+107 | 17.8 | 2.193 | 0.3930 | 1.00 | 5 | Bergeron, PID 5351 | ||
| 0.6295 | 2.92 | 5 | + | Bergeron, PID 5351 | |||||
| PG 1247+268 | 1247+268 | 15.6 | 2.043 | 1.2232 | 0.48 | 1 | + | Burbidge, PID 5095 | |
| PG 1248+401 | 1248+401 | 16.1 | 1.032 | 0.7729 | 0.76 | 1 | Bahcall, PID 5664 | ||
| PKS 1327206 | 1327206 | 17.0 | 1.165 | 0.8500 | 2.11 | 6 | + | Tye, PID 5654 | |
| Q 1517+239 | 1517+239 | 17.3 | 1.903 | 0.7382 | 0.30 | 7 | Foltz, PID 5320 | ||
| 3C 336 | 1622+239 | 17.5 | 0.927 | 0.6561 | 1.29 | 1 | + | Steidel, PID 5304 | |
References. — (1) SS92; (2) Bergeron et al. 1988; (3) Petitjean & Bergeron 1990; (4) Caulet 1989; (5) Young, Sargent, & Boksenberg 1982; (6) Bergeron, D’Odorico, & Kunth 1987; (7) Sargent, Boksenberg, & Steidel 1988
2.3. New HST-FOS Observations
In order to extend our original archival study (RTB95) and improve the statistics, we carried out a large UV spectroscopic survey of low-redshift Mg II systems with HST-FOS in an HST Cycle 6 program. The survey was optimized by selecting QSOs that: (1) had more than one Mg II system whose Ly line could be observed in an FOS spectrum but that were physically unassociated, i.e., the difference in absorption redshifts corresponded to more than 1000 km s-1 and (2) were bright enough to obtain adequate signal-to-noise ratios in a single orbit at the expected position of the Ly line. The 1.0-PAIR aperture was used to obtained all the spectra and the FOS grating selection was based on the expected position of the Ly line. The data generally have minimum signal-to-noise ratios of S/N 11 for the high resolution G190H/RD and G270H/RD gratings and S/N 15 for the low resolution G160L/RD and G160L/BL gratings. The QSO limiting V magnitude requirements for obtaining these minimum S/N ratios in 27 minute exposures, which was typical for our sample, is shown in Figure 1 for the various gratings. By the end of Cycle 6, before FOS was decommissioned, we had used 40 orbits to obtain 38 spectra of 36 QSOs that included the expected location of the Ly lines of 60 Mg II systems (actually, in one case only Ly and higher order lines were available, but this was sufficient for our purposes). No data were obtained during 2 orbits due to technical problems with HST.

The details of this part of the Mg II sample and associated new HST-FOS observations are given in Table 2, with entries taken from the Véron-Cetty & Véron (1998) QSO catalog. Specifically, column 1 gives the QSO’s name; column 2 gives the QSO’s 1950 coordinate designation; column 3 gives its V magnitude; column 4 gives its emission redshift; column 5 gives the Mg II absorption redshift; and column 6 gives the reference from which the absorption redshift was obtained. Columns 7, 8, and 9 give details of the HST-FOS observation, i.e., grating, exposure time, and observation date, respectively. In cases where two or more systems were chosen for observation with one grating, the grating and integration time are entered alongside the lowest redshift absorption system. Applicable comments are noted in column 10, with an explanation in the footnotes.
Unfortunately, previously unobserved Lyman limit absorption eliminated information on the Ly absorption line in 21 of the 60 new Mg II systems (see column 10 of Table 2). In addition, the G160L/RD spectrum of S4 0248+43 was too noisy near the redshifted () Ly wavelength (1700 Å) to determine if the Ly absorption line in this particular Mg II system is damped using the existing FOS data alone. However, we have retained this system in our sample since its damped nature has been revealed through 21 cm observations (see §2.4).
Therefore, with the aid of archival and new observations, it is now possible to determine the nature of the Ly line in a total of 87 Mg II systems. These 87 systems define our current unbiased sample, which we will henceforth refer to as the RT sample. In §3 we discuss some of the additional properties of this sample (e.g. other metal lines). The discussion in the remainder of this section primarily pertains to the determination of which of these 87 systems have associated DLA lines.
| QSOaa From Véron-Cetty & Véron 1998. | Coordinate | aa From Véron-Cetty & Véron 1998. | aa From Véron-Cetty & Véron 1998. | Ref.bb The reference for the Mg II absorption line redshift: (1) Sargent et al. 1979; (2) Lanzetta, Turnshek, & Wolfe 1987; (3) Sargent, Boksenberg, & Steidel 1988; (4) Sargent, Young, & Boksenberg 1982; (5) SS92; (6) Sargent, Steidel, & Boksenberg 1989; (7) Womble et al. 1990; (8) Carswell, Smith, & Whelan 1977; (9) Boulade et al. 1987; (10) Falomo 1990; (11) Ulrich & Owen 1977; (12) Foltz et al. 1986; (13) Jakobsen, Perryman, & Cristiani 1988; (14) Bergeron & Boissé 1991; (15) Boksenberg et al. 1978; (16) Barthel, Tytler, & Thomson 1990; (17) Aldcroft, Bechtold, & Elvis 1994. | FOS | Exposure | Observation | Notescc This column indicates that the nature of the Ly line associated with the Mg II absorption system could not be determined either due to an intervening Lyman limit system (LL), in which case there was no continuum, or because the signal to noise ratio at the expected position of the Ly line was very poor. | |
|---|---|---|---|---|---|---|---|---|---|
| Designation | Mg II | Grating | Time (s) | Date | |||||
| Q 0002422 | 0002422 | 17.2 | 2.758 | 0.8366 | 1 | G270H/RD | 1170 | 2 June 1996 | LL |
| 1.5413 | 2 | ||||||||
| PHL 938 | 0058+019 | 17.2 | 1.959 | 0.6128 | 3 | G190H/RD | 1590 | 12 July 1996 | |
| PKS 011904 | 0119046 | 16.9 | 1.953 | 0.6577 | 4 | G190H/RD | 1590 | 22 July 1996 | |
| B2 0141+33 | 0141+339 | 17.6 | 1.450 | 0.4709 | 5 | G160L/RD | 1580 | 24 Aug 1996 | |
| UM 366 | 0143015 | 17.7 | 3.141 | 1.0383 | 6 | G270H/RD | 1590 | 5 June 1996 | |
| 1.2853 | 6 | ||||||||
| UM 675 | 0150202 | 17.4 | 2.147 | 0.7801 | 3 | G190H/RD | 1590 | 12 Sep 1996 | |
| PKS 0229+13 | 0229+131 | 17.7 | 2.065 | 0.3723 | 3 | G160L/BL | 1400 | 29 Aug 1996 | LL |
| 0.4177 | 3 | LL | |||||||
| S4 0248+43 | 0248+430 | 17.6 | 1.310 | 0.3939 | 5 | G160L/RD | 1660 | 21 Aug 1996 | poor S/N |
| 0.4515 | 7 | ||||||||
| PKS 0421+019 | 0421+019 | 17.0 | 2.055 | 1.3918 | 5 | G270H/RD | 1600 | 20 Aug 1996 | |
| 1.6380 | 5 | ||||||||
| PKS 042413 | 0424131 | 17.5 | 2.166 | 1.0345 | 5 | G270H/RD | 1590 | 13 July 1996 | LL |
| 1.4080 | 5 | ||||||||
| 1.5623 | 5 | ||||||||
| Q 0453423 | 0453423 | 17.1 | 2.661 | 0.7255 | 8 | G190H/RD | 1700 | 22 May 1996 | LL |
| 0.9079 | 8 | G270H/RD | 2440 | LL | |||||
| 1.1492 | 8 | LL | |||||||
| 1.4592 | 8 | LL | |||||||
| OI 363 | 0738+313 | 16.1 | 0.630 | 0.2213 | 9 | G160L/BL | 1520 | 15 May 1996 | |
| PKS 082322 | 0823223 | 16.2 | 0.910 | 0.9103 | 10 | G270H/RD | 1610 | 26 June 1996 | |
| B2 0827+24 | 0827+243 | 17.3 | 0.941 | 0.5247 | 11 | G160L/RD | 1560 | 28 Oct 1996 | |
| MG 0833+1123 | 0830+115 | 18.0 | 2.979 | 0.8032 | 6 | G190H/RD | 1570 | 15 May 1996 | LL |
| 4C 13.39 | 0843+136 | 17.8 | 1.877 | 0.6064 | 12 | G160L/RD | 1540 | 15 May 1996 | |
| TB 0933+733 | 0933+732 | 17.3 | 2.525 | 1.4789 | 5 | G270H/RD | 1900 | 6 Dec 1996 | |
| 1.4973 | 5 | ||||||||
| PKS 0952+17 | 0952+179 | 17.2 | 1.478 | 0.2377 | 5 | G160L/BL | 1430 | 24 Dec 1996 | |
| SBS 0953+549 | 0953+549 | 17.4 | 2.579 | 1.0590 | 5 | G270H/RD | 1790 | 29 Sep 1996 | LL |
| 1.0642 | 5 | LL | |||||||
| 1.2624 | 5 | LL | |||||||
| MARK 132 | 0958+551 | 16.0 | 1.760 | 0.2413 | 3 | G160L/BL | 1670 | 11 June 1996 | |
| TOL 1035.827.6 | 1035276 | 19.0 | 2.168 | 0.8230 | 13 | G160L/RD | 1510 | 15 June 1996 | |
| 4C 61.20 | 1049+616 | 16.5 | 0.421 | 0.2251 | 9 | G160L/BL | 1660 | 1 June 1996 | |
| 0.3933 | 9 | ||||||||
| PKS 112714 | 1127145 | 16.9 | 1.187 | 0.3130 | 14 | G160L/BL | 1450 | 22 June 1996 | |
| B2 1148+38 | 1148+386 | 17.0 | 1.304 | 0.2130 | 9 | G160L/BL | 1520 | 31 May 1996 | |
| 0.5533 | 5 | ||||||||
| UM 485 | 1213002 | 17.0 | 2.691 | 1.5543 | 5 | G270H/RD | 1590 | 2 Dec 1996 | |
| TON 1530 | 1222+228 | 16.6 | 2.048 | 0.6681 | 3 | G190H/RD | 1600 | 4 July 1996 | |
| Q 1246057 | 1246057 | 16.7 | 2.224 | 0.6399 | 15 | G190H/RD | 1600 | 12 June 1996 | LL |
| 4C 65.15 | 1323+655 | 17.5 | 1.624 | 1.5181 | 16 | G270H/RD | 1820 | 9 Nov 1996 | |
| 1.6101 | 16 | ||||||||
| PG 1329+412 | 1329+412 | 17.2 | 1.937 | 1.2820 | 5 | G270H/RD | 1710 | 2 June 1996 | |
| 1.6011 | 5 | ||||||||
| PKS 1354+25 | 1354+258 | 18.0 | 2.006 | 0.8585 | 16 | G270H/RD | 1600 | 17 Nov 1996 | |
| 0.8856 | 16 | ||||||||
| 1.4205 | 16 | ||||||||
| MC 1511+103 | 1511+103 | 17.7 | 1.546 | 0.4370 | 12 | G160L/RD | 1550 | 25 June 1996 | LL |
| 4C 18.43 | 1540+180 | 18.0 | 1.661 | 0.6945 | 16 | G190H/RD | 1570 | 6 July 1996 | LL |
| 0.7294 | 16 | LL | |||||||
| 0.7936 | 16 | LL | |||||||
| KP 1623.7+26.8B | 1623+269 | 16.0 | 2.521 | 0.3292 | 3 | G160L/BL | 1920 | 7 July 1996 | LL |
| 0.8881 | 3 | G270H/RD | 1630 | ||||||
| PG 1715+535 | 1715+535 | 16.5 | 1.940 | 0.3674 | 3 | G160L/BL | 1660 | 8 Nov 1996 | LL |
| PKS 1821+10 | 1821+107 | 17.3 | 1.364 | 0.4738 | 5 | G190H/RD | 1590 | 3 June 1996 | LL |
| 0.5702 | 5 | LL | |||||||
| 1.2528 | 5 | ||||||||
| 3C 395 | 1901+319 | 17.5 | 0.635 | 0.3901 | 17 | G160L/BL | 1460 | 12 Aug 1996 |
2.4. Exclusion and Selection of DLA Systems Based on 21 cm Data
We excluded all previously known 21 cm absorbers from the RT sample because we had a priori knowledge of the high H I column density of the absorber. Moreover, HST UV spectra of the background QSOs were taken by various researchers for the explicit purpose of studying the damped line corresponding to the 21 cm absorption system. The four excluded systems (see RTB95) are: in AO 0235+164, in 3C 196 (0809+483), in PKS 1229021, and in 3C 286 (1328+307). However, concurrent with this survey, a survey for H I 21 cm absorption in radio-loud quasars with known Mg II systems was being carried out by W. Lane and F. Briggs (see Lane et al. 1998a for some initial results). Three of the known Mg II systems observed during our HST-FOS survey have now been found to be 21 cm absorbers. These are the system towards S4 0248+43, the system towards PKS 112714, and the system towards OI 363 (0738+313) (Lane et al. 1998a; Lane et al. 2000, in preparation). The Ly line in the spectrum of S4 0248+43 was the only Ly line which did not have HST-FOS data of sufficient quality to determine if the line was damped. However, the availability of the H I 21 cm data, which shows that this line must be damped (see §2.5.2 for further details), gives our survey a certain degree of completeness since, for all observed systems which were selected in an unbiased manner, we have been able to determine whether or not they are damped. In particular, the originally-defined sample of 243 systems included Mg II systems for which no information on the H I column density was published, either from the UV Ly line or for the 21 cm line. Thus, all information obtained after the sample was assembled is acceptable, and this does not bias the results. If anything, the decision to exclude all previously known 21 cm systems might now be viewed as overly conservative. It could be argued that unwarranted exclusion of these systems might cause us to underestimate the incidence and mass density of DLA systems at low redshifts. In the future, if H I column density information becomes available for all of the Mg II systems that satisfy our selection criteria, all of the previously identified 21 cm absorbers which were excluded from the sample should be included at that time, because they would be considered free of selection bias.
Finally, we note that the DLA system towards OI 363 (0738+313), which we detected serendipitously (see §2.5.5 and Rao & Turnshek 1998), has also been detected in 21 cm absorption (Lane et al. 1998b).
2.5. Mg II Systems with Identified DLA Absorption
The QSOs with DLA detections are listed in Table 3 along with the redshift and rest equivalent width of the Mg II absorption lines, the redshift and column density of the DLA lines and their uncertainties, and the source of the Ly data. We have determined that 14 DLA lines which meet the classical criterion for being damped are present in our data set. Twelve of these are found in the 87 Mg II systems and two others were found serendipitously. Redshifts for the absorption system towards S4 024843, the and systems towards OI 363 (0738+313), and the system towards PKS 112714, which were derived from more accurate H I 21 cm data, are reported without error (Lane et al. 1998a,b). When deriving redshifts for the remaining DLA systems, we have not corrected for wavelength zero point offsets that were reported in FOS data (Rosa, Kerber, & Keys 1998, ISR CAL/FOS-149) since we did not find this necessary. For the DLA systems without 21 cm redshifts, our derived redshifts are mostly within of the Mg II redshifts. Thus, the current data are sufficient to identify any DLA lines that correspond to metal-line absorbers. Although Voigt profile fits that differed by 0.0001 in redshift are clearly distinct in fits to DLA lines, we have reported redshift uncertainties of 0.001 for data taken with the G190H and G270H gratings and 0.002 for data taken with G160L gratings, since the grating resolutions and signal-to-noise ratios do not permit more accurate wavelength determinations.
| QSO | Coordinate | Mg II | Ly | Sourcebb The Principal Investigator of the HST program and the proposal identification (PID) number are listed. | ||||
|---|---|---|---|---|---|---|---|---|
| Designation | (Å) | aa No error is reported if is taken from 21 cm absorption-line data. | cm-2 | cm-2 | ||||
| UM 366 | 0143015 | 1.613cc The two serendipitously discovered systems for which no Mg II information is available are also listed. | 0.001 | 2.0 | 0.2 | This Program (Rao, PID 6577) | ||
| S4 0248+43 | 0248+430 | 0.3939 | 1.86 | 0.3941 | 36dd From 21 cm absorption-line data and assuming K (Lane et al. 2000, in preparation). | 4dd From 21 cm absorption-line data and assuming K (Lane et al. 2000, in preparation). | This Program (Rao, PID 6577) | |
| EX 0302223 | 0302223 | 1.0096 | 1.16 | 1.010 | 0.001 | 2.3 | 0.2 | Archive (Burbidge, PID 6224) |
| PKS 0454+039 | 0454+039 | 0.8596 | 1.53 | 0.859 | 0.001 | 4.7 | 0.3 | Archive (Bergeron, PID 5351) |
| OI 363 | 0738+313 | 0.0912cc The two serendipitously discovered systems for which no Mg II information is available are also listed. | 15 | 2 | This Program (Rao, PID 6577) | |||
| 0.2213 | 0.52 | 0.2212 | 7.9 | 1.4 | This Program (Rao, PID 6577) | |||
| B2 0827+24 | 0827+243 | 0.5247 | 2.90 | 0.518 | 0.002 | 2.0 | 0.2 | This Program (Rao, PID 6577) |
| TB 0933+733 | 0933+732 | 1.4789 | 0.95 | 1.478 | 0.001 | 42 | 8 | This Program (Rao, PID 6577) |
| PKS 0952+17 | 0952+179 | 0.2377 | 0.63 | 0.239 | 0.002 | 21.0 | 2.5 | This Program (Rao, PID 6577) |
| Q 0957+561A | 0957+561A | 1.3911 | 2.12 | 1.391 | 0.001 | 2.1 | 0.5 | Archive (Burbidge, PID 5683) |
| PKS 112714 | 1127145 | 0.3130 | 2.21 | 0.3127 | 51 | 9 | This Program (Rao, PID 6577) | |
| Q 1209+107 | 1209+107 | 0.6295 | 2.92 | 0.633 | 0.002 | 2.0 | 1.0 | Archive (Bergeron, PID 5351) |
| PKS 1354+25 | 1354+258 | 1.4205 | 0.61 | 1.418 | 0.001 | 32 | 2 | This Program (Rao, PID 6577) |
| 3C 336 | 1622+239 | 0.6561 | 1.29 | 0.656 | 0.001 | 2.3 | 0.4 | Archive (Steidel, PID 5304) |
To fit the DLA lines with Voigt profiles, all of the pipeline-calibrated spectra were first linearly resampled in wavelength to 4 pixels per resolution element in order to match the quarter-diode substepping procedure used during the observations. A continuum level was fitted to each spectrum interactively and the spectrum was normalized by this continuum. In a few cases, in medium resolution gratings or in cases where the H I column density was high in a low resolution grating, we found it necessary to subtract a small correction (usually less than 10% of the continuum) before normalizing the spectrum in order to force the center of the damped line to zero flux. Similar procedures were adopted by Steidel et al. (1995) and Boissé et al. (1998) to measure the column density of DLA lines detected in FOS spectra. Possible reasons for the non-zero flux at the center of a DLA line in an FOS spectrum are scattered light within the detector and incorrect dark background subtractions during pipeline processing.
A Voigt damping profile, convolved with the appropriate Gaussian line spread function of the FOS-grating combination, was then fitted to the data. The Doppler parameter was set to km s-1 for all of the fits. Note that for the new HST-FOS observations we used the 1.0-PAIR aperture which results in the line spread function FWHM being 0.96 FOS diodes, i.e., 3.8 pixels. This corresponds to typical resolutions (FWHM) of 2.0 Å for the G270H grating, 1.5 Å for the G190H grating, and 7 Å for the G160L grating. The exact resolutions in units of Å depend on the wavelength of the damped line.
The theoretical profiles that best fit the observed damped profiles were also determined interactively. In many cases, Ly forest lines overlapped with the DLA line and care had to be taken to interactively exclude them from the fit. In addition, the fact that some of the data were fairly noisy, with typical signal-to-noise ratios of within the damped profile, made fitting a reasonable continuum near the damped line the most challenging task. Since continuum placement is also somewhat subjective, and this usually is the largest contribution to the uncertainties, conservative estimates for errors in were determined by shifting the normalized continuum above and below the most likely continuum level by an offset measured from the (per pixel) error array of the flux spectrum. The spectrum was then renormalized to the new levels and Voigt profiles were again fitted to the DLA lines in the renormalized spectra. The resulting ranges in column densities derived in this way are reported as the formal uncertainties in . To illustrate the procedure, we show examples of Voigt profile fits with high and low renormalized continua to the damped profile in B2 0827+24 (Figures 2a,b). For this spectrum, the adopted 1 continuum placement error corresponds to 11% of the continuum; thus, the “high” and “low” continuum levels were set at 1.11 and 0.89 times the best fit continuum, respectively. The Voigt profiles that best fit the data then give atoms cm-2 and atoms cm-2. Thus the column density for this system is reported as atoms cm-2 (Table 3, see also §2.5.7). We have found that the uncertainties in column densities are generally on the order of 10%; data noisier than that for B2 0827+24 usually result in larger uncertainties while higher signal-to-noise ratio data usually result in lower uncertainties.
Details of the results for each of the 14 identified DLA systems are given below. In cases where a fit to the DLA profile is made, the resulting redshift is reported to four decimal places. However, as noted above, the accuracy is more realistically 0.001 for determinations made with the medium-resolution gratings and 0.002 for the low-resolution gratings. H I 21 cm absorption redshifts are adopted when possible.
2.5.1 The UM 366 (0143015) DLA Line
No known Mg II system was reported in the literature at this redshift, but we discovered a DLA line at serendipitously in our G270H spectrum. We observed this QSO as part of the survey because it has two Mg II absorption-line systems at and (neither is damped). Although no Mg II information is available for the system, Sargent, Steidel, & Boksenberg (1989) did detect Fe II at this redshift. Eight percent of the continuum had to be subtracted prior to fitting the profile in order to force the spectrum to have zero flux at the DLA line center. Figure 3 shows the normalized spectrum in the vicinity of the DLA line and the best-fit Voigt profile with and atoms cm-2 overlaid.
2.5.2 The S4 024843 DLA Line
We obtained an FOS-G160L spectrum of this object to study the Ly lines of Mg II systems at and . The Ly line of the system is not damped. However, the signal-to-noise ratio in our FOS spectrum at the position of Ly in the system is very poor, and the nature of this Ly line could not be determined. The FOS spectrum is shown in Figure 4. However, as mentioned in §2.4, this system was convincingly found to exhibit H I 21 cm absorption in the radio continuum of the background quasar (Lane et al. 2000, in preparation). Three narrow components near are present. They are clustered within a 40 km s-1 velocity interval and have optical depths between 15 and 20%. Assuming that the 21 cm lines are optically thin, their strengths suggest that the total column density is atoms cm-2 K-1 (Lane et al. 2000, in preparation). For a spin temperature of K, which is generally found to be the case (Lane et al. 2000, in preparation), the resulting column density is atoms cm-2. It is unfortunate that the spin temperature had to be assumed for the determination. This DLA line should be reobserved in the UV so that data on the DLA profile can be used to determine independently.
2.5.3 The EX 0302223 DLA Line
This system was taken from the archives. Originally, it was chosen as a target for observation without knowledge of the fact that its spectrum contains a DLA absorption line. It has been studied by Pettini & Bowen (1997) and Boissé et al. (1998). A portion of the FOS-G270H normalized spectrum, overlaid with our best-fit DLA profile, is shown in Figure 5. Defining the level of the continuum between Å was problematic in making the fit because of the underlying O VI/Ly emission line from the QSO. However, the core and short-wavelength wing of the DLA profile fit the data well. We derive a redshift of and a column density of atoms cm-2, in agreement with the values derived by Pettini & Bowen (1997) and Boissé et al. (1998).
2.5.4 The PKS 0454+039 DLA Line
This system was also taken from the archives. Again, it was chosen as a target for observation without knowledge of the fact that its spectrum contains a DLA absorption line. It has been studied by Steidel et al. (1995). The normalized FOS-G190H spectrum in the vicinity of the DLA line, with our best-fit Voigt profile overlaid, is shown in Figure 6. We derive atoms cm-2 at redshift with an 6% error in . Steidel et al. (1995) derived atoms cm-2 with an error of 5%. Our smaller value for results from the exclusion of the 2268 Å absorption feature (a likely Ly forest line) from the fit, and agrees with the value which was derived by Boissé et al. (1998).
2.5.5 The OI 363 (0738+313) DLA Line
We obtained an FOS-G160L spectrum of this object to study the Ly line in the Mg II system of OI 363 (0738+313) (see §2.5.6) and found the DLA system at serendipitously. Since this is presently the lowest-redshift confirmed classical DLA system known, we published the result in a separate contribution (Rao & Turnshek 1998) and the details of this system are given there. The normalized spectrum and best-fit Voigt profile with redshift and atoms cm-2 are shown in Figure 7. This system has also been found to have 21 cm absorption (Lane et al. 1998b).
2.5.6 The OI 363 (0738+313) DLA Line
The predicted position of the Ly line in the system of OI 363 (0738+313) was observed as part of our survey. This system is also found to be damped. It is the second lowest-redshift confirmed classical DLA system known. The details of this system appeared in Rao & Turnshek (1998). The normalized spectrum and best-fit Voigt profile with redshift and atoms cm-2 are shown in Figure 8. This system has also been found to have 21 cm absorption (Lane et al. 1998a).
2.5.7 The B2 082724 DLA Line
We obtained an FOS-G160L spectrum of this object to study the Ly line of the Mg II system at . Figure 9 shows the normalized spectrum in the vicinity of the DLA line and the best-fit Voigt profile with column density atoms cm-2 and redshift . At column densities this low, it is important to properly take into account the convolution of the Voigt damping profile with the low-resolution G160L line spread function. For this spectrum, we did not consider the possibility of subtracting a fraction of the continuum to force the flux at the center of the DLA line to zero because, based on the convolution of the damping profile with the line spread function, some flux at line center is expected. The discrepancy between our redshift and the Ulrich & Owen (1977) Mg II redshift is somewhat puzzling. We suspect that either the zero point wavelength correction for our G160L spectrum (which we ignored) was atypically large, or there was a wavelength calibration problem in the original Mg II data.
2.5.8 The TB 0933733 DLA Line
According to SS92, two Mg II systems are present in this object at and . We attempted to investigate Ly in both of them by obtaining an FOS-G270H spectrum at the expected wavelengths of Ly. Fortunately, the expected positions of the Ly and Ly absorption lines were also covered. The spectrum shows a partial Lyman limit at 3060 Å (), which sets in just to the long-wavelength side of the expected positions of the two Ly lines at 3013 Å () and 3036 Å (). The spectrum of this object is shown in Figure 10, with the positions of the first three Lyman series lines of both systems marked. The system marked with subscript ‘1’ corresponds to , while the one marked with subscript ‘2’ corresponds to . Note that the strong absorption feature at 2770 Å is a blend of Ly lines and is not damped.
Based on the appearance of the spectrum near Ly at Å, at least one of the Ly lines in the Mg II systems at and appears to be damped, although the interpretation is confused by the Lyman limit system near . The determination of which of these systems is damped is better resolved with the higher order Lyman lines, particularly Ly. A normalized spectrum in the vicinity of the damped Ly line, and its best-fit Voigt profile with and atoms cm-2 overlaid, is shown in Figure 11. We estimate the uncertainty in the derived column density to be %; the high uncertainty reflects the low signal-to-noise ratio near the Ly line. The same redshift and column density are consistent with the absorption line at the position of Ly. The Ly line corresponding to the system is not damped.
Another interesting feature in this spectrum is the broad absorption depression between Å and Å. However, this object is not a BAL QSO (Afanasev et al. 1990; SS92). The absorption complex includes both Ly lines at and . Assuming that the entire absorption complex is due to Ly, then these wavelengths correspond to the redshift range . If interpreted as a Hubble flow, this corresponds to Mpc along the line-of-sight (). The extent of the absorption is similar to what is seen in the spectra of the QSOs TOLOLO 1037-27 and 1038-27 (Jakobsen et al. 1986; Sargent & Steidel 1987; Jakobsen & Perryman 1992), which is speculated to be absorbing material distributed on a supercluster size scale. However, high-ionization metal-line absorption (e.g. C IV) is present in the TOLOLO pair, but this does not appear to be the case here. Unfortunately, given the proximity of the DLA line () and the Lyman limit edge at , a corresponding broad feature at the predicted wavelengths of Ly between cannot be searched for to resolve the situation. On the other hand, if the Å feature is primarily due to Ly , and the two Ly lines just happen to lie within this complex of absorption lines, then the feature would extend between and it would have an extent of Mpc ().
2.5.9 The PKS 095217 DLA Line
We obtained an FOS-G160L spectrum near the expected position of Ly in the PKS 0952+17 Mg II system and find it to be damped. The normalized spectrum and our best-fit Voigt profile are shown in Figure 12. The fitting procedure yields atoms cm-2 at . Eleven percent of the continuum level had to be subtracted from the spectrum prior to the fit in order to force the line center flux to zero.
There are two other absorption lines (most likely Ly ) on each side of the DLA line, which is suggestive of clustering on a wide velocity scale. If the Mg II absorber lies within a structure that includes these systems, this group would be an example of absorbing material on a size-scale which exceeds a supercluster. Interpreting the velocity interval as part of the Hubble flow would suggest that it extends 92 Mpc along the line-of-sight (). Given the signal-to-noise ratio of the current data and the possibility of a clustering of lines, we believe that it is important to reobserve this Ly line with improved signal-to-noise ratio and resolution. For example, if improved data show that this system is simply a unique blend of many weak lines which resembles a DLA line (we consider this possibility unlikely), it would eliminate the third lowest redshift DLA system from our statistical sample. Moreover, it has a moderately large column density, and thus plays an important role in our determination of at low redshift (§4.3). Note that this absorber is not detected in absorption at 21 cm (Lane et al. 2000, in preparation); however, it would not be unique in this respect since other DLA lines in radio-loud quasars have gone undetected in 21 cm absorption (e.g. Briggs & Wolfe 1983).
2.5.10 The Q0957+561A DLA Line
In RTB95 we used IUE archival spectra to discount the Mg II system in this two-component gravitational lens as having a classical DLA line. Turnshek & Bohlin (1993) measured its column density using a co-addition of many low-resolution IUE spectra and obtained atoms cm-2. However, with the higher-resolution HST-FOS-G270H spectra now available for each component, we have remeasured the H I column density of this system by fitting a Voigt profile to the DLA lines in each component of the lens. The system in component B has atoms cm-2 and thus, would not enter into our sample. However, we derive a column density of atoms cm-2 for the system in component A, so it does enter into our sample, providing gravitational lensing does not produce a bias (see below). (Note that if the system in component A and component B had both met the minimum column density criterion, this would only have been counted as one system.) In performing the fits, we had to account for the Ly emission line from the QSO since it overlaps the long-wavelength wing of the DLA line. Part of the normalized spectrum of component A is shown in Figure 13 along with the best-fit DLA profile. Prior to normalizing the spectrum fit, we had to subtract 2.4% of the continuum level from the spectrum to force the center of the DLA to have zero flux. The DLA line and the emission lines, Ly and N V, were fitted simultaneously. The emission lines were fitted with the sum of four Gaussians added on to a continuum level of unity; the sum was then attenuated by a Voigt profile at the position of the DLA line. Each Gaussian profile was specified using three parameters: wavelength, amplitude, and FWHM. The number of parameters in the fit is large, and the best-fit parameters for the emission line profiles are not unique. Therefore, we ran a number of fits to span a reasonable range of emission-line parameters and determined the best-fit Voigt profile for each case after convolving the spectrum with a Gaussian whose FWHM is given by the resolution of the G270H grating. As shown in Figure 14, a column density atoms cm-2 was clearly too low while atoms cm-2 was too high, with atoms cm-2 being the best fit. Thus, in Table 3 we report the column density as atoms cm-2 at absorption redshift . Small variations in the emission line parameters had little affect on the column density determination. In fact, inclusion of the fourth Gaussian at 2951 Å, which was necessary to obtain a better fit to the emission line profile, had no affect on the column density determination because its relative amplitude was low and its wavelength was far removed from the DLA line. Our results are in agreement with the measurements of Zuo et al. (1997) who derive atoms cm-2 for component A.
One should be careful when selecting a gravitationally lensed QSO for inclusion in a DLA absorption-line survey which makes use of a magnitude limited sample of QSOs. This is because magnification of gravitationally lensed QSOs might introduce them into samples that they would not have otherwise entered. We discuss this further in §6.2.2 (see also Smette, Claeskens, & Surdej 1997). Our survey is susceptible to this bias for two reasons: (1) the archival part of the survey included data taken with the IUE which could observe only the brightest QSOs and (2) our HST-FOS observations were chosen to maximize the signal-to-noise ratio in one HST orbit (see Figure 1). Thus, we must exclude any gravitationally lensed QSO if it is determined that it would not have been observed with either of these instruments had it not been lensed. Lensing models show that component A () has been magnified by a factor of 5.2 (Chae 1999), i.e., the unlensed QSO has a magnitude of 18.8. However, since Figure 1 shows that a QSO of magnitude 18.8 with an absorption system at would still have been included as a target for observation with HST, we have retained this system in our sample.
2.5.11 The PKS 112714 DLA Line
We obtained an FOS-G160L spectrum of this quasar to study the Ly line of the Mg II system and found that the Ly line is damped. Figure 15 shows the normalized spectrum in the vicinity of the DLA line and the best-fit Voigt profile with column density atoms cm-2 and redshift . Four percent of the continuum level was subtracted from the spectrum before the fit to force the DLA line center to have zero flux. This system is a 21 cm absorber (Lane et al. 1998a).
2.5.12 The Q1209+107 DLA Line
This system was taken from the archives. It was one of the six new Mg II systems added to the archives after the initial study of RTB95. Originally, it was chosen as a target for observation without knowledge of the fact that its spectrum contains a DLA absorption line. A portion of the normalized FOS-G160L spectrum of this object, with the best-fit Voigt profile overlaid, is shown in Figure 16. The poor signal-to-noise ratio () near the position of the DLA line ( 1975 Å) leads to a rather large (50%) uncertainty in the measured column density (Table 3). We derive atoms cm-2 at . This result is consistent with that of Boissé et al. (1998).
2.5.13 The PKS 1354+25 DLA Line
We obtained an FOS-G270H spectrum of this quasar to study the Ly line of the Mg II system and found that the Ly line is damped. Figure 17 shows the normalized spectrum in the vicinity of the DLA line and the best-fit Voigt profile with column density atoms cm-2 and redshift . Four percent of the continuum level was subtracted from the spectrum before the fit to force the DLA line center to have zero flux.
2.5.14 The 3C 336 (1622+239) DLA Line
This system was taken from the archives. Steidel et al. (1997) studied the absorption-line systems toward this quasar in considerable detail. However, originally it was chosen as a target for observation without knowledge of the fact that its spectrum contains a DLA absorption-line. A portion of the normalized FOS-G190H spectrum of this object and our best-fit Voigt profile is shown in Figure 18. We derive and atoms cm-2 for the DLA system. This is consistent with the result found by Steidel et al. (1997) to within our quoted error (Table 3).
2.6. The PG 0117+213 System
As noted in §2.2, the recalibrated HST-FOS spectropolarimetric data on PG 0117213 has been added to the archival portion of our sample since it covers the predicted wavelength of Ly in the Mg II system. The data were kindly provided to us by A. Koratkar. The spectrum is shown in Figure 19. We find that the strong absorption feature at 1920 Å, which appears as a candidate DLA line in figure 3 of Koratkar et al. (1998), is more convincingly fitted with a blend of 9 Gaussian components. A Voigt damping profile with column density atoms cm-2 is overplotted to illustrate that a single damping profile is a poor fit to this complex of absorption. Therefore, we have discounted it as a DLA line. In this system, the Ly absorption line which corresponds to the published Mg II absorption redshift lies at 1917 Å. It is the strongest line in the complex blend of absorption lines. This blended feature is evidently another example of correlated structure on a large (supercluster) scale. Assuming a cosmological Hubble flow, the components at the two extremes of the blend would be separated by Mpc () along the line-of-sight.


3. Statistical Properties of the Mg II Sample
Table 4 lists the results on the detection of DLA in the 87 Mg II systems which make up our low-redshift sample. We call this sample the RT sample to distinguish it from the SS92 Mg II sample. Column 1 of Table 4 gives the QSO’s 1950 coordinate designation; column 2 gives the absorption redshift; columns give the available rest equivalent widths (or upper limits) of the Mg II , Mg II , Mg I , and Fe II absorption lines, respectively; column 7 gives the references for the absorption-line data; and column 8 gives the column density of the classical DLA absorption line if present in the system.
In RTB95, we discussed the rationale behind using a sample of Mg II systems with a boot-strapping method to determine the statistical properties of low-redshift DLA systems. Inherent in this method is the reliance on the empirically determined statistical properties of Mg II systems by SS92 and the assumption that the Mg II samples of SS92 and RT represent the same parent population of absorbers for Å. Therefore, to justify the results which we present in §4, we discuss the statistical properties of the SS92 and RT samples and show that they are equivalent (§3.1). We also discuss the properties of classical DLA absorbers in the RT sample and show that they are primarily drawn from the population of Mg II absorbers with Å (also §3.1). We consider the possible presence of trends between the existence of classical DLA absorption and: (1) the Mg II absorption-line doublet ratio (§3.1.1), (2) Fe II absorption (§3.1.2), (3) and Mg I absorption (§3.1.3). Finally, we derive the effective redshift path covered in our survey (§3.2).
3.1. The Mg II Rest Equivalent Width Distribution
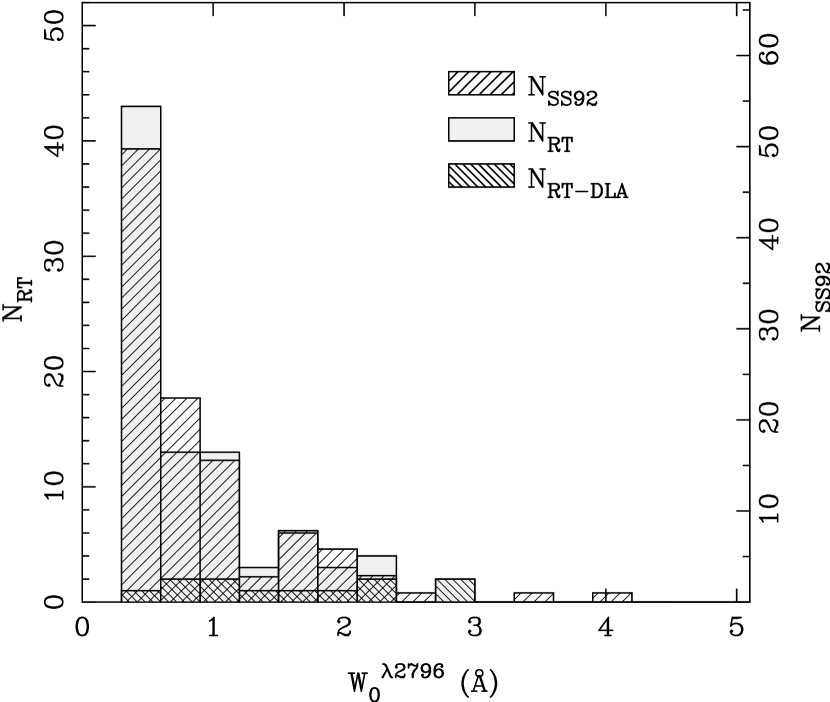
Figure 20 shows the Mg II rest equivalent width () distributions for the SS92 sample (), the RT sample (), and the DLA subsample of the RT sample (). The SS92 Mg II data have been scaled to the RT Mg II data. It is clear that the SS92 and RT distributions are very similar; this is demonstrated more rigorously below. It is also striking that while 43 of the 87 RT systems have Å, only one of the 12 DLA systems falls in this interval. The remaining 11 DLA systems have Å. Therefore, the probability of finding a DLA system in a Mg II sample with Å is 12/87 13.8%, but the probability becomes 11/44 25.0% if the threshold is increased to Å.
The normalized cumulative distribution functions for the three above samples (SS92, RT, and RT-DLA) are shown in Figures 21 and 22 for the Å and Å thresholds, respectively. The maximum deviations between these distributions have been used in a Kolmogorov-Smirnov (KS) test to determine the probability that any two of the samples are drawn from the same parent population. The results of the KS tests are given in Table 5. The SS92 and RT samples are completely consistent with being drawn from the same parent population of absorbers for Å; and the samples are nearly identical for Å. This validates our assumption that the statistical properties of the SS92 Mg II sample are applicable to the RT Mg II sample. On the other hand, the KS statistic shows that there is only a 2% probability that the RT-DLA subsample is drawn from the same parent population as the Å RT sample, however the probability increases to 36% for the Å RT sample. Aside from this threshold correlation (the tendency for atoms cm-2 systems to be present when Å), Figure 23 shows that there is no further trend between and above these thresholds. Nevertheless, we suspect that this threshold correlation is revealing something fundamental about the absorbers that give rise to classical DLA absorption-line systems.
Ionization equilibrium studies have shown that QSO absorbers must be optically thick at the Lyman limit ( atoms cm-2) for appreciable amounts of Mg+ to be present (Bergeron & Stasińska 1986). This is because Mg+ will only survive the presence of a strong background radiation field if it is embedded in an optically thick H I cloud which will shield it from the ionizing radiation. This prediction has been verified since it has also been empirically shown that Mg II and Lyman limit systems arise in the same population of absorbers (SS92 and references therein). Thus, it is understood that atoms cm-2 is generally necessary for the detection of a Mg II system111However, this may not be true for the population of weak Mg II absorbers with Å (Churchill et al. 1999a).. Our above empirical analysis suggests that, in addition, Å is almost always necessary (but not sufficient) to have atoms cm-2. Why should this be the case? Before we discuss this (§3.1.4), we wish to note the empirical results from several other comparisons which we have considered in an attempt to understand the nature of the DLA population.
3.1.1 The Mg II Doublet Ratio and DLA Absorption
Figure 24 is a plot of the Mg II doublet ratio, /, versus for the RT sample. The DLA systems from the RT sample are marked with open squares. We have also plotted measurements from the literature for the four 21 cm absorbers that we excluded from our unbiased Mg II sample (§2.4). Although we have not included these previously known 21 cm absorbers in the statistical analysis of low-redshift DLA systems, their properties may be relevant for assessing the nature of the low-redshift DLA population. The horizontal dashed line in the figure has /; all of the DLA systems have Mg II doublet ratios that fall below this line indicating that their Mg II lines lie somewhat close to the saturated part of the curve of growth. However, the Mg II doublet ratio exceeds 1.5 about 30% of the time in non-DLA systems.
3.1.2 Mg II versus Fe II and DLA Absorption
Bergeron & Stasińska (1986) used photoionization models to show that Mg II systems with strong Fe II absorption have H I column densities in excess of a few times atoms cm-2. Le Brun et al. (1997), in their search for DLA galaxies, used the criterion / as a predictor of DLA in an absorption-line system.


| QSO | (Å) | (Å) | (Å) | (Å) | References | ||
|---|---|---|---|---|---|---|---|
| Mg II | Mg II | Mg II | Mg I | Fe II | atoms cm-2 | ||
| 0002422 | 1.5413 | 0.48 | 0.32 | 0.3 | 0.1 | 1 | |
| 0002+051 | 0.8516 | 0.92 | 0.84 | 0.16 | 2 | ||
| 0058+019 | 0.6128 | 1.70 | 1.51 | 0.35 | 1.39 | 3 | |
| 0117+213 | 0.5761 | 0.91 | 0.93 | 0.23 | 0.88 | 2 | |
| 1.0473 | 0.47 | 0.26 | 0.2 | 0.1 | 2 | ||
| 0119046 | 0.6577 | 0.30 | 0.22 | 0.1 | 0.1 | 4 | |
| 0141+339 | 0.4709 | 0.78 | 0.65 | 0.3 | 0.7 | 2 | |
| 0143015 | 1.0383 | 0.64 | 0.53 | 0.1 | 0.1 | 5 | |
| 1.2853 | 0.56 | 0.33 | 0.1 | 0.1 | 5 | ||
| 0150202 | 0.7800 | 0.36 | 0.21 | 0.3 | 3 | ||
| 0151+045 | 0.1602 | 1.55 | 1.55 | 0.5 | 0.5 | 6 | |
| 0215+015 | 1.3447 | 1.93 | 1.64 | 0.32 | 1.36 | 7 | |
| 0248+430 | 0.3939 | 1.86 | 1.42 | 0.70 | 1.03 | 2 | 51 |
| 0.4515 | 0.34 | 0.29 | 0.5 | 0.1 | 8 | ||
| 0302223 | 1.0096 | 1.16 | 0.96 | 0.18 | 0.63 | 9 | 2.3 |
| 0333+321 | 0.9531 | 0.47 | 0.33 | 0.3 | 0.2 | 2 | |
| 0421+019 | 1.3918 | 0.35 | 0.31 | 0.3 | 0.1 | 2 | |
| 1.6380 | 0.35 | 0.28 | 0.2 | 0.4 | 2 | ||
| 0424131 | 1.4080 | 0.55 | 0.35 | 0.3 | 0.44 | 2 | |
| 1.5623 | 0.38 | 0.39 | 0.2 | 0.2 | 2 | ||
| 0454220 | 0.4744 | 1.44 | 1.31 | 0.35 | 0.97 | 10 | |
| 0.4834 | 0.45 | 0.27 | 0.09 | 0.16 | 10 | ||
| 0454+039 | 0.8596 | 1.53 | 1.40 | 0.37 | 1.11 | 2 | 4.7 |
| 1.1538 | 0.57 | 0.36 | 0.2 | 0.1 | 2 | ||
| 0710+119 | 0.4629 | 0.62 | 0.29 | 0.24 | 0.4 | 11 | |
| 0735+178 | 0.4240 | 1.32 | 1.03 | 0.18 | 0.87 | 12 | |
| 0738+313 | 0.2213 | 0.52 | 0.50 | 0.2 | 0.6 | 13 | 7.9 |
| 0742+318 | 0.1920 | 0.33 | 0.23 | 0.2 | 13 | ||
| 0823223 | 0.9103 | 1.15 | 0.68 | 0.4 | 14 | ||
| 0827+243 | 0.5247 | 2.90 | 2.20 | 1.90 | 15,16 | 2.0 | |
| 0843+136 | 0.6064 | 1.08 | 0.67 | 0.1 | 0.7 | 17 | |
| 0933+732 | 1.4789 | 0.95 | 1.15 | 0.3 | 0.76 | 2 | 42 |
| 1.4973 | 1.71 | 1.98 | 0.67 | 1.15 | 2 | ||
| 0952+179 | 0.2377 | 0.63 | 0.79 | 0.4 | 2 | 21 | |
| 0957+561A | 1.3911 | 2.12 | 1.81 | 0.19 | 1.67 | 18,19,20 | 2.1 |
| 0958+551 | 0.2413 | 0.55 | 0.38 | 0.2 | 3 | ||
| 1035276 | 0.8242 | 1.08 | 0.87 | 0.6 | 0.52 | 21 | |
| 1038+064 | 0.4416 | 0.66 | 0.57 | 0.2 | 0.2 | 2 | |
| 1040+123 | 0.6591 | 0.58 | 0.42 | 0.2 | 0.2 | 11 | |
| 1049+616 | 0.2255 | 0.51 | 0.56 | 0.1 | 0.4 | 13 | |
| 0.3937 | 0.34 | 0.29 | 0.1 | 13 | |||
| 1100264 | 1.1872 | 0.51 | 0.28 | 0.2 | 0.2 | 9 | |
| 1.2028 | 0.54 | 0.43 | 0.27 | 0.2 | 9,22 | ||
| 1115+080 | 1.0431 | 0.31 | 0.18 | 0.2 | 0.1 | 2 | |
| 1127145 | 0.3130 | 2.21 | 1.90 | 1.14 | 1.14 | 23 | 51 |
| 1137+660 | 0.1164 | 0.50 | 0.53 | 0.2 | 0.2 | 24 | |
| 1148+386 | 0.2130 | 0.96 | 0.37 | 0.3 | 13 | ||
| 0.5533 | 0.92 | 0.99 | 0.2 | 0.2 | 2 | ||
| 1206+459 | 0.9277 | 1.00 | 0.79 | 0.2 | 0.1 | 2 | |
| 1209+107 | 0.3930 | 1.00 | 0.54 | 0.2 | 0.4 | 25 | |
| 0.6295 | 2.92 | 2.05 | 0.4 | 1.50 | 25 | 2.0 | |
| 1213002 | 1.5543 | 2.09 | 1.65 | 0.2 | 1.11 | 2 | |
| 1222+228 | 0.6681 | 0.43 | 0.41 | 0.1 | 0.1 | 3 | |
| 1229021 | 0.7571 | 0.52 | 0.48 | 0.1 | 11 | ||
| 1241+176 | 0.5506 | 0.48 | 0.37 | 0.2 | 0.2 | 2 | |
| 1246057 | 1.2015 | 0.90 | 0.75 | 0.4 | 0.40 | 2 | |
| 1.6453 | 0.52 | 0.58 | 0.3 | 0.38 | 2 | ||
| 1247+267 | 1.2232 | 0.48 | 0.38 | 0.11 | 2 | ||
| 1248+401 | 0.7729 | 0.76 | 0.50 | 0.4 | 0.32 | 2 | |
| 1254+047 | 0.5193 | 0.46 | 0.38 | 0.2 | 0.40 | 2 | |
| 1317+277 | 0.2887 | 0.33 | 0.31 | 0.2 | 2 | ||
| 0.6596 | 0.49 | 0.33 | 0.2 | 0.17 | 2 | ||
| 1323+655 | 1.5181 | 0.57 | 0.53 | 0.1 | 26 | ||
| 1.6101 | 2.20 | 1.85 | 0.16 | 0.88 | 26 | ||
| 1327206 | 0.8526 | 2.11 | 1.48 | 0.4 | 0.76 | 27,28 | |
| 1329+412 | 1.2820 | 0.49 | 0.31 | 0.3 | 2 | ||
| 1.6011 | 0.70 | 0.35 | 0.2 | 0.2 | 2 | ||
| 1331+170 | 1.3284 | 1.73 | 1.14 | 0.1 | 0.32 | 2 | |
| 1338+416 | 0.6213 | 0.31 | 0.17 | 0.3 | 0.1 | 2 | |
| 1354+195 | 0.4563 | 0.89 | 0.82 | 0.16 | 0.32 | 2 | |
| 1354+258 | 0.8585 | 1.00 | 0.86 | 0.1 | 0.2 | 26 | |
| 0.8856 | 0.81bb The rest equivalent widths quoted in reference (26) are in error. | 0.57bb The rest equivalent widths quoted in reference (26) are in error. | 0.2 | 0.2 | 26 | ||
| 1.4205 | 0.61 | 0.50 | 0.20 | 0.55 | 26 | 32 | |
| 1421+330 | 1.1725 | 0.53 | 0.40 | 0.1 | 0.1 | 2 | |
| 1517+239 | 0.7382 | 0.30 | 0.34 | 0.1 | 3 | ||
| 1622+239 | 0.6561 | 1.29 | 1.69 | 0.4 | 1.13 | 2 | 2.3 |
| 0.8914 | 1.55 | 1.27 | 0.3 | 1.32 | 2 | ||
| 1623+269 | 0.8881 | 0.93 | 0.75 | 0.14 | 0.21 | 3 | |
| 1634+706 | 0.9903 | 0.58 | 0.42 | 0.2 | 0.1 | 2 | |
| 1704+608 | 0.1634 | 0.59 | 0.52 | 0.5 | 0.2 | 13 | |
| 0.2220 | 0.55 | 0.33 | 0.2 | 13 | |||
| 1821+107 | 1.2528 | 0.71 | 0.48 | 0.09 | 0.3 | 2 | |
| 1901+319 | 0.3901 | 0.45 | 0.15 | 0.1 | 11 | ||
| 2128123 | 0.4299 | 0.41 | 0.37 | 0.10 | 0.27 | 9 | |
| 2145+067 | 0.7906 | 0.52 | 0.41 | 0.2 | 0.1 | 2 | |
| 2223052 | 0.8472 | 0.65 | 0.42 | 0.2 | 0.4 | 29,30 | |
| 2326477 | 1.2610 | 0.50 | 0.38 | 0.1 | 0.1 | 9 |
References. — (1) Lanzetta, Turnshek, & Wolfe 1987, (2) SS92, (3) Sargent, Boksenberg, & Steidel 1988, (4) Sargent, Young, & Boksenberg 1982, (5) Sargent, Steidel, & Boksenberg 1989, (6) Bergeron et al. 1988, (7) Bergeron & D’Odorico 1986, (8) Womble et al. 1990, (9) Petitjean & Bergeron 1990, (10) Tytler et al. 1987, (11) Aldcroft, Bechtold, & Elvis 1994, (12) Boksenberg, Carswell, & Sargent 1979, (13) Boissé et al. 1992, (14) Falomo 1990, (15) Wills 1978, (16) Ulrich & Owen 1977, (17) Foltz et al. 1986, (18) Weymann et al. 1979, (19) Caulet 1989, (20) Wills & Wills 1980, (21) Dinshaw & Impey 1996, (22) Boissé & Bergeron 1985, (23) Bergeron & Boissé 1991, (24) Bahcall et al. 1993, (25) Young, Sargent, & Boksenberg 1982, (26) Barthel, Tytler, & Thomson 1990, (27) Kunth & Bergeron 1984, (28) Bergeron, D’Odorico, & Kunth 1987, (29) Le Brun et al. 1993, (30) Miller & French 1978.
| Samples | Å | Å |
|---|---|---|
| RT & SS92 | 0.65 | 0.83 |
| SS92 & RT-DLA | 0.01 | 0.15 |
| RT & RT-DLA | 0.02 | 0.36 |


We have used the Mg II systems in the RT sample with measurements to further test this. Figure 25 shows versus for systems for which Fe II equivalent width measurements are available in the literature, or for which we were able to derive upper limits from published spectra (see Table 4). As in Figure 24, the DLA systems in the RT sample are marked with squares and the 21 cm absorbers which are not part of the RT sample are marked with circles. The horizontal and vertical dashed lines identify the region in the versus plane for which Å and Å. Reliable equivalent widths are available in the literature for 24 out of 27 of these systems, where detections of Fe II usually exceed the level of significance. Several results of interest emerge from this plot. First, there is a linear correlation between and . If we force a least squares fit to the 24 data points to pass through the origin, we obtain . The correlation between Mg II and Fe II in high-redshift, predominantly low-excitation, absorption-line systems was noted by Bergeron & Stasińska (1986). They found that a strong Mg II system with Å was invariably accompanied by strong Fe II absorption. Second, excluding upper limits, 10 of the 21 systems in the RT sample ( 48%) with Å and Å are DLA systems. Third, the non-DLA systems in this regime all have H I column densities atoms cm-2. Fourth, with the exception of the known 21 cm absorber towards 3C 286 which has unusually low metal-line equivalent widths ( Å and Å, Cohen et al. 1994), all of the DLA systems lie in the upper-right region of the plot where Å and Å. In the future, these results can be used to further improve the selection criteria for searching for DLA. In particular, there is approximately a 50% probability of finding a classical DLA system in metal-line systems with Å and Å.
3.1.3 Mg II versus Mg I and DLA Absorption
Figure 26 shows versus . It can be seen that the DLA systems do not lie in a special region in the Mg II versus Mg I rest equivalent width plane. Evidently the presence of DLA does not guarantee the presence of detectable Mg I in medium resolution spectroscopic surveys. However, although the statistics are small, all systems with Å have DLA.
3.1.4 Discussion
The Mg II absorption lines under study in these samples usually have Mg+ column densities which place them on or near the saturated regime on a curve-of-growth plot. The DLA systems generally appear to exhibit somewhat greater saturation. In either case, is a poor indicator of Mg II column density, and a better indicator of the number of clouds along the sight-line and their kinematic spread in velocity (e.g. Petitjean & Bergeron 1990, SS92, Churchill 1997). Thus, our results indicate that the low-redshift DLA systems predominantly arise along sight-lines in which the number of clouds and their spread in velocity is systematically larger in comparison to the Å systems. The velocity spread, i.e., the difference between the minimum velocity and maximum velocity components, must be km s-1, since a Mg II 2796 absorption line which is completely black over the line profile must be spread over a km s-1 interval to produce a line with Å. Empirically, since we find that the Mg II lines are not necessarily completely black, the velocity spread must typically exceed this value. However, observations in the H I 21 cm absorption line of DLA systems usually show that the components which give rise to the Voigt damping profile are spread over a much smaller velocity interval, which indicates that only a small fraction of the clouds contributing to give rise to the DLA line.
Other interesting correlations which pertain to high column density systems (but not necessarily DLA systems) have been identified by Churchill et al. (1999b) using high-resolution (6 km s-1) Keck observations of Mg II systems. (High-resolution data are not generally available for our systems.) In their figure 2b Churchill et al. (1999b) plot versus , where is a velocity weighted optical depth which is sensitive to high-velocity “outlier” clouds with small rest equivalent widths. The systems with cm-2 in this plot (i.e. neutral-hydrogen-rich systems), which include all of the systems in Figure 25 with Å and Å and of which the DLA systems form a subset, are isolated and occupy the top-central region of this plane, i.e., they have Å and intermediate values of . Figure 2a of Churchill et al. (1999b) shows that these neutral-hydrogen-rich systems lie in an isolated region of the Mg II versus C IV plane, corresponding to smaller / ratios. Lastly, figure 3b from Churchill et al. (1999b) shows that for the few cases in which the absorbing galaxies have been identified, the impact parameters are among the smallest observed. These are evidently positive correlations for neutral-hydrogen-rich systems that may also hold for classically damped systems.
If we consider these pieces of information together, the picture that emerges suggests that the metal-line absorption components associated with a DLA system, which generally correspond to components other than those which give rise to the DLA line itself, are systematically different in several ways: (1) There is a relatively large number of absorbing components spread over a substantial velocity interval (to produce Å), but for a fixed the absorbing components making up the associated metal-line system will be more closely spaced in comparison to cases where DLA is not present. This is suggestive of a clustering of clouds in the vicinity of the cloud that gives rise to the DLA line itself. (2) The C IV /Mg II metal-line ratio is relatively small and the Fe II /Mg II metal-line ratio is relatively high, signifying a lower ionization phase of the DLA absorbing region. (3) The transverse separation (impact parameter) from the sight-line for any identified DLA absorbing galaxy is relatively small in comparison to systems which do not have a DLA line. This qualitative description of the kinematic and ionization structure of DLA systems and the associated absorbing galaxies appears to be roughly consistent with the observations, and should be incorporated into any successful model describing the nature of DLA absorbers.
3.2. The Effective Redshift Path of the RT Survey,
In conventional surveys, like the SS92 Mg II survey, searches for absorption lines are carried out by observing the continuum regions of an unbiased sample of QSOs down to some minimum equivalent width threshold over the total redshift path of the survey. We use the parameter to represent the total redshift path covered down to absorption-line rest equivalent width, , at mean redshift, . The parameter is computed by adding all of the individual redshift intervals covered by all survey spectra with data good enough to detect at the level of significance. This can also be expressed as the integral of the redshift path density, , over redshift,
| (1) |
Descriptions of these standard techniques have been given by WTSC86, Lanzetta, Turnshek, & Wolfe (1987), SS92, and others. However, the RT survey is not a conventional survey that samples redshifts paths along random sight lines. We search for DLA lines at specific redshifts along predetermined sight lines. Nevertheless, we do have indirect information which allows us to infer an effective total redshift path for Mg II covered in the RT survey, , at mean redshift, . Note that this is also the redshift path for the detection of DLA lines.
To determine , we need to determine the effective redshift path density of the RT survey, . In turn, can be written as
| (2) |
where is the redshift distribution of Mg II systems in the RT sample and is the number of Mg II systems per unit redshift as a function of redshift. The distributions for = 0.3 Å and 0.6 Å are shown in Figure 27. The redshift evolution of the number density of Mg II systems can be parameterized by
| (3) |
where and are obtained from Table 4 of SS92. These values are [which implies ], [which implies ], , and . The results of equation (2) for Å and 0.6 Å are shown in Figure 28. For comparison, SS92 show in their figure 4 the number of sight-lines for these same values of ; this is equivalent to redshift path density.


Using equation (1), the effective redshift path for the RT survey is found to be with mean redshift and 87 systems, and with the same mean redshift and 44 systems. To confirm these results we have verified that the detected number of Mg II absorption-line systems is given by
| (4) |
where and . For comparison, we give the number of systems, mean redshifts, and redshift paths of the RT and SS92 samples in Table 6. The fact that SS92 were able to study 28% more systems than in the RT survey over a redshift path length that was only 9% larger is understandable since the SS92 survey had , while the RT survey has . After correcting for the non-equivalent redshift paths for different thresholds, we find that (per unit redshift) 55% of the Mg II systems in SS92 have Å, while this fraction is 50% for the RT survey. This is consistent with expectations since the SS92 and RT samples are derived from the same parent population of absorbers (§3.1).
| RT | SS92 | ||||||
|---|---|---|---|---|---|---|---|
| (Å) | |||||||
| 0.3 | 87 | 0.83 | 104.6 | 111 | 1.12 | 114.2 | |
| 0.6 | 44 | 0.83 | 103.7 | 67 | 1.17 | 129 | |
These determinations should be useful in attempts to compare the effectiveness of our survey strategy, and our results, to conventional surveys. At the present time, the observed incidence of DLA in the various surveys appears to be acceptably consistent given the small number statistics (Jannuzi et al. 1998). However, to make a reliable prediction of the number of systems which will be detected in a survey one should explicitly make use of equation (4) instead of simply multiplying the total redshift path, , at a mean redshift by the expected number of systems per unit redshift, .
4. The Low Redshift DLA Statistics
In this section, we first discuss the steps taken to correct for any Malmquist bias in the RT survey (§4.1). We then derive results on the incidence of low-redshift DLA systems, (§4.2), and their corresponding cosmological neutral gas mass density, (§4.3). We use the and notation deliberately to refer only to classical DLA systems having neutral hydrogen column densities atoms cm-2. In particular, explicitly excludes hydrogen in molecular and ionized forms. It also excludes neutral hydrogen columns that may have been missed due to selection effects, such as obscuration of background QSOs by dust. Since Mg II lines are present in these systems, the gas is clearly enriched with metals. However, there is obviously insufficient dust to cause them to be overlooked. The presence of heavy elements in the neutral components of DLA systems does not make a significant contribution to , however the presence of helium does. Therefore, helium from big bang nucleosynthesis is explicitly included in the calculation of . We assume a cosmology with and use km s-1 Mpc-1 () for all calculations. Where applicable, we report results assuming and .
4.1. Correction for Malmquist Bias
A Malmquist bias can be introduced into a statistical study when a truncation or censoring effect influences sample selection. This is a potential problem in absorption-line surveys since sample selection is usually based on a minimum rest equivalent width or, for cases in which Voigt damping profiles are fitted to the data, the H I column density. This effect is significant if the column density is a steep-enough function near the threshold column density. For example, a Malmquist bias would be introduced if we identified and used only those systems with fitted Ly profiles that indicated atoms cm-2 because the measurements have associated errors and in reality some of the systems are likely to have atoms cm-2. At the same time, there might be many more systems formally measured to lie below the H I column density threshold if errors were not taken into account, but in reality some of these are likely to lie above the threshold.
Thus, our initial intent was to form a DLA sample which included those Mg II systems with measured H I column densities as small as less than atoms cm-2. However, we have not identified and measured any systems which are slightly below the threshold. This is likely to be an artifact of small number statistics222Based on the column density distribution we derive in §5, the expected number of systems with column density atoms cm-2 is . The probability of finding none is 13.5%.. Consequently, in order to approximately correct our sample for the effect of the Malmquist bias, we have simply removed half of the systems with atoms cm-2, reasoning that about half of them are likely to have actual H I column densities slightly below the threshold as suggested by the measurement errors. The details are given below.
Specifically, our study has yielded 87 Mg II systems for which we have information on the nature of the Ly line. Twelve of these systems were found to have DLA with column densities cm-2 and two more were found serendipitously (§2.5). However, as can be seen from Table 3, four systems have measurement errors that suggest that their true H I column densities may lie below the threshold value. These are the atoms cm-2 system toward B2 0827+24, the atoms cm-2 system toward Q0957+561A, the atoms cm-2 system toward Q1209+107, and the atoms cm-2 system toward 3C 336 (1622+239). As noted above, we found no systems which lie slightly below the H I column density threshold. In order to correct for the Malmquist bias we have therefore excluded half of these four systems by giving them weight 0.5 when forming the DLA statistical sample for the purpose of determining and . The correction will have the net effect of lowering our determination by 20% (§4.2), but in fact it has a minor effect on the determination of since the contributions to come from the highest column density systems. After correcting for Malmquist bias, we effectively have 10 DLA systems among 87 Mg II systems with Å and 9 DLA systems among 44 Mg II systems with Å.
It should be noted that, in principle, a Malmquist bias must also affect the Mg II samples themselves since they are defined using threshold values for . Since our particular Mg II sample was compiled from various sources, it is difficult to assess the degree to which the Malmquist bias affects the sample selection for Å. However, with the exception of one system, our DLA detections arise in the Å subsample (§3.1), so we believe that the effects of truncation at some threshold are understood. Moreover, when we considered effects due to selection in RTB95, we found that when measurement errors were well-determined, the resulting statistical results remained unchanged for samples with different threshold . Therefore, we will ignore the effect of any Malmquist bias in the Mg II samples.
4.2.
In §3.1 we showed that the low-redshift DLA absorbers are almost exclusively drawn from the population of absorbers with Å. Therefore, we will use the Å Mg II sample to derive the statistical properties of DLA systems at low redshift. We start with the redshift evolution of the number density distribution of Mg II systems with Å, . SS92 find that
| (5) |
can then be determined by noting the fraction of DLA absorbers among the Mg II absorber population. Given the small number of DLA systems, we can reasonably split the redshift range, , into at most two intervals. Recall that is the low redshift limit of optical spectroscopic surveys for Mg II and is approximately the upper redshift limit of UV surveys for Ly. The mean redshift of the 44 Mg II systems with Å is . We observed 21 Mg II systems in the interval with . Employing the half-weighting method to correct for Malmquist bias (§4.1), three DLA systems in this redshift interval are assigned weight 1.0 and three others have weight 0.5. We observed 23 Mg II systems in the interval with . Four of these are DLA systems with an assigned weight of 1.0, and one other has weight 0.5. Thus, using equation (5) we find,
| (6) | |||||
and
| (7) | |||||
where errors derived from small-number Poisson statistics are reported (Gehrels 1986). These results are shown in Figure 29.
Figure 29 shows the overall results on in the redshift interval . The logarithm of is plotted against . The corresponding linear redshift scale is also shown. The points at are taken directly from WLFC95 and Storrie-Lombardi & Wolfe (2000, in preparation, kindly communicated to us by L. Storrie-Lombardi). The highest-redshift data include recent confirmed DLA detections. The point is derived from the observed H I distribution in local spiral galaxies (RTB95) and represents the probability of intercepting H I columns with atoms cm-2.
Due to small number statistics, the error bars shown in Figure 29 are significant, exceeding approximately 60% in the low-redshift bins and approximately 20% in the moderate to high redshift bins (excluding the highest redshift bins). Nevertheless, it is appropriate to address the issue of whether the new low-redshift result on can be directly compared to the higher redshift results as done in Figure 29. This is because, even after setting aside the issue of possible biases (e.g. biases due to gravitational lensing or dust obscuration), the completeness of the higher redshift surveys should be considered. These surveys include the ones described in WTSC86, Lanzetta et al. (1991), LWT95, and WLFC95. WLFC95 explain that their results are derived from the statistical analysis of 62 DLA systems, but that “the complete statistical sample is likely to exceed 62 DLA systems, with additional systems coming from the 102 untested candidates with (Ly absorption rest equivalent widths) Å.” They further explain that “the 102 untested candidates are likely to be confirmed (to be classical DLA absorption systems) at a rate lower than one in four.” Thus, the problem with directly comparing the low-redshift results on to the high-redshift results (Figure 29), is the absence of a correction for the high-redshift incompleteness. One way to account for high-redshift incompleteness is to perform a statistical analysis which uses the considerably more complete subset of DLA systems which have atoms cm-2 (e.g. as done in Lanzetta et al. 1991). However, since our low-redshift survey does not suffer from this problem, the method we adopt here is to correct for the high-redshift incompleteness. The details of this correction are discussed below and the corrected results are shown in Figure 30.


First, we note that eight of the 102 untested candidates referred to by WLFC95 come from the low-redshift IUE sample of LWT95. In addition, four of the 62 DLA systems in the WLFC95 statistical sample have redshift . This suggests that there are 58 confirmed high-redshift DLA systems in the WLFC95 statistical sample plus another 94 “untested” candidates as of 1995. Our current count of untested high-redshift candidates shows that 89 remain. To assess how the untested candidates may affect the high-redshift results, we note the following: (1) in the WLFC95 bin there are 18 confirmed DLA systems and 33 untested candidates (in reality this bin can only extend down to ), (2) in the WLFC95 bin there are 25 confirmed DLA systems and 39 untested candidates, (3) in the WLFC95 bin there are 11 confirmed DLA systems and 12 untested candidates, and (4) in the WLFC95 bin there is one confirmed DLA system and 5 untested candidates. If the effective success rate for untested candidates (i.e. minus the correction for “confirmed” DLA systems that turn out to lie slightly below the atoms cm-2 threshold) is taken to be 20%, this indicates that the high-redshift results in WLFC95 should be increased significantly relative to the reported errors (see Figure 29). Evidence for such a high effective success rate is readily apparent in figure 2 of Lanzetta et al. (1991). Thus, we find correction factors of , , and for bins , respectively. The errors on the correction factors suggest that differences between the correction factors for different bins are not significant. Thus, an overall correction factor of appears to apply to the high redshift data of WLFC95. The new corrected results on in the redshift interval are shown in Figure 30 and we adopt them for the remainder of our analysis. Results for are not considered since the high-redshift study of Storrie-Lombardi & Wolfe is in preparation and the correction factor, if required, cannot be assessed. This new result is still qualitatively consistent with a linear decline in the incidence of DLA systems with decreasing redshift.
While the statistics are poor, trends can nevertheless be extracted from the data. The decline in can be expressed using the parameterization that is normally adopted to describe the statistics of QSO absorption-line systems,
| (8) |
Therefore, several forms of this power-law parameterization are shown on Figure 30. First, a single power-law is overplotted to include all of the data, including the point (i.e. the open circle, RTB95). The power-law has index , but a single power law may not fit all of the data satisfactorily. Second is a single power law overplotted on all of the data except the point. This very adequately describes the incidence of DLA systems in QSO absorption-line surveys, but the extrapolation over-predicts the inferred incidence of DLA systems at by a factor of 3. Third is a broken power-law overplotted on all the data, including the point. For convenience, we have assumed that the break occurs at redshift , consistent with the determination of the position of the break from the HST QSO Absorption-Line Key Project data which applies to the lower column density Ly forest lines (Weymann et al. 1998). However, at the Key Project determined for the Ly forest but we find that a much steeper decline, with , applies for the DLA systems if the point is included. At Bechtold (1994) found for the Ly forest but we find for the DLA systems. Thus, the data indicate that the broken power-law indices for the DLA systems are significantly different from the indices determined for the Ly forest. For the DLA systems, the incidence is nearly flat at moderate-to-high redshift, but then must decline rapidly at low redshift to fit the point, while the Ly forest shows a more rapid decline at high redshift but then flattens at low redshift. However, the Key Project data do show evidence for a steepening in the incidence of Ly forest lines with increasing rest equivalent width. The incidence of DLA systems at is qualitatively consistent with this trend, but it is not consistent with this trend at . Moreover, any break in the DLA power-law fit may actually occur at some redshift other than 1.5, but this cannot be determined from the present data.
What do these results imply? Recall that for cosmologies, the comoving number density of absorbers is consistent with no intrinsic evolution if for or if for . Thus, if we neglect the point, the present data on with shows some evidence for real intrinsic evolution, but the statistics are not good enough to definitively rule out no evolution in a universe. However, if a no-evolution trend is valid down to , it implies that the H I 21 cm emission surveys are missing 70% of gas-rich systems with atoms cm-2 locally. We consider this possibility unlikely since H I 21 cm emission surveys have not revealed a significant population of gas-rich objects that are not already included in optical surveys (Briggs 1997; Zwaan et al. 1997). These H I surveys are sensitive down to atoms cm-2 and are capable of detecting masses M⊙. Alternatively, the need for a large value for the power-law index, e.g., or the broken power law with and ( and , respectively), arises solely because of the inclusion of the data point. Both this steep single power-law or the broken power-law imply that the DLA absorbers are undergoing significant evolution. At the incidence of DLA systems is a factor 17 times larger than inferred for . This is times larger than what is predicted in a no-evolution universe ( times larger if ). Since is proportional to the number of absorbers per comoving volume times their H I cross-section, the decline in incidence suggests that at , during the last 67% () of the age of the Universe (81% for ), there was either a decrease in the effective H I cross-sections of DLA absorbers, a decrease in the number of DLA absorbers per comoving volume, or a combination of both effects. A decrease in cross-section may correspond to a collapse phase for DLA absorbers, while a decrease in the number of DLA absorbers may be the result of mergers among them.
4.3.
The cosmological mass density of neutral gas in DLA systems, , is determined using and the mean column density of DLA systems as a function of redshift, , as follows
| (9) |
for and
| (10) |
for . Here corrects for a neutral gas composition of 75% H and 25% He by mass, is the gravitational constant, and is the mass of the hydrogen atom. A Hubble constant of km s-1 Mpc-1 is used for all calculations. To determine at low redshift we use the DLA systems and associated column densities given in Table 3. As before, we split the redshift interval into two redshift bins. Three DLA systems with weight 1.0 and three DLA systems with weight 0.5 are in the lower redshift bin; four DLA systems with weight 1.0 and one with weight 0.5 are in the higher redshift bin. For , we find
and
For , we find
and

The logarithm of for and is plotted in Figure 31. The high-redshift results of WLFC95 and Storrie-Lombardi & Wolfe (2000, in preparation) are shown as solid circles and stars, respectively. In this case, the completeness correction (see §4.2) to the high-redshift results on is small (%) relative to the reported errors and has not been applied to the data. See §6 for a discussion of what are likely to be more significant errors in the determination of . The new low-redshift points are plotted as solid squares and are seen to be of comparable value to the points at higher redshift. The errors on the low-redshift points are large owing to the small number of low-redshift DLA systems studied. The open circle at is the local neutral gas mass density as measured by Rao & Briggs (1993). The open square at is the local luminous mass density in stars as determined by Fukugita, Hogan, & Peebles (1998).
The results on are similar to the results in that they show strong evidence for evolution if the point is included. If , the comoving cosmological mass density of high-redshift DLA absorbers is times larger than what is inferred from the local 21 cm observations ( times larger if ). Alternatively, if the point is excluded, there is no convincing evidence for a decrease in with decreasing redshift even at redshifts as low as . In fact, the actual results reveal a tendency for to rise slightly with decreasing redshift in the interval . As expected, this tendency is somewhat more pronounced in a universe than in a universe. However, the error bars on the low-redshift points are fractionally much larger than the error bars and therefore more problematic. This is because the determination of is very sensitive to the small number of systems which have the highest column densities. Thus, the current results do not provide very strong constraints on the evolution of the amount of neutral gas in the Universe in the redshift interval .
Nevertheless, assuming that the point is correct (i.e. assuming we have not missed a significant fraction of the neutral gas in local 21 cm emission surveys), the data would be consistent with the possibility of a rapid decline in both and from to . If , this would imply that the DLA absorber population lost 75% of its neutral gas mass over the most recent 33% of the age of the Universe (if , 85% of the mass would be lost during the most recent 46% of the age of the Universe). We also note that, except for the data point, all the data points in Figure 31 lie within of constant for and for . The data point is discrepant from a constant value at about the level.
What do these results imply? In the context of the conversion of neutral gas into stars and global galaxy formation as might be tracked by , the current data provide no evidence which would support the view that the bulk of galaxy formation happened, for example, at redshifts . This is in contradiction with earlier conclusions reached by LWT95 on low-redshift DLA; their results showed a steady decline in from to . The constant neutral gas mass density from to that our new results imply is also at odds with the evolution of the star formation density in the Universe as derived from the UV luminosity density of galaxies. Steidel et al. (1999) show that after correction for effects of dust obscuration, the star formation density remains roughly constant from to . The data for from Lilly et al. (1996) indicate that the star formation density falls by a factor of from to . The star formation density and the gas mass density cannot both be constant over the same range of redshifts () if they track the same objects. This implies that DLA galaxies and star-forming galaxies trace different populations (see also Pettini et al. 1999, Steidel et al. 1999 and references therein). However, star-forming galaxies must have neutral gas from which to make stars. There are possibly three reasons why searches for DLA systems are not finding star-forming galaxies: (1) the intensive star-forming phase of UV-luminous galaxies is short-lived, (2) background quasars are obscured by dust in the UV-luminous galaxies, and/or (3) the UV-luminous galaxies are likely to be the brightest galaxies at the epochs they are detected (whereas, random sight lines that pick up the DLA population are more likely to intersect H I regions in the more common type of object, i.e., or fainter galaxies. Additional evidence from metallicity studies and direct imaging also point to DLA galaxies as being a slowly evolving population. We will return to the discussion on the nature of DLA galaxies in §7.
5. The Column Density Distribution Function of DLA Systems
The column density distribution function, , specifies the number of absorbers per unit H I column density per unit absorption distance, where the absorption distance is if =0 and if =0.5. Thus, is the number of absorbers with H I column density between and in absorption distance interval .
There are several reasons why it is useful to study this function. For example, its shape can reveal information on the geometry of the absorbing regions (e.g. Milgrom 1988). More ideally, evolutionary models which also take into account the global physical state of the gas (the H+, H0, and H2 fractions) and the conversion of gas into stars would predict . This prediction could then be empirically tested. Unfortunately, the statistics are still too poor to realize this goal in detail. However, we can form a sample which will permit us to derive the most accurate results currently possible on the H I column density distribution function of low-redshift DLA systems (§5.1). We accomplish this by adopting a rationale that allows us to form the largest possible unbiased low-redshift sample. After correcting the sample for Malmquist bias, the normalized cumulative column density distribution can be derived. We then use the KS test to compare the low-redshift normalized cumulative column density distribution function to ones derived from high-redshift DLA systems (§5.2) and local spirals (§5.3). Most notably, we show that the comparisons reveal clear evidence for differences in the shapes of these three column density distribution functions, which we interpret as being indicative of a major evolutionary trend. These results are then converted to absolute DLA column density distribution functions to show the redshift evolution (§5.4).
5.1. The Low-Redshift DLA Column Density Distribution
5.1.1 Rationale for Sample Selection
The selection criteria for constructing a DLA column density distribution are different than what were used to define the RT, and hence, the RT-DLA samples (§3). We now explain how this sample was constructed. To derive the most accurate results possible on the low-redshift DLA column density distribution function we should use all available unbiased information on all known low-redshift DLA systems. Table 7 lists all of the confirmed low-redshift () classical DLA ( atoms cm-2) systems from cosmologically intervening neutral gas that are currently known to us, without regard to possible bias. By confirmed systems we mean ones for which good UV data have been obtained on the Ly absorption-line profile or for which 21 cm absorption lines have been detected. For both of these cases, a reliable estimate of the H I column density can be made. This is preferably done by fitting a Voigt profile to the damping wings of the Ly absorption line (§2), although use of the radio data and the assumption that the gas has 21 cm spin temperature of K can also be used to produce a reliable estimate (Lane et al. 2000, in preparation). Thus, the systems included in Table 7 form a biased sample of low-redshift classical DLA systems. Excluded from Table 7 are any non-classical “damped Ly systems” with H I column densities more than 2 less than atoms cm-2 (although damping wings on the Ly absorption-line profile may still be easily visible in such systems), and all potential DLA systems which have been proposed on the basis of certain metal-line ratios, x-ray absorption, or still even less-direct evidence. Also excluded are 21 cm absorption systems that are not cosmologically intervening along the sight-line to the quasar, but instead more likely arise in the quasar’s host galaxy (e.g. Carilli et al. 1998).
| QSO | V | Notes | Reference | |||
|---|---|---|---|---|---|---|
| atoms cm-2 | ||||||
| 0143015 | 17.7 | 3.14 | 1.613 | 2.0 | 1 | |
| 0218+357 | 20.0 | 0.94 | 0.687 | 13 | Biased (red quasar) | 2 |
| 0235164 | 15.5 | 0.94 | 0.524 | 50 | Biased (21 cm) | 3 |
| 0248430 | 17.6 | 1.31 | 0.394 | 36 | 1 | |
| 0302223 | 16.4 | 1.41 | 1.010 | 2.3 | 1 | |
| 0454039 | 16.5 | 1.34 | 0.859 | 4.7 | 1 | |
| 0500+019 | 21.2 | 0.58 | 0.585aa This system could be the result of absorption by the quasar host galaxy. | 43bb The column density was determined assuming a spin temperature of K (Lane et al. 2000, in preparation). | Biased (red quasar) | 4 |
| 0738313 | 16.1 | 0.63 | 0.091 | 15 | 1, 5 | |
| 0.221 | 7.9 | 1, 5 | ||||
| 0809+483 | 17.8 | 0.87 | 0.437 | 6.3 | Biased (21 cm) | 6 |
| 0827243 | 17.3 | 0.94 | 0.518 | 2.0 | 1 | |
| 0933732 | 17.3 | 2.52 | 1.478 | 42 | 1 | |
| 0935417 | 16.3 | 1.98 | 1.372 | 3.3 | 7 | |
| 0952179 | 17.2 | 1.47 | 0.239 | 21 | 1 | |
| 0957561 | 17.0 | 1.41 | 1.391 | 2.1 | 1 | |
| 1122168cc de la Varga & Reimers (1997) also detect a DLA candidate towards Q0515442 at using IUE spectra. In the past, IUE spectra have been found to be unreliable sources for DLA candidates and we have therefore not included this system in Table 7. | 16.5 | 2.40 | 0.681 | 2.5 | 8 | |
| 1127145 | 16.9 | 1.19 | 0.313 | 51 | 1 | |
| 1209107 | 17.8 | 2.19 | 0.633 | 2.0 | 1 | |
| 1229021 | 16.8 | 1.04 | 0.395 | 5.6 | Biased (21 cm) | 6 |
| 1328+307 | 17.3 | 0.85 | 0.692 | 15 | Biased (21 cm) | 6 |
| 1354258 | 18.0 | 2.00 | 1.418 | 32 | 1 | |
| 1622239 | 17.5 | 0.93 | 0.656 | 2.3 | 1 | |
| 1830211 | 22.0 | 0.89 | 0.192 | 2.5 | Biased (red quasar) | 9 |
References. — (1) This work, (2) Carilli, Rupen, & Yanny 1993, (3) Cohen et al. 1999, (4) Carilli et al. 1998, (5) Rao & Turnshek 1998, (6) Boissé et al. 1998, (7) Jannuzi et al. 1998, (8) de la Varga & Reimers 1997, (9) Wiklind & Combes 1998
To derive the correct shape for the column density distribution function, all systems identified on the basis of a bias in H I column density must be excluded. In Table 7 we note which of the systems were selected on the basis of such a bias. The remaining systems in Table 7 form our “unbiased sample.” As before (§2.4), we exclude the four previously known 21 cm absorbers. We also exclude cosmologically intervening 21 cm absorbers that have been identified in red quasars (e.g. Carilli et al. 1998 and references therein) since their selection is based on the bias of observing red (i.e. dust reddened) quasars. Three systems fit into this category, and in some cases these also involve gravitational lensing which might produce an additional bias. On the other hand, over the last several years four low-redshift DLA systems were identified in the Ly forest serendipitously, without regard to column density bias. The DLA systems discovered in this way were not identified using a technique which would bias the H I column densities to higher values. Therefore, these serendipitously-discovered systems are included in our unbiased sample. Specifically these are the DLA system in Q0935+417 which was found in the HST QSO Absorption Line Key Project survey (Jannuzi et al. 1998), the DLA system in Q1122168 (de la Varga & Reimers 1997), and the system in OI 363 and the system in UM 366 that we found in our HST spectra. (Note that these four systems do not have Mg II information and, therefore, are not part of the RT and RT-DLA samples.) In summary, the present total low-redshift sample consists of 23 low-redshift DLA systems (Table 7), seven of which are excluded due to selection bias. Thus, before correction for Malmquist bias, we have amassed an unbiased sample of 16 systems to study the low-redshift DLA column density distribution function.
The reasons for making a correction for Malmquist bias were discussed in §4.1. To approximately correct our sample for this effect we have given the five systems with atoms cm-2 a weight of 0.5 in the column density distribution analysis.
5.1.2 Normalized Cumulative Column Density Distribution Function
Shown in Figure 32 as a solid curve with open circles is the normalized low-redshift DLA cumulative column density distribution function. This was derived using the Malmquist-bias-corrected sample discussed above which has mean redshift . Since the curve is normalized, we can compare the shape of this curve to the shapes of similarly derived column density distribution functions for high-redshift DLA absorbers and local spirals. This will be done in §5.2 and §5.3, respectively.
5.2. Comparison with Results at High Redshift

In order to compare our low-redshift result with results obtained at higher redshift, we have derived the high-redshift DLA normalized cumulative column density distribution function using the data of WLFC95. We did this by forming an unbiased sample of high-redshift column densities as follows. First, we included all 43 high-redshift () systems with higher-resolution follow-up spectroscopy which have been used to confirm, with little doubt, that these systems are damped. In these cases H I column densities were derived by fitting Voigt damping profiles to the Ly absorption lines. We then included all 15 candidate DLA systems that have Ly rest equivalent widths Å. These systems do not have follow-up spectroscopy, but their large rest equivalent widths formally indicate that they have atoms cm-2, although a few may not. We converted these rest equivalent widths to column densities using the relation Å atoms cm-2. These 58 systems comprise the high-redshift () statistical sample of WLFC95. All but one of these systems lies in the redshift interval . Finally, in keeping with the procedure adopted in §4.2, we assumed that 18 of the remaining 89 “untested” candidate systems ( 20%) are damped and, in reality, have atoms cm-2. When adding these 18 systems to the unbiased high-redshift sample, we have included them evenly over the column density interval , consistent with likely measurement errors. Recall that WLFC95 conclude that they expect these untested candidates to be confirmed at a rate lower than one in four. However, evidence for an effective success of at least 20% is readily apparent in figure 2 of Lanzetta et al. (1991). We chose a success rate of 20% since some of the systems included in the first two steps may actually have slightly smaller than atoms cm-2. This makes an approximate correction for the Malmquist bias in the high-redshift sample. The resulting normalized cumulative column density distribution function derived from this unbiased high-redshift sample is plotted on Figure 32 along with the low-redshift result. The high-redshift result is derived from an effective sample size of 76 DLA systems with mean redshift .
A KS test comparing the low- and high-redshift results indicates that there is only a 2.8% probability that the two samples are derived from the same parent population. This comparison refers only to the shapes of the column density distribution functions and not their normalizations. The low-redshift sample clearly contains a much larger fraction of high column density systems. Thus, our analysis indicates that the interpretation of the current data are inconsistent with an earlier interpretation of the H I column density distribution of low-redshift DLA systems (LWT95). Further discussion of this result is deferred to §5.5.
5.3. Comparison with Results Derived from Local Spiral Galaxies
Rao & Briggs (1993) used H I emission observations of 27 local spirals and information on the spiral galaxy luminosity function to construct a local H I column density distribution function. The more recent study of Zwaan et al. (1999) is consistent with the Rao & Briggs result. A comparison of the Rao & Briggs (1993) result to the one derived from high-redshift DLA statistics by Lanzetta et al. (1991) showed clear evidence for evolution in the number of systems with redshift, but the error bars on the high-redshift points did not permit any meaningful conclusions to be drawn from a comparison of the shapes of the local and high-redshift H I column density distributions. Now, with improved statistics from high-redshift DLA systems (WLFC95) and the results on low-redshift DLA systems reported here, it is possible to perform a more meaningful comparison of the shapes of the column density distribution functions versus redshift. The one caveat which might influence comparisons with the local results is the fact that the beam size used in H I 21 cm emission surveys might be too large to resolve out the local H I cloud structure. If this effect were severe enough, it would cause the highest column densities to be under-represented in the local 21 cm emission surveys. We believe the importance of this effect is minimal and discuss it in more detail in §6.5. Of course, this is not a problem in the pencil-beam QSO absorption-line surveys. The result on the local H I cumulative column density distribution derived by Rao & Briggs (1993) is included on Figure 32. A KS test comparing the low-redshift DLA result with the local H I result indicates that there is only a 0.01% chance that the two samples are derived from the same parent population333A KS test comparing the high-redshift DLA result with the local H I result indicates that there is only a 2.0% chance that these two samples are derived from the same parent population.. Again, the comparison refers only to the shapes of the column density distribution functions and not their normalizations. The comparison shows that the local H I sample contains a much smaller fraction of very high column density gas than is found in the low-redshift DLA sample. In fact, the deficit of high column density gas in the local H I sample is even more pronounced than in the high-redshift DLA sample (§5.2).
5.4. The DLA Absolute Column Density Distribution Function versus Redshift


The absolute column density distribution functions at , low redshift (), and high redshift () are shown in Figure 33 assuming and . For this function is taken directly from Rao & Briggs (1993). The data points at low and high redshift are determined by first estimating the fraction of systems detected as a function of column density, , for the low- and high-redshift samples, respectively. This is shown in Figure 34. Note the higher fraction of the highest column density systems in the low-redshift sample. Then, is given by
| (11) |
where the constant, , is inversely proportional to the absorption distance interval of the survey (see §5). In turn, can be determined from at and by using the expression relating and ,
| (12) |
Thus,
| (13) |
Note that is just the total number of systems found in the survey. The resulting values of for the WLFC95 and RT samples are given in Table 8 for cosmologies with and ; then follows from equation (11) and Figure 34.
| Sample | ||||
|---|---|---|---|---|
| WLFC95 | 2.26 | 1.8 | ||
| RT | 0.78 | 1.3 | ||
| Local galaxies | 0 | 1.2 (log ) | ||
| 2.9 (log ) | ||||
In Table 8 we also present the results of parametric fits to the data on the absolute column density distribution functions. These fits are over-plotted on the binned data (Figure 33). Given the statistical accuracy of the data, the results at both high and low redshifts are fitted by a single power law. It has been argued that such power-law fits are unphysical (e.g. WLFC95, Storrie-Lombardi, Irwin, & McMahon 1996a, Pei, Fall, & Hauser 1999) because, for example, they cause the mass in DLA systems to diverge when they take the form with . While we agree that the power-law fits can be unphysical, we have nevertheless opted to use them because the data at high and low redshifts do not offer support for any particular model. For example, the exponential-disk model fits to the column density distributions presented by WLFC95 are arbitrary in that the data provide no evidence for the breaks that are shown in their figure 7. In addition, at high redshift the data are in excellent agreement with a single power-law fit, while too few systems are known at low redshift to adopt a form other than a single power law. Moreover, as we discuss in §5.5, the shapes of the column density distribution functions at high and low redshifts appear to be inconsistent with a set of randomly distributed gas-rich disks. Therefore, we believe that it is more appropriate to parameterize the column density distribution functions in a model-independent way. At both high and low redshifts, we adopt the view that there is a cutoff in H I column density at atoms cm-2. So far, this is the maximum H I column density found for a DLA system at any redshift.
On the other hand, the absolute H I column density distribution at is clearly not well-represented by a single power law. There is clear evidence for a break in the column density distribution at atoms cm-2. We represent the data at using a broken power-law (Table 8), but again we assume that there is a cutoff in the H I column density distribution at atoms cm-2.
To summarize, our results suggest that at atoms cm-2, ); however at , while at . The value of ) is correspondingly lower at all H I column densities, with for atoms cm-2 and for atoms cm-2.
5.5. Discussion
Despite our findings on the evolution of and , our results on the normalized DLA column density distribution function, , indicate that there is significant evidence for real evolution in even after excluding the data points (Figures 32 and 33). When we compared these trends using the normalized shape of the column density distribution function we found them to be highly significant (§5.2 and §5.3)444Also, Storrie-Lombardi et al. (1996a) report some evidence for both a steepening in the column density distribution function and a decrease the DLA incidence at the very highest redshifts () that are reachable in surveys.. For example, a comparison of the low-redshift and high-redshift normalized column density distribution functions indicates that there is only an 2.8% chance that they are drawn from a population of absorbers with the same properties.
This result may seem surprising since there was only marginal evidence for real evolution in and per comoving volume ( universe) after the data are excluded. However, a close examination of the data shows that the and results are consistent with the results. For a non-evolving universe our results show that marginally decreases with decreasing redshift (i.e. in Figure 30 a power law fits the DLA data better than a power law), while marginally increases with decreasing redshift (Figure 31). These trends ultimately stem from the differences in at high and low redshifts, and as discussed above, our results (Figure 32 and 33) indicate that real evolution has occurred in . The results on and do not explicitly contain any information as a function of column density. Thus, provides new information which and do not provide.
What are the possible origins for the observed evolutionary trend in the column density distribution function? We consider this question by discussing two conceptual models for DLA absorbers. The first model is the Giant Hydrogen Cloud (GHC) model proposed by Khersonsky & Turnshek (1996). In this model DLA galaxies are simply presumed to contain GHCs that can be approximated by spheroids. The second model is the exponential-disk (ED) model which was recently discussed by WLFC95. In the ED model the H I column density falls off exponentially with increasing radius, in approximate agreement with 21 cm observations of H I in gas-rich spirals (e.g. van Gorkom 1993). Moreover, at increasing H I column densities, the column density distribution function must fall off as for randomly inclined disks (Milgrom 1988; WLFC95). This is consistent with what is observed locally (Rao & Briggs 1993; Zwaan et al. 1999), where the behavior applies at atoms cm-2. In the ED model of WLFC95, it is supposed that the behavior sets in at increasingly larger H I values with increasing redshift. We note that the GHC and ED models are not necessarily inconsistent with each other since it is possible to envisage roughly spherical GHCs arranged in a galactic disk.
We will consider the case where the data must fit into any evolutionary trend, as this seems to be a reasonable constraint.
What is the cause of the flattening of the distribution from high to low redshift? First, recall that the observed flattening from to is just the opposite of the evolutionary trend reported by LWT95. We will consider the evolution in the context of both the GHC and ED models. For the GHC model, one would expect to flatten if accretion processes were taking place that caused the relative build-up of more massive H I clouds in the central regions of the absorbing structure. As an illustrative example, consider a case noted by Milgrom (1988). Namely, he points out that for random sight-lines through identical spherical systems where the column density at impact parameter is , a power-law column density distribution with would result for lines of sight that are outside the core. Here, is the column density at , is the core radius, and is the power-law index which specifies the run of the neutral gas density distribution with cloud radius, . In this illustrative example we would expect at and at . This corresponds to much more centrally condensed systems at lower redshift. Thus, in the context of this example, such processes might be associated with galaxy collapse or mergers of galaxies. In particular, if this type of process corresponded to both a relative increase in the masses of GHCs and an increase in their particle density (i.e. somewhat smaller absorbing structures) with decreasing redshift, but with a relatively small conversion rate of gas into stars, it might explain: (1) the relative flattening of the shape of the H I column density distribution from to , (2) the small decrease in per comoving volume with decreasing redshift, and (3) showing no evidence for evolution (or a small increase) with decreasing redshift. This scenario would also seem to be consistent with the measurements of DLA absorber metallicities (§7.1) and kinematics (§7.2). On the other hand, in the context of the ED model it is predicted that the column density distribution should eventually fall off as at the highest column densities (WLFC95; Milgrom 1988). Such a fall-off would also be predicted if the H I gas were in randomly distributed thin layers (Milgrom 1988). However, Figures 32 and 33 show that the high-redshift sample does not follow such a trend, and that the discrepancy is even worse for the low-redshift sample. As mentioned above, WLFC95 have speculated that such a fall off would take place at larger column densities ( atoms cm-2) with increasing redshift. But with the small existing statistical samples of very large column density systems, it is clear that no such evidence for a fall-off exists.
What is the cause of the steepening of the distribution for atoms cm-2 from low redshift to z=0? In the context of the GHC model, Khersonsky & Turnshek (1996) suggested that a high enough rate of conversion of gas into stars would naturally lead to enough UV radiation to destroy the more massive higher column density clouds, eventually causing to steepen. This concept is qualitatively consistent with the current data in that one would surmise that as decreases by a factor of from to there must at some point be an increase in UV radiation owing to the conversion of gas into stars. At the same time, the column density distribution would be expected to fall off as at the highest column densities in an ED model, and this is observed for atoms cm-2 at . Of course, since randomly distributed gaseous disk galaxies were used to derive the column density distribution function (Rao & Briggs 1993; Zwaan et al. 1999), the result at is expected. But the details of how the destruction of massive GHCs would finally lead to the column density distribution observed at are unclear. Nevertheless, the lack of a high column density fall-off following the functional form in the low-redshift DLA sample provides independent evidence that at the DLA absorbers we have detected do not predominantly arise in sight-lines through randomly oriented gaseous disks.
The above discussion offers some interesting possibilities for interpreting the evolution of the distribution from high redshift to . However, while it is clear that evolution is being observed, we cannot as yet really hope to use the results to provide too many details of this evolution due to the small number statistics. Moreover, detailed modeling of the distribution would be complicated by the possibility that the observed distribution arises from a population of DLA absorbers that has a range of properties, as opposed to sight-lines through randomly oriented identical absorbers. Indeed, the evidence for evolution in the shape of the distribution suggests that the population of DLA absorbers must have a variety of properties. Only at do we observe clear evidence for the fall-off at high column densities, consistent with the gaseous disks of spiral galaxies. Owing to the lack of evidence for an fall-off at high column densities, our results on at high and low redshifts indicate that these samples of DLA absorbers are not exclusively derived from a population of randomly oriented gaseous disks, apparently ruling out the paradigm that DLA systems can be used to trace the evolution of the gaseous disk components of galaxies from high to low redshifts.
6. The Limitations of the Results
While we believe that the conclusions drawn thus far have been relatively conservative, there should be concerns about the reliability of some of these results and the future application of this technique. Some important issues are noted below. A clear understanding of these issues will require larger sample sizes and further study.
6.1. Concerns about Small Number Statistics
Although the results presented here represent the best assessment so far of DLA statistics at from a systematic survey, the numbers are still very small. It should be clear that a much larger low-redshift DLA survey would have to be performed in order to accurately follow the cosmological evolution of neutral hydrogen gas at low redshifts.
Our estimate of the error in the incidence of DLA in two redshift bins, , as reported in §4 was relatively straightforward. We used the Poissonian error corresponding to the small number of detected systems and combined this with the error on estimated from the SS92 Mg II survey to estimate the final error. However, an associated serious problem involves the determination of and the corresponding errors. The reported and errors at these redshifts (Figure 31) were derived using equations (9) and (10) in §4. However, for consistency we must also have
| (14) |
Thus, the value of depends on . When the column density distributions are parameterized by power laws, will diverge if the power-law exponent is and is permitted to be arbitrarily large. This is one reason why it has been tempting to fit the column density distribution function with an exponential-disk model in the past. However, by doing so, the possible uncertainty in is minimized based on the speculation that we understand the model for DLA absorbing structures. Even in a power-law model with a cutoff at for , it might be reasonable to expect that depends on redshift. Thus, depending on the chosen value of , there could be a systematic error in the derived that is redshift dependent. As an example of the uncertainty, we point out that for a power law with index , the value of increases by a factor of when is increased from atoms cm-2 to atoms cm-2. In DLA surveys the largest H I column densities are atoms cm-2, so this is the value we adopt for the at all redshifts. But, for example, Braun (1997) has reported values as large as atoms cm-2 in local spirals. Of course, the actual value of in DLA systems is very poorly determined because of small number statistics, and this problem is amplified because the highest column density systems are the most rare. Until sample sizes are significantly larger, we cannot rule out the possibility that this effect is causing us to underestimate by a factor of as much as in a redshift dependent way.
6.2. The Possibility of Gravitational Lensing Bias
It has been argued that low-redshift surveys for DLA lines using bright QSOs may suffer a gravitational lensing bias in the sense that the incidence of DLA absorption will be systematically overestimated (Smette et al. 1997). This would only happen for massive lensing galaxies. For determination of results on this effect is potentially important. For example, if the two highest column density DLA systems contributing to the lowest redshift bin in Figure 31 were due to gravitational lensing bias, it would cause to be severely overestimated. While the QSOs exhibiting low-redshift DLA lines observed with HST-WFPC2 do not show any evidence of being lensed (Le Brun et al. 1997), the ones that contributed the most to the high values have not been imaged with HST, and so the possibility of lensing by the very high column density low-redshift DLA galaxies in our survey has not been studied with the greatest possible sensitivity. On the other hand, our ground-based studies suggest that the luminous counter-parts of low-redshift DLA absorbers are often not highly-luminous, and therefore massive, galaxies (e.g. Rao & Turnshek 1998; §7.3)
6.3. Reliance on Mg II Statistics
The derived statistical results on low-redshift DLA absorbers depend on our statistical understanding of the Mg II population of absorbers. At the present time the statistical errors on the incidence of Mg II absorption-line systems are 47% at and 58% at . In the future, if we are to expand and further develop this technique, larger systematic surveys for QSO Mg II absorption-line systems (especially with Å) will have to be undertaken.
6.4. Complications Due to the Presence of Dust
Fall & Pei (1989) originally suggested that dust in high column density absorbers had some influence on the statistics of DLA absorption, although at that time the observational evidence was not very convincing. More recently, Pei et al. (1999) discussed the effects of dust on , but used the less reliable low-redshift data point of LWT95 to show that a significant amount (68%) of neutral gas is being missed by DLA surveys. Since we derive a higher value for at low redshift, this effect may not be as severe. A comparison with their models suggests that we might be missing % of the neutral gas mass at .
Pettini et al. (1997a) have used depletions of Cr relative to Zn in DLA absorbers and found evidence for dust, but after taking into account the normally low metallicities of DLA systems the inferred dust-to-gas ratios in the known population of DLA absorbers are of the Galaxy value. On the other hand, Carilli et al. (1998) have identified some DLA absorbers by finding 21 cm absorption in a sample of 15 red quasars that were 1 Jy flat-spectrum radio sources. Based on their success, they conclude that optically-selected samples may miss 1/2 of the high column density QSO absorption-line systems due to obscuration by dust. Thus, there is reason for concern, especially since the effect is likely to be redshift dependent. The distribution of dust-to-gas ratios in high column density systems must be investigated in greater detail before we can hope to understand how dust affects our results on and .
6.5. The H I Column Density Distribution at
The H I column density distribution at , and hence (see equation 12), was determined using radial H I column density profiles of a complete sample of 27 large-diameter gas-rich galaxies (Rao & Briggs 1993). At , spirals afford the largest cross-section to line-of-sight absorption at column densities atoms cm-2 (see figure 5 in Rao & Turnshek 1998) and contribute 95% to the local interception probability. Moreover, 89% of the H I mass in the local Universe resides in spiral galaxies later than type S0 (Rao & Briggs 1993). Thus, the “DLA” statistics should be accurately described by the properties of local spiral galaxies. This is equivalent to saying that pencil-beam QSO surveys for DLA at will most likely intercept large diameter spirals. Thus, the statistics derived from such a survey should reproduce the properties of the local spiral galaxy population.
The one caveat in using 21 cm emission measurements to describe column density distributions within galaxies is that spatial resolution is limited by the finite size of the radio beam. The technique measures the total H I mass within the radio beam to a high degree of accuracy, but what one really derives is an average H I column density within the area sampled by the beam. Thus, information about the highest column densities residing in any knots or clumps smaller than the radio beam would be lost. The extent to which this affects the statistics depends on the total cross-sectional area of any high-column-density clumps and how much smaller they are than the beam size. If such an effect is important, the most significant consequence might be an underestimation of at column densities atoms cm-2 (Zwaan et al. 1999), but any effect on is likely to be small since the highest column densities would still contribute only a fraction of the total cross-section over all atoms cm-2. Note that the finite radio beam size does not affect the determination of since the integrated H I mass within the beam is a well determined quantity. The extent to which high column densities are under-represented in 21 cm emission surveys can be estimated by comparing the values of determined by (1) directly measuring the H I mass of galaxies as done by Rao & Briggs (1993) and (2) integrating the distribution over all column densities (see equation (9) in WLFC95 and equations (8), (9) and (10) in Rao & Briggs 1993). The first is a true measure of the total H I mass including the contribution from the highest column density clumps. If the exclusion of the highest column density material in the distribution were severe, then the second estimate of the total mass would be significantly lower. However, this comparison was carried out in Rao & Briggs (1993) and the two values were found to be equal within the errors. Therefore, we conclude that any high column density gas that may have been missed in 21 cm emission surveys is not significant, and that the distribution at in Figure 33 is a fair representation of the local gas distribution.
A related point involves H I self-absorption within a galactic disk. We note that if the inclination of a disk is large, the measured H I flux in a radio beam might be affected by H I self-absorption within the disk. This problem would underestimate both the mass and the mean column density measured within the beam by approximately 15%. We first discussed this in RTB95. While we took this effect into account by increasing the upper error bar on by 15%, we did not include errors in the measured values of versus radius for our sample of spiral galaxies in the determination of .
Finally , there is the issue of small H I masses ( M⊙) and the inability to detect them in local H I surveys (Zwaan et al. 1997). This is a limitation of our current knowledge of the distribution of H I in the local Universe. Observationally, the existence of absorbing objects with such masses (e.g. gas-rich dwarfs) that also contain high column density regions ( atoms cm-2) cannot be ruled out.
7. The Nature of the DLA Absorber Population
It is reasonable to assume that all DLA absorbers are associated with some sort of galaxy since there are no known DLA systems which lack metal-line absorption. Thus, we can infer the presence of star formation, stellar nucleosynthesis, and stellar mass loss. In the GHC model for DLA systems (Khersonsky & Turnshek 1996) noted earlier (§5.5), it was assumed that DLA systems are associated with the neutral gas in GHCs that must naturally be associated with various types of gas-rich galaxies and proto-galaxies. Such galaxies would be the progenitors of different types of galaxies (ellipticals, spirals, irregulars, dwarfs, etc.) that are observed at the present epoch. This is consistent with the idea that the DLA systems generally track neutral gas in, for example, both spheroidal and disk components of galaxies and proto-galaxies (and possibly other gaseous structures as well) from high redshift to the present epoch. Alternatively, the ED model is much more specific in that it relates DLA absorbers to galactic disk systems, which furthermore are thought to be relatively luminous (WTSC86; Wolfe 1988; Lanzetta et al. 1991; Steidel 1995). Initially there were many good indirect reasons to adopt the ED model (see Wolfe 1995 and references therein). However, now there are some direct results which contradict the single DLA-H I disk paradigm. When evidence from DLA metallicity measurements, kinematic measurements/simulations, and the direct imaging of galaxies associated with DLA systems is considered, the DLA-GHC model is seen to be a much more favorable framework for interpretation of the DLA systems. Here we summarize this evidence. The evidence supports the conclusion, drawn from analysis of DLA column density distributions at low and high redshifts (§5), that DLA systems do not exclusively trace the gaseous disk components of galaxies. Instead they trace a mixture of types.
7.1. Evidence from Measurements of the Gas-Phase Metallicity
Pettini and collaborators (e.g. Pettini et al. 1997b, Pettini et al. 1999, Pettini et al. 2000) have measured metallicities in many of the high-redshift DLA systems and some of the known low-redshift ones. Some of their measurements pertain to systems which are not classically damped, with atoms cm-2, but this does not affect their broad conclusions. The most extensive measurements are for Zn which is a particularly good tracer of the gas phase metallicity since it is not significantly depleted on to dust grains. While detailed interpretations of the metallicity measurements have not reached a consensus (e.g. see Lu et al. 1996, Pettini et al. 1999, Prochaska & Wolfe 1999, and references therein), the broad results are clear. The typical column density weighted metallicity in the redshift interval is 1/12 of the solar value ([Zn/H]], with no obvious tendency for the metallicity to increase with decreasing redshift. However, there is considerable scatter in the individual metallicities which is most likely caused by the wide range of formation histories and galaxy types responsible for the DLA systems. In fact, Pettini et al. (1999) have concluded that the known DLA systems are unlikely to trace the galaxy population responsible for the bulk of the star formation. Metallicity measurements of the lowest-redshift systems in our low-redshift DLA sample will greatly clarify the evolution of DLA metallicity to the lowest redshifts that are currently attainable.
7.2. Evidence from Measurements of the Kinematics
High-resolution studies of the metal-line profiles associated with DLA systems provide constraints on kinematic models of the absorbing region. In general, a DLA absorbing region will include one or more very high column density components as well as low column density components that give rise to detectable metal lines. Using Keck HIRES observations, Prochaska & Wolfe (1997; 1998) have shown that the kinematics of the metal-line profiles associated with high-redshift DLA absorbers often have a “leading-edge” characteristic. Based on simulations, they have argued that the kinematic profiles of the DLA absorbing regions as a whole are more consistent with models of rotating H I disks than any other single type of model. More recently, the kinematics have also been shown to be consistent with gas in-fall due to merging (Haehnelt, Steinmetz, & Rauch 1998), randomly moving clouds in a spherical halo (McDonald & Miralda-Escudé 1999), and multiple gas discs in a common halo (Maller et al. 2000). Therefore, it seems most likely that, consistent with other current findings, the kinematics of DLA absorbing regions arise from a mix of kinematic structures, including some rotating gaseous disks.
7.3. DLA Galaxy Imaging Studies
There are some direct results from published HST-WFPC2 images of confirmed ( cm-2) low-redshift DLA absorbers which suggest that the morphological types of DLA galaxies are indeed mixed. Seven DLA absorbers in the redshift interval have so far been imaged with HST-WFPC2. In one case (the system toward 3C 336 (1622+239)) there is no optical evidence for a galaxy despite very deep observations (Steidel et al. 1997). In the other six cases the galaxies are likely to be spirals (the system toward 3C 196 (0809+483) and the system toward Q1209+107), two amorphous, LSB galaxies (the system toward PKS 1229021 and the system toward 3C 286 (1328+307)), and two compact objects (the system toward EX 0302223 and the system toward PKS 0454+039) (Le Brun et al. 1997). One other higher-redshift DLA absorber imaged by Le Brun et al. (1997) with HST-WFPC2 was also found to be a compact object (the systems toward MC 1331+170).
In addition, ground-based observations of three of the lowest redshift DLA absorbers in our low-redshift sample have been published. Initial WIYN imaging indicates that one is a dwarf while the other is a dwarf and/or an object with very low surface brightness (the and absorbers toward OI 363 (0738+313)) (Rao & Turnshek 1998). In the third case, a luminous spiral lies near the sight-line but several dwarfs are also present with even smaller impact parameters (the system toward PKS 112714, Lane et al. 1998a).
Thus, the DLA galaxies associated with the DLA systems in our low-redshift sample are not dominated by luminous gas-rich spirals. Instead, the imaging results demonstrate that the morphological types of DLA galaxies are mixed and span a range in luminosities and surface brightnesses. Ongoing imaging observations of other DLA absorbers in our low-redshift sample support this conclusion.
7.4. Discussion
Several independent lines of evidence now lead us to conclude that the DLA galaxy population represents a range of morphological types and luminosities. It might then follow that the progenitors of spiral galaxies are not the main repositories of neutral gas at redshifts . However, this is at odds with results near redshift , where the bulk of the high-column-density neutral gas is found to reside in luminous gas-rich spirals. Can these two apparently disparate observational results be reconciled?
When considered together, the following three results, (1) that and show little evolution between redshifts and , (2) that the metallicities of the DLA absorbers has remained roughly constant over this redshift interval, and (3) that many of the DLA galaxies at low redshift that have been identified through imaging are LSB or dwarf galaxies, might lead us to conclude that DLA absorbers are a slowly evolving population. In fact, DLA galaxies probably do not trace star-forming galaxies (see also Fynbo et al. 1999), and perhaps DLA absorbing regions are in a quiescent phase of their evolution when they are not undergoing an episode of star formation. Thus, we might be seeing little evolution in the properties of DLA systems by virtue of an observational bias that selects similar types of absorbers at all redshifts, i.e., regions in intervening galaxies with high-column-density, low-metallicity (and hence, low-dust-content) gas. If the models of Pei et al. (1999) are correct, then galaxies that are not tracked by DLA absorption lines make up % of the neutral gas at (using our new low-redshift result) and % at where the effect of obscuration by dust is most severe (see their figure 7). On the other hand, local H I 21 cm emission-line surveys do not suffer from this bias. Thus, we are left with some unanswered questions: (1) Are a majority of spiral-galaxy progenitors missing from DLA absorption-line surveys and do they contain the missing gas fraction seen in the models of Pei et al. (1999)? (2) What fraction of the neutral gas mass is contained in star-forming galaxies at high redshift? (3) What are the present-day whereabouts of the neutral gas observed in high- and low-redshift DLA galaxies?
A self-consistent explanation of the observational data that has been obtained from QSO absorption lines and imaging studies of DLA galaxies, UV luminous galaxies, faint blue dwarfs, etc. is still far from complete. Recall that the redshift interval includes the most recent 45% of the age of the Universe for (33% for ). Thus, it is conceivable that significant changes in the properties of galaxies have taken place over this time interval. Efforts on increasing the sample size of low-redshift DLA absorbers should be made. This will allow us to study the evolution in , , and in greater detail, and help assess the effects of biases such as dust obscuration.
8. Summary and Conclusions
We have used a novel technique, based on Mg II pre-selection, to conduct a low-redshift () survey for DLA absorption systems in QSO spectra. The survey was conducted in the UV with HST-FOS. Our low-redshift results, when combined with results from DLA studies at higher redshift, afford us the opportunity to study the distribution of neutral gas in DLA systems back to a time when the Universe was less than 10% of its present age. Aside from DLA studies, no other methods have revealed such large amounts of significantly redshifted neutral gas. Thus, the study of DLA absorbers is currently the most effective method for investigating the bulk of the known neutral gas mass of the Universe. Our findings and conclusions are as follows:
(1) In our survey we uncovered 12 DLA lines in a sample of 87 Mg II systems with Mg II rest equivalent width Å. Two more DLA systems with no available Mg II absorption-line information were discovered serendipitously.
(2) The DLA absorbers are drawn almost exclusively from the population of Mg II absorbers which have Å. Approximately 50% of the systems with Mg II 2796 0.5 Å and Fe II 2600 0.5 Å have DLA absorption lines which meet the classical definition used in high-redshift surveys, atoms cm-2. We know of only one rare case of a low-redshift DLA absorber that does not have Mg II 2796 0.5 Å and Fe II 2600 0.5 Å.
(3) The survey method resulted in a determination of the fraction of Mg II systems with DLA, which in turn allowed us to determine the incidence of low-redshift DLA absorption using earlier results on the incidence of Mg II absorption systems. Neutral hydrogen column densities were determined by fitting Voigt damping profiles to the Ly lines in the HST-FOS UV survey spectra. This information was then used to deduce the low-redshift cosmological neutral gas mass density of DLA absorbers and their H I column density distribution.
(4) In making these determinations, possible biases were carefully eliminated. For example, known 21 cm absorbers were excluded from the initial low-redshift sample and the low-redshift sample (this study, ) and high-redshift sample (from the literature, ) were corrected for Malmquist bias before they were compared. A comparison with inferred results on DLA at was also made; the results were derived from 21 cm emission observations of nearby gas-rich spirals, since spirals are the dominant known reservoirs of large column density neutral gas in the local Universe.
(5) The findings were discussed in the context of a cosmology with and . Assuming that the results are not missing any significant fraction of the local neutral gas, the incidence of DLA systems per unit redshift, , is found to decrease with decreasing redshift by an amount significantly larger than what is expected in a no-evolution universe. Specifically, we found that the high-redshift incidence of DLA systems is times larger than that found at in a no-evolution universe ( times larger if ). However, if the point is removed from the analysis, there is only mild evidence for a real decrease in incidence per comoving volume down to . Thus, it is possible that most of the real evolution occurs between and .
(6) The DLA cosmological neutral gas mass density also shows strong evidence for evolution when compared with the results. If , the comoving cosmological mass density of high-redshift DLA absorbers is times larger than what is inferred from local 21 cm observations ( times larger if ). However, if the results are ignored, the cosmological mass density of neutral gas in low-redshift DLA absorbers is observed to be comparable to that observed at high redshift (and, in fact, formally somewhat higher). Thus, we cannot point to a trend in the DLA data themselves which indicates that at low redshift is approaching the value derived for the cosmological mass density of neutral gas found in present-day spirals. Again, it is possible that most of the real evolution occurs between and .
(7) The H I column density distribution of the low-redshift DLA sample is found to differ in comparison to the high-redshift DLA sample and that inferred for local spirals. The low-redshift DLA absorbers exhibit a larger fraction of very high column density systems in comparison to determinations at both high redshift and locally. The observed trend suggests that the column density distribution starts out relatively steep at high-redshift (), it then flattens at the redshifts covered in our low-redshift survey (), and then locally it starts off relatively flat () but then steepens at atoms cm-2 (), becoming even steeper than observed at high redshift. We emphasize that the column density distributions of DLA absorbers at high and low redshifts are not observed to fall off as with increasing column density. An fall-off is theoretically predicted for disk-like systems and this is, in fact, what is observed locally in spiral samples.
(8) While our understanding is that it is unlikely that the studies have missed any significant component of the neutral gas, we also understand that existing H I 21 cm emission surveys are only very sensitive to neutral gas masses M⊙. Thus, if the results are missing a significant component of the neutral gas mass, it almost certainly lies in this regime. However unlikely, if this should turn out to be the case, there would then be evidence for only mild intrinsic evolution in the DLA population over the redshift interval .
(9) The decrease in the overall incidence of DLA absorbers with decreasing redshift, accompanied by the increase in the relative number of high column density systems with decreasing redshift, explains the lack of evidence for evolution in the amount of neutral gas locked up in the DLA absorbers from high redshift to . This lack of evidence for significant conversion of gas into stars (or some other phase), suggests that the gas contained in DLA systems has not experienced much star formation, and is consistent with the lack of evolution seen in their metallicities. Moreover, recent results from imaging studies show that DLA galaxies comprise a mix of morphological types with a large fraction of them being low-surface-brightness or dwarf galaxies. Thus, DLA absorption lines seem to be tracking a slowly evolving population of objects. Indeed, there might be little evolution in the properties of DLA systems for the simple reason that observational biases select similar types of absorbers at all redshifts, i.e., regions in intervening galaxies with high-column-density, low-metallicity (and hence, low-dust-content) gas.
(10) DLA systems trace the bulk of the observable neutral gas content of the Universe at redshifts , while at the present epoch, the neutral gas mass density and cross-section are dominated by luminous spirals. In order to understand the evolution of neutral gas in the Universe, we must address the question of the present-day whereabouts of the neutral gas mass observed in high- and low-redshift DLA systems. Can models predict the decline of a factor of 5 in the neutral gas mass density from to especially if DLA galaxies are a non-star-forming and slowly-evolving population?
(11) Finally, in order to improve our understanding of the neutral gas content of the Universe to the point where we can accurately follow its evolution to , we will have to collect and analyze large samples of low-redshift DLA systems. In addition to improving the statistical uncertainties, this would permit a better determination of the shape of the H I column density distribution at large column densities, effectively allowing a determination of the maximum H I column density which might be a function of redshift. Understanding this turn-down in column density is important for the determination of . A large optical ground-based survey for large rest equivalent width QSO Mg II absorption lines would be a reasonable initial step. Additionally, however, in order to fully take advantage of the information that could be provided by a large DLA survey, we would have to do more than simply increase the sample size. We would also have to design observational programs that clarify the uncertainties or systematic effects caused by potential dust obscuration and possible gravitational lensing bias. The sensitivity of the H I 21 cm emission surveys should also be pushed to lower limits, to the point where we can definitively assess the possibility of very high column density DLA absorption arising in very low mass local objects ( M⊙).
References
- (1) Afanaśev, V. L., Lorenz, H., Vaĺtts, I. E., & Levshakov, S. A. 1990, Sov. Astron. Lett, 16(3), 206
- (2) Aldcroft, T. L., Bechtold, J., & Elvis, M. 1994, ApJS, 93, 1
- (3) Bahcall, J., et al. 1993, ApJS, 87, 1
- (4) Barthel, P. D., Tytler, D. R., & Thomson, B. 1990, A&AS, 82, 339
- (5) Bechtold, J. 1994, ApJS, 91, 1
- (6) Bergeron, J., & D’Odorico, S. 1986, MNRAS, 220, 833
- (7) Bergeron, J., & Stasińska, G. 1986, A&A, 169, 1
- (8) Bergeron, J., D’Odorico, S., & Kunth, D. 1987, A&A, 180, 1
- (9) Bergeron, J., Boulade, O., Kunth, D., Tytler, D., Boksenberg, A., & Vigroux, L. 1988, A&A, 191, 1
- (10) Bergeron, J., & Boissé, P. 1991, A&A, 243, 344
- (11) Boissé, P., & Bergeron, J. 1985, A&A, 145, 59
- (12) Boissé, P., Boulade, O., Kunth, D., Tytler, D., & Vigroux, L. 1992, A&A, 262, 401
- (13) Boissé, P., Le Brun, V., Bergeron, J., & Deharveng, J.-M. 1998, A&A, 333, 841
- (14) Boksenberg, A., Carswell, R. F., Smith, M. G., & Whelan, J. A. J. 1978, MNRAS, 184, 773
- (15) Boksenberg, A., Carswell, R. F., & Sargent, W. L. W. 1979, ApJ, 227, 370
- (16) Boulade, O., Kunth, D., Tytler, D., & Vigroux, L. 1987, in High Redshift and Primeval Galaxies, eds. J. Bergeron et al. (France:Edit.Front.), p. 349
- (17) Briggs, F. H., & Wolfe, A. M. 1983, ApJ, 268, 76
- (18) Briggs, F. H. 1988, in QSO Absorption Lines: Probing the Universe, ed. J. C. Blades, D. A. Turnshek, & C. A. Norman (Cambridge: Cambridge Univ. Press), 275
- (19) Briggs, F. H. 1997, ApJ, 484, 618
- (20) Braun, R. 1997, ApJ, 484, 637
- (21) Carilli, C. L., Rupen, M. J., & Yanny, B. 1993, ApJ, 412, L59
- (22) Carilli, C. L., Menten, K. M., Reid, M. J., Rupen, M. P., & Yun, M. S. 1998, ApJ, 494, 175
- (23) Carswell, R. F., Smith, M. G., & Whelan, J. A. J. 1977, ApJ, 216, 351
- (24) Caulet, A. 1989, ApJ, 340, 90
- (25) Chae, K.-H. 1999, ApJ, 524, 582
- (26) Churchill, C. W. 1997, Ph.D. thesis, Univ. of California, Santa Cruz
- (27) Churchill, C. W., Rigby, J. R., Charlton, J. C., Vogt, S. S. 1999a, ApJS, 120, 51
- (28) Churchill, C. W., Mellon, R. R., Charlton, J. C., Jannuzi, B. T., Kirhakos, S., Steidel, C. C., & Schneider, D. P. 1999b, ApJ, 519, L43
- (29) Cohen, R. D., Barlow, T. A., Beaver, E. A., Junkkarinen, V. T., Lyons, R. W., & Smith, H. E. 1994, ApJ, 421, 453
- (30) Cohen, R. D., Burbidge, E. M., Junkkarinen, V. T., Lyons, R. W., & Madejski, G. 1999, BAAS, 194, 71.01
- (31) Connolly, A., Szalay, A. S., Dickinson, M., Subbarao, M. U., & Brunner, R. J. 1997, ApJ, 486, L11
- (32) de la Varga, A., & Reimers, D. 1997, in Structure and Evolution of the Intergalactic Medium from QSO Absorption Line Systems, ed. P. Petitjean & S. Charlot, (Paris: Editions Frontiere), 456
- (33) Dobrzycki, A., & Bechtold, J. 1997, in Structure and Evolution of the Intergalactic Medium from QSO Absorption Line Systems, ed. P. Petitjean & S. Charlot, (Paris: Editions Frontiere), 390
- (34) Dinshaw, N., & Impey, C. 1996, ApJ, 458, 73
- (35) Fall, S. M., & Pei, Y. C. 1989, ApJ, 337, 7
- (36) Falomo, R. 1990, ApJ, 353, 114
- (37) Foltz, C. B., Weymann, R. J., Peterson, B. M., Sun, L., Malkan, M. A., & Chaffee Jr., F. H. 1986, ApJ, 307, 504
- (38) Fukugita, M., Hogan, C. J., & Peebles, P. J. E. 1998, ApJ, 503, 518
- (39) Fynbo, J. U., Moller, P., Warren, S. J. 1999, MNRAS, 305, 849
- (40) Gehrels, N. 1986, ApJ, 303, 336
- (41) Haehnelt, M., Steinmetz, M., & Rauch, M. 1998, ApJ, 495, 64
- (42) Jakobsen, P., Perryman, M. A. C., Ulrich, M. H., Macchetto, F., & Di Serego Alighieri, S. 1986, ApJ, 303, L27
- (43) Jakobsen, P., Perryman, M. A. C., & Cristiani, S. 1988, ApJ, 326, 710
- (44) Jakobsen, P., & Perryman, M. A. C. 1992, ApJ, 392, 432
- (45) Jannuzi, B., et al. 1998, ApJS, 118, 1
- (46) Khersonsky, V. K., & Turnshek, D. A. 1996, ApJ, 471, 657
- (47) Kim, T.-S., Hu, E. M., Cowie, L. L., & Songaila, A. 1997, AJ, 114, 1
- (48) Koratkar, A., Antonucci, R., Goodrich, R., & Storrs, A. 1998, ApJ, 503, 599
- (49) Kunth, D., & Bergeron, J. 1984, MNRAS, 210, 873
- (50) Lane, W., Smette, A., Briggs, F., Rao, S., Turnshek, D., & Meylan, G. 1998a, AJ, 116, 26
- (51) Lane, W. M., Briggs, F. H., Rao, S. M., & Turnshek, D. A. 1998b, AAS, 193.0409
- (52) Lanzetta, K. M., Turnshek, D. A., & Wolfe, A. M. 1987, ApJ, 322, 739
- (53) Lanzetta, K. M., Wolfe, A. M., Turnshek, D. A., Lu, L., McMahon, R. G., & Hazard, C. 1991, ApJS, 71, 1
- (54) Lanzetta, K. M., Wolfe, A. M., & Turnshek, D. A. 1995, ApJ, 440, 435 (LWT95)
- (55) Le Brun, V., Bergeron, J., Boissé, P., & Christian, C. 1993, A&A, 279, 33
- (56) Le Brun, V., Bergeron, J., Boissé, & Deharveng, J. M. 1997, A&A, 321, 733
- (57) Lu, L., Wolfe, A. M., Turnshek, D. A., & Lanzetta, K. M. 1993, ApJS, 84, 1
- (58) Lu, L., & Wolfe. A. M. 1994, AJ, 108, 44
- (59) Lu, L., Sargent, W. L. W., Barlow, T. A., Churchill, C. W., & Vogt, S. S. 1996, ApJS, 107, 475
- (60) Madau, P., Pozzetti, L., & Dickinson, M. 1998, ApJ, 498, 106
- (61) Maller, A. H., Prochaska, J. X., Somerville, R. S., & Primack, J. R. 2000, astro-ph/0002449
- (62) McDonald, P. & Miralda-Escudé, J. 1999, ApJ, 519, 486
- (63) Milgrom, M. 1988, A&A, 202, L9
- (64) Miller, J. S. & French, H. B. 1978, in Pitts. Conf. on BL Lac Objects, ed. A. M. Wolfe (U. Pittsburgh), 228
- (65) Pei, Y. C., Fall, S. M., & Hauser, M. G. 1999, ApJ, 522, 604
- (66) Petitjean, P., & Bergeron, J. 1990, A&A, 231, 309
- (67) Pettini, M., & Bowen, D. V. 1997, A&A, 327, 22
- (68) Pettini, M., King, D. L., Smith, L. J., & Hunstead, R. W. 1997a, ApJ, 478, 536
- (69) Pettini, M., Smith, L. J., King, D. L., & Hunstead, R. W. 1997b, ApJ, 486, 665
- (70) Pettini, M., Ellison, S., Steidel, C., & Bowen, D. 1999, ApJ, 510, 576
- (71) Pettini, M., Ellison, S. L., Steidel, C. C., Shapley, A. E., & Bowen, D. V. 2000, ApJ, 532, 65
- (72) Prochaska, J. X., & Wolfe, A. M. 1997, ApJ, 487, 73
- (73) Prochaska, J. X., & Wolfe, A. M. 1998, ApJ, 507, 113
- (74) Prochaska, J. X., & Wolfe, A. M. 1999, ApJS, 121, 369
- (75) Rao, S. M., & Briggs , F. H. 1993, ApJ, 419, 515
- (76) Rao, S. M. 1994, Ph.D. thesis, Univ. Pittsburgh
- (77) Rao, S. M., Turnshek, D. A., & Briggs, F. H. 1995, ApJ, 449, 488 (RTB95)
- (78) Rao, S. M., & Turnshek, D. A. 1998, ApJ, 500, L115
- (79) Sargent, W. L. W., Young, P. J., Boksenberg, A., Carswell, R. F., & Whelan, J. A. J. 1979, ApJ, 230, 49
- (80) Sargent, W. L. W., Young, D., & Boksenberg, A. 1982, ApJ, 252, 54
- (81) Sargent, W. L. W., & Steidel, C. C. 1987, ApJ, 322, 142
- (82) Sargent, W. L. W., Boksenberg, A., & Steidel, C. C. 1988, ApJS, 68, 539
- (83) Sargent, W. L. W., Steidel, C. C., & Boksenberg, A. 1989, ApJS, 69, 703
- (84) Smette, A., Claeskens, J.-F., & Surdej, J. 1997, New Astronomy, 2, 53
- (85) Steidel, C. C., & Sargent, W. L. W. 1992, ApJS, 80, 1 (SS92)
- (86) Steidel, C. C. 1995, in QSO Absorption Lines, ed. G. Meylan (Berlin: Springer), 139
- (87) Steidel, C. C., Bowen, D. V., Blades, J. C., & Dickinson, M. 1995, ApJ, 440, L45
- (88) Steidel, C. C., Dickinson, M., Meyer, D. M., Adelberger, K. L., & Sembach, K. R. 1997, ApJ, 480, 568
- (89) Steidel, C. C., Adelberger, K. L., Giavalisco, M., Dickinson, M., & Pettini, M. 1999, ApJ, 519, 1
- (90) Storrie-Lombardi, L. J., Irwin, M. J., & McMahon, R. G. 1996a, MNRAS, 282, 1330
- (91) Storrie-Lombardi, L. J., McMahon, R. G., & Irwin, M. J. 1996b, MNRAS, 283, L79
- (92) Turnshek, D. A. 1988, in QSO Absorption Lines: Probing the Universe, ed. S. C. Blades, D. A. Turnshek, & C. A. Norman, (Cambridge: Cambridge University Press), 17
- (93) Turnshek, D. A., Wolfe, A. M., Lanzetta, K. M., Briggs, F. H., Cohen, R. D., Foltz, C. B., Smith, H. E., & Wilkes, B. J. 1989, ApJ, 344, 567
- (94) Turnshek, D. A., & Bohlin, R. C. 1993, ApJ, 407, 60
- (95) Turnshek, D. A. 1997a, in ASP Conf. Ser. 128, Mass Ejection from AGN, ed. N. Arav, I. Shlosman, & R. J. Weymann, (San Francisco: ASP), 52
- (96) Turnshek, D. A. 1997b, in ASP Conf. Ser. 128, Mass Ejection from AGN, ed. N. Arav, I. Shlosman, & R. J. Weymann, (San Francisco: ASP), 193
- (97) Tytler, D., Boksenberg, A., Sargent, W. L. W., Young, P., & Kunth, D. 1987, ApJS, 64, 667
- (98) Ulrich, M.-H., & Owen, F. N. 1977, Nature, 269, 673
- (99) van Gorkom, J. H. 1993, in The Environment and Evolution of Galaxies, ed. J. M. Shull & H. A. Thronson (Dordrecht: Kluwer), 345
- (100) Véron-Cetty, M.-P., & Véron, P. 1998, A Catalogue of Quasars and Active Nuclei (ESO Sci. Rep. 18) (8th ed.; Garching:ESO)
- (101) Weymann, R. J., Chaffee, F. H., Jr., Carleton, N. P., Walsh, D., Carswell, R. F., & Davis, M. 1979, ApJ, 233, L43
- (102) Weymann, R. J., et al. 1998, ApJ, 506, 1
- (103) Wiklind, T., & Combes, F. 1998, ApJ, 500, 129
- (104) Wills, B. J. 1978, in Pitts. Conf. on BL Lac Objects, ed. A. M. Wolfe (U. Pittsburgh), 235
- (105) Wills, B. J., & Wills, D. 1980, ApJ, 238, 1
- (106) Wolfe, A. M., Turnshek, D. A., Smith, H. E., & Cohen, R. D. 1986, ApJS, 61, 249 (WTSC86)
- (107) Wolfe, A. M. 1988, in QSO Absorption Lines: Probing the Universe, ed. J. C. Blades, D. A. Turnshek, & C. A. Norman (Cambridge: Cambridge Univ. Press), 297
- (108) Wolfe, A. M., Turnshek, D. A., Lanzetta, K. M., & Lu, L. 1993, ApJ, 404, 480
- (109) Wolfe, A. M. 1995, in QSO Absorption Lines, ed. G. Meylan (Berlin: Springer), 13
- (110) Wolfe, A. M., Lanzetta, K. M., Foltz, C. B., & Chaffee, F. H. 1995, ApJ, 454, 698 (WLFC95)
- (111) Womble, D. S., Junkkarinen, V. T., Cohen, R. D., & Burbidge, E. M. 1990, AJ, 100, 1785
- (112) Young, D., Sargent, W. L. W., & Boksenberg, A. 1982, ApJS, 48, 455
- (113) Zuo, L., Beaver, E. A., Burbidge, E. M., Cohen, R. D., Junkkarinen, V. T., & Lyons, R. W. 1997, ApJ, 477, 568
- (114) Zwaan, M., Briggs, F. H., Sprayberry, D., & Sorar, E. 1997, ApJ, 490, 173
- (115) Zwaan, M. A., Verheijen, M. A. W., & Briggs, F. H. 1999, PASA, 16, 100