Faint Field Galaxies Around Bright Stars - A New Strategy for Imaging at the Diffraction Limit
Abstract
This paper presents a new strategy for observing faint galaxies with high order natural guide star systems. We have imaged 5 high galactic latitude fields within the isoplanatic patch of bright stars (8.5 R 10.3 mag). The fields provide a rich set of faint field galaxies that are observable with a natural guide star adaptive optics system on a large telescope. Due to the small fields of many AO science cameras, these preliminary images are necessary to identify candidate galaxies. We present the photometry and positions for 78 objects (at least 40 galaxies) near five bright stars, appropriate for diffraction limited studies with the Keck and other AO systems on large ground-based telescopes. The K band seeing conditions in each field were excellent (04 - 07) allowing us to identify stars and estimate galaxy sizes. We also simulate AO images of field galaxies to determine the feasibility of infrared morphological studies at the diffraction limit. With new high order AO systems coming on line with 8-10 meter class telescopes, we believe these observations are invaluable in beginning to study faint galaxy populations at the diffraction limit.
1 Introduction
It has only been very recently, with the help of the Keck Telescopes and the Hubble Space Telescope (HST) that galaxies have been identified which are thought to be producing their first generation of stars. With the high resolution of the HST many of these young galaxies appear to be more numerous and smaller than nearby galaxies (Phillips et al. 1997), and often have a distorted morphology (Driver et al. 1998). Taken together, these attributes suggest that galaxies have gone through a period of significant evolution since their formation.
Optical imaging, however, is biased by the fact that at high redshifts the observed light was emitted in the UV where star forming regions dominate the emission. This can result in a more distorted appearance and give a biased estimate of the morphology. It is probable then, that at least some of the close groupings of optical knots seen in deep HST images may actually be multiple star forming regions within a single galaxy. Infrared cameras can directly image the optical emission from high redshift galaxies and provide a more accurate determination of the galaxy’s morphology. With the NICMOS camera on HST, images of the Hubble Deep Field (Thompson et al. 1999) have shown that for at least some objects, their infrared morphology is in fact smoother and less complex than their optical morphology. High redshift objects are also very small, usually less that one arcsecond in extent, so direct ground based images often yield little morphological information. Even with NICMOS resolutions are limited to about 02 barely resolving many galaxies. What is needed is diffraction limited observations from larger (8-10 m class) ground based telescopes in the infrared.
Adaptive Optics (AO) Systems coupled to new and anticipated infrared instruments will be able to probe the infrared morphologies of distant galaxies in much more detail than previous studies. An intrinsic problem with the earliest form of most high order AO systems, however, is their reliance on bright natural guide stars; often brighter than about 12th magnitude at R. This limitation makes most extragalactic targets unobservable because of their intrinsic faintness and the relative rarity of sufficiently bright nearby guide stars. Recent observations with relatively low Strehl ratios of a few quasars and radio galaxies have been possible with curvature type AO systems due to the ability of these systems to operate at slower speeds and larger effective aperture (Stockton et al. 1999, Hutchings et al. 1999, and Aretxaga et al. 1998). Laser guide stars will partially remedy this problem in a couple of years, but laser systems usually produce lower Strehl ratios than natural guide star systems, so sensitivities and resolution will suffer.
We have developed an interesting new strategy for using natural guide star systems to observe extremely faint galaxies. These observations rely on the high density of galaxies on the sky. Deep infrared surveys (e.g. Djorgovski et al. 1995) have shown that there are about 2x10⁵ galaxies per square degree brighter than K=24 mag. To a limiting magnitude of K=20 this number is down by about a factor of ten to 2x10⁴ per square degree, but this still implies that within 20 arcseconds of ANY guide star there are on average 2 galaxies brighter than K=20 mag and 20 galaxies brighter than 24th magnitude. Recent redshift surveys (e.g. Cohen et al. 1996) have shown that the average redshift of field galaxies brighter than K=20 mag is greater than 0.5 and this should rise at fainter magnitudes. So our strategy is to perform deep infrared imaging around bright (12 mag) A-type stars to identify faint galaxies, then use the much smaller field of view of the AO infrared cameras to image selected galaxies with high Strehl ratio at or close to the diffraction limit.
We present here our first infrared images near five bright stars that are at relatively high galactic latitude, have a relatively blue color (A spectral type), and which pass close to the zenith of the Keck Observatory and other Northen Hemisphere Observatories. We calculate infrared colors for two of the fields, and crude morphologies when possible to allow for better early selection of potentially interesting objects.
| Spectral | Band & | Seeing | ||||||
|---|---|---|---|---|---|---|---|---|
| Object | RA(2000) | Dec(2000) | R (mag) | Type | gb | Exp.Time | FWHM | Date |
| (1) | (2) | (3) | (4) | (5) | (6) | (7) | (8) | (9) |
| ppm 91088 | 01 48 02.12 | +21 48 28.48 | 10.2 | A3 | -39 11 | K - 3060 s | 04 | 10Oct98 |
| ppm 91714 | 02 28 48.09 | +23 52 13.67 | 8.5 | A2 | -33 51 | K - 1080 s | 05 | 06Sep98 |
| K - 540 s | 04 | 08Oct98 | ||||||
| H - 540 s | 05 | 08Oct98 | ||||||
| J - 1080 s | 08 | 08Oct98 | ||||||
| ppm 50296 | 08 02 10.51 | +42 28 29.3 | 9.9 | A5 | +30 29 | K - 1620 s | 04 | 10Oct98 |
| ppm 98537 | 08 16 30.93 | +22 35 03.17 | 10.2 | A0 | +28 15 | K - 1620 s | 07 | 08Oct98 |
| ppm 106365 | 17 47 59.48 | +22 40 14.37 | 10.3 | A2 | +23 35 | K - 1620 s | 05 | 06Sep98 |
| H - 1080 s | 05 | 06Sep98 | ||||||
| J - 1080 s | 06 | 06Sep98 |
2 Observations
We’ve used the Keck Near Infrared Camera (NIRC) to image around a sample of five early-type stars with visual magnitudes between 8.5 and 10.3. A-type stars are preferred because they are relatively blue and thus reduce the amount of scattered and diffracted light in the infrared images as compared to other stars of comparable optical magnitude. O and B type stars are of course bluer, but are relatively rare at high galactic latitudes. The stars were also selected to have low proper motions (001 per year), relatively high galactic latitude (lb20o or lb-20o), and a declination within 5 degrees of Keck’s latitude (but not those passing through the zone of avoidance near the zenith); at certain RA, the galactic latitude constraint forced us further north.
Table 1 gives the list of stars observed along with their coordinates, R band magnitudes, spectral types and galactic latitudes. Also given are the infrared exposure times for each band used (J, H or K), the spatial resolution of the final summed infrared images and the date of the observations. All observations were performed with the Near Infrared Camera (NIRC, Matthews & Soifer 1994) on the Keck I Telescope on the nights of 06 September, 1998 and 08-10 October, 1998. Conditions on each night were clear and photometric. Typical seeing was between 0.4 and 0.7 arcseconds, but was as good as 02 and as bad as 10 during certain short periods.
In each band, many individual frames were taken. For the K band, each frame consisted of 20 coadded exposures of 3 seconds each, except for the observation of PPM91714 on 08 October, 1998 which had 60 coadded exposures of 1 second each. For H, each frame consisted of 60 coadded exposures of 1 second each, and for J, they were 12 exposures of 10 seconds each. Image sequences consisted of a 3 by 3 pattern with a step size of 5” along each axis. This yielded 9 minutes of exposures for each sequence, except for the J band sequences which were 18 minutes for each 3 by 3 grid. For deeper observations, additional 3 by 3 sequences were taken with a small (typically 3”) offset between sequences. Because of the magnitudes of the stars themselves, they always saturated and were positioned at the corner of the array to reduce the effect of electronic bleeding and diffraction spikes within the images. This has the drawback of reducing the amount of the isoplanatic patch that was covered.
The data were reduced with custom IDL routines that medianed images in groups of 9 without aligning the frames in order to make sky and flat fields. Bright objects were masked from the images before producing the skies and flats. Each sky and flat was only used on the central 3 images within the group of 9. This produced very good skies and flats that accurately match the varying sky levels throughout the observation without reducing the observing efficiency by taking separate sky frames. The sky subtracted and flat fielded frames are then aligned to the nearest integer pixel and combined using a clipped mean at each pixel. The final images have very uniform backgrounds and noise consistent with the square root of the number of frames used in each mosaic.
3 Results
Figures 1 through 5 show the images of the stellar fields. They have been stretched very hard to show the faint galaxies in the central, cleanest, parts of the images; this makes the noise at the edges appear artificially extreme. In each case, the noise is consistent with the number of frames contributing at that pixel, except where diffraction spikes or bleeding leave residual images.


In this paper, we have only identified many sigma objects which are clearly real in each field. Table 2 lists the galaxies and gives the galaxy name (specified by the star it is near followed by its relative RA and Dec in arcseconds), average FWHM, infrared magnitudes and angular separation of its guide star. In some of the fields, there were objects that were difficult to identify as either stars or galaxies; in these cases we included all the objects in the list and marked the ones that are ambiguous with a superscript ’a’.


The brightest confirmed galaxy is 16.9 mag in K with a FWHM of 153. The faintest objects identified in each field were typically 21st magnitude in K. Crude morphological types of some of the galaxies can be determined from these observations, including a few galaxies with clear spiral structures. These spiral galaxies are identified with a superscript ’b’ in the table.

3.1 PPM 91088
The field around PPM 91088 is the richest field in terms of resolved galaxies. It has at least 20 galaxies between 17th and 21.5 magnitude (K band) within the slightly less than one square arcminute that is covered by our images. These include four bright disk galaxies: PPM 91088+08+29 (K=19.2 mag and FWHM=094), PPM 91088+01+20 (K=18.5 mag and FWHM=072), PPM 91088-21+18 (K=17.6 mag and FWHM=083), and PPM 91088-26+09 (K=19.3 mag and FWHM=115). The number density is about 50% more than would be expected on average and may indicate weak clustering in this field.
Many of the most interesting galaxies in this field are approximately 20” to 30” away from the guide star. This is not optimal, but it is alleviated in part by the presence of a relatively bright star (PPM 91088-23+12, K=16.2 mag) located at a separation of 260. This star is actually very close to two of the disk galaxies and an AO camera with a field of view on the order of 10” should be able to simultaneously image the psf star and both galaxies. This would allow for very accurate psf determinations and deconvolutions.
3.2 PPM 91714
This field is relatively empty, except for two bright, potentially interacting galaxies and one bright star. The galaxies (PPM 91714+22-19 and PPM 91714+18-16) are roughly 6” apart and the larger of the pair has an asymmetric disk with a full extent of about 5”. The 2nd galaxy, PPM 91714+18-16, is fainter at K=18.1 mag and also shows an asymmetrical extension that points away from the brighter galaxy. If this does represent an interacting system, one might expect to see enhanced star formation potentially in the form of giant star forming regions that could be very compact.
The presence of a bright psf star (PPM 91714+09-19, K=12.6 mag) with a separation comparable to that of the bright galaxies, makes this an efficient field to study. The guide star is also quite bright at R=8.5 mag. Two other fainter objects are located south of the guide star.
3.3 PPM 50296
This is a fairly typical field with seven galaxies brighter than 21.5 mag at K within the field of view. But the field is very notable for the presence of a 16.9 mag disk galaxy; the brightest in any of our five fields. The galaxy (PPM 50296-07-23) is highly inclined and has an extent of about 3”. More significantly, it asymmetrical and has a faint companion (not necessarily physically associated) about 3” to the south-east.
3.4 PPM 98537
PPM 98537 is at a galactic latitude of 28 degrees, and Galactic stars significantly “contaminate” the field. Nevertheless, there is at least one identifiable galaxy in the field (PPM 98537+05+08, K=19.2 mag) which is quite close to the guide star (offset=8.8”) and several fainter objects at separations around 20”.
3.5 PPM 106365
This is the lowest Galactic latitude field in our sample (23 degrees) and it is clearly dominated by Galactic stars. This has one very positive effect in that there are many stars that can provide accurate psf’s simultaneously with each galaxy image. There is of course one negative effect as well, that without very good seeing, it is difficult to identify which objects are very compact galaxies.
| Object Name | FWHM | K Mag | H Mag | J Mag | Separation(”) |
|---|---|---|---|---|---|
| ppm91088+14+13 | 0.53 | 20.00.2 | 18.6 | ||
| ppm91088+10+26 | 0.60 | 20.20.2 | 28.3 | ||
| ppm91088+08+29 bbapparent spiral structure | 0.94 | 19.20.1 | 30.0 | ||
| ppm91088+06+25 | 0.65 | 20.20.1 | 25.3 | ||
| ppm91088+01+20 bbapparent spiral structure | 0.72 | 18.50.1 | 20.5 | ||
| ppm91088-01+18 | 0.84 | 20.50.2 | 17.8 | ||
| ppm91088-03+10 aaunresolved, possible star | 0.58 | 19.30.3 | 10.1 | ||
| ppm91088-05+42 | 0.72 | 20.60.2 | 42.5 | ||
| ppm91088-08+15 | 1.29 | 20.10.1 | 16.9 | ||
| ppm91088-08+45 aaunresolved, possible star | 0.49 | 19.00.1 | 45.7 | ||
| ppm91088-13+20 aaunresolved, possible star | 0.61 | 20.60.2 | 23.9 | ||
| ppm91088-17+29 | 0.59 | 21.60.3 | 33.9 | ||
| ppm91088-19+39 | 0.54 | 20.80.3 | 43.9 | ||
| ppm91088-21+18 bbapparent spiral structure | 0.83 | 17.60.1 | 27.7 | ||
| ppm91088-22+30 | 0.67 | 18.40.1 | 36.9 | ||
| ppm91088-23+12 aaunresolved, possible star | 0.38 | 16.20.1 | 26.4 | ||
| ppm91088-25-04 | 0.55 | 18.10.1 | 24.9 | ||
| ppm91088-25+33 | 0.68 | 21.40.3 | 42.0 | ||
| ppm91088-26+09 bbapparent spiral structure | 1.15 | 19.30.1 | 27.4 | ||
| ppm91088-26+05 | 0.67 | 19.50.1 | 26.4 | ||
| ppm91088-27-11 | 0.57 | 18.50.3 | 29.5 | ||
| ppm91088-32+08 | 0.78 | 19.90.1 | 32.8 | ||
| ppm91088-35+26 | 0.54 | 19.00.1 | 44.0 | ||
| ppm91088-39+14 | 0.50 | 20.30.2 | 41.5 | ||
| ppm91714+22-19 bbapparent spiral structure | 0.62 | 17.00.3 | 17.80.3 | 18.80.3 | 28.9 |
| ppm91714+18-16 bbapparent spiral structure | 0.55 | 18.10.1 | 18.30.1 | 19.60.1 | 24.0 |
| ppm91714+09-19 aaunresolved, possible star | 0.42 | 12.60.3 | 12.80.3 | 13.70.3 | 21.4 |
| ppm91714-01-38 | 0.63 | 19.50.1 | 19.90.1 | 37.8 | |
| ppm91714-11-30 | 0.63 | 20.60.2 | 31.7 | ||
| ppm50296-07-23 bbapparent spiral structure | 1.53 | 16.90.2 | 24.0 | ||
| ppm50296-18+01 | 1.13 | 20.30.2 | 17.8 | ||
| ppm50296-19-04 | 0.49 | 22.20.6 | 19.0 | ||
| ppm50296-25-13 | 0.71 | 20.10.2 | 28.1 | ||
| ppm50296-28-01 | 0.63 | 21.30.3 | 28.2 | ||
| ppm50296-33-14 | 0.69 | 20.20.2 | 35.9 | ||
| ppm50296-37-15 | 0.96 | 20.30.2 | 39.4 | ||
| ppm50296-46-17 | 0.51 | 19.90.2 | 49.1 | ||
| ppm98537+43+13 | 0.96 | 20.10.3 | 44.4 | ||
| ppm98537+43+15 aaunresolved, possible star | 0.64 | 20.40.3 | 45.1 | ||
| ppm98537+37-12 aaunresolved, possible star | 0.64 | 19.20.1 | 38.5 | ||
| ppm98537+33+01 | 0.77 | 19.20.1 | 33.2 | ||
| ppm98537+30+04 | 0.91 | 17.80.1 | 30.6 | ||
| ppm98537+24+23 aaunresolved, possible star | 0.74 | 19.20.1 | 33.2 | ||
| ppm98537+22+30 | 0.78 | 20.50.2 | 37.6 | ||
| ppm98537+22+21 aaunresolved, possible star | 0.73 | 19.60.1 | 30.2 | ||
| ppm98537+18+18 | 1.03 | 20.10.2 | 25.2 | ||
| ppm98537+15+28 aaunresolved, possible star | 0.69 | 19.00.1 | 31.7 | ||
| ppm98537+06+04 | 0.96 | 20.70.3 | 7.5 | ||
| ppm98537+05+08 bbapparent spiral structure | 1.85 | 19.30.3 | 8.8 | ||
| ppm106365+23+05 aaunresolved, possible star | 0.45 | 18.70.1 | 23.2 | ||
| ppm106365+19+09 aaunresolved, possible star | 0.47 | 18.30.1 | 20.7 | ||
| ppm106365+16+17 aaunresolved, possible star | 0.47 | 15.80.2 | 23.4 | ||
| ppm106365+08-21 | 0.58 | 20.70.4 | 22.1 | ||
| ppm106365+07+06 | 0.61 | 19.60.1 | 9.0 | ||
| ppm106365+04+13 | 0.76 | 18.40.1 | 14.1 | ||
| ppm106365-01+10 aaunresolved, possible star | 0.43 | 20.00.2 | 9.5 | ||
| ppm106365-07-13 | 0.79 | 20.40.1 | 15.0 | ||
| ppm106365-07+30 aaunresolved, possible star | 0.50 | 17.70.2 | 31.1 | ||
| ppm106365-09-19 aaunresolved, possible star | 0.45 | 18.20.3 | 18.40.3 | 19.00.3 | 20.5 |
| ppm106365-09+18 aaunresolved, possible star | 0.48 | 16.00.1 | 20.4 | ||
| ppm106365-13-14 aaunresolved, possible star | 0.59 | 20.50.2 | 21.60.4 | 23.20.6 | 19.2 |
| ppm106365-17+10 aaunresolved, possible star | 0.48 | 16.00.3 | 16.10.3 | 16.80.3 | 19.6 |
| ppm106365-20-09 aaunresolved, possible star | 0.42 | 20.70.2 | 20.80.2 | 21.50.2 | 22.0 |
| ppm106365-23+18 bbapparent spiral structure | 1.21 | 17.70.1 | 18.60.1 | 19.60.1 | 29.5 |
| ppm106365-24-27 aaunresolved, possible star | 0.44 | 18.20.1 | 18.20.1 | 18.80.1 | 36.3 |
| ppm106365-24-02 aaunresolved, possible star | 0.46 | 18.60.1 | 18.80.1 | 19.30.3 | 24.1 |
| ppm106365-27-23 aaunresolved, possible star | 0.46 | 18.40.1 | 18.50.1 | 19.30.1 | 35.4 |
| ppm106365-29+07 aaunresolved, possible star | 0.50 | 21.10.3 | 21.20.2 | 22.10.2 | 30.0 |
| ppm106365-29+11 | 0.60 | 18.80.3 | 19.50.3 | 20.60.3 | 31.6 |
| ppm106365-30-15 aaunresolved, possible star | 0.45 | 14.90.1 | 15.00.1 | 15.50.1 | 33.7 |
| ppm106365-30+14 | 1.07 | 19.70.3 | 20.30.3 | 21.10.3 | 32.9 |
| ppm106365-31+04 aaunresolved, possible star | 0.51 | 20.40.2 | 21.30.2 | 21.80.2 | 31.8 |
| ppm106365-32+13aaunresolved, possible star | 0.55 | 21.40.7 | 21.30.4 | 23.20.5 | 34.9 |
| ppm106365-33-06 aaunresolved, possible star | 0.44 | 21.30.4 | 20.60.3 | 21.20.3 | 33.3 |
| ppm106365-33-08 aaunresolved, possible star | 0.47 | 18.60.3 | 18.60.3 | 18.90.3 | 33.7 |
| ppm106365-35-20 aaunresolved, possible star | 0.45 | 18.30.1 | 18.40.1 | 19.00.1 | 40.3 |
| ppm106365-37+05 aaunresolved, possible star | 0.48 | 20.90.3 | 21.40.3 | 22.10.3 | 37.7 |
| ppm106365-39-10 aaunresolved, possible star | 0.48 | 19.30.1 | 19.40.1 | 20.00.1 | 40.2 |
| ppm106365-46-06 aaunresolved, possible star | 0.48 | 20.40.2 | 20.30.2 | 21.40.2 | 46.2 |
4 Galaxy Simulations
An important concern in imaging faint galaxies is sensitivity. In particular, many of these galaxies are difficult to image when most of their light is concentrated in a few pixels, how much more difficult will this be when they are sampled at 002 per pixel? Also for morphological studies, you want not only to detect the galaxy but also measure its brightness over some extended area, or at least determine its size and light profile. Thankfully, the background per pixel also goes down as the square of the pixel scale, so these studies are possible even in the near infrared.


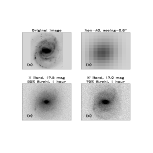
To quantify this, high quality R band images of the nearby spiral galaxy NGC 5371 and the S0 galaxy NGC 4036 were used to create artificial AO images. The R band was selected because it is roughly red shifted to the H band at a redshift of about 1.5, where we might expect to find a significant number of faint galaxies. All simulations assume the Keck Telescope (10 m) with a one hour integration and a camera throughput of 30%; significantly worse than the current non-AO near infrared camera (NIRC, 46% from Matthews & Soifer 1994). It is also assumed that the object can be dithered on chip to generate sky measurements. The simulated backgrounds were 13.7 at H and 12.9 at K’ corresponding to the nominal H band sky background at Mauna Kea, but an increased K’ background (nominal is 13.9) in order to simulate additional thermal emission from the AO system. The Strehl ratio was assumed to be 30% at H with a diffraction limited fwhm of 004 and a halo with a fwhm of 06. For K band, the Strehl was 70% with a core fwhm of 006 and a halo of 06. No deconvolutions were performed on any of the images. Since some galaxies are available with small separations from their potential guide star, no anisoplanatic effects are included. This clearly becomes an important factor as the Strehl ratio declines rapidly beyond 20-30 arcseconds.
NGC 5371 was selected to compare to the resolved galaxies that make up the brightest members of our sample (e.g. PPM 91088-21+18, PPM 91088-25-04, PPM 91714+22-19, PPM 50296-07-23, PPM 106365-23+18). It has a bright central halo and a near face-on spiral disk. The galaxy was resampled onto a 100x100 grid simulating a 2” field of view with 002 /pixel. The visible disk was given an extent of roughly 2”x1” comparable again to our brightest candidates. The total magnitude was set to 17.0 at K’ and 17.5 in H band. Figure 6 shows 4 panels of NGC 5371 under different conditions. Panel (a) is the original image with no noise and essentially 1 pixel resolution. Panel (b) is a simulated image under good seeing conditions (06) but no AO system and no noise. It has a plate scale of 016 per pixel. This panel shows essentially an unresolved object since the central region dominates the light distribution. Panel (c) is the H band simulated image with the AO parameters described in the last paragraph. One bright HII region is visible to the bottom left of the disk, and the disk is easily observed. Little of the spiral structure is apparent in this raw image. Panel (d) is the K band simulation. Both the bright HII region and the spiral arms are easily distinguished. The core is elongated, but not quite enough to distinguish the small central bar present in this galaxy. Figure 7 shows an azimuthally averaged radial profile of the galaxy. The smoother curve is a theoretical fit with a de Vaucouleur’s profile for the bulge and an exponential disk. The effective radii are well determined with rbulge=006 and rdisk=065. Notice that the noise in the radial plot is extremely low even though the signal to noise in each pixel is quite modest.
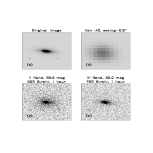
The second galaxy (NGC 4036) was selected to test how well the size and basic morphology could be determined for some of our faintest and smallest candidates. The image was resampled onto a 100x100 pixel grid (002 per pixel) such that its horizontal fwhm was 01 and its vertical fwhm was 008. Its flux was scaled to a 20th magnitude object at K and 20.5 at H. Figure 8 shows the simulated galaxy under four different conditions. Panel (a) is the original with 1 pixel resolution and no noise. Panel (b) shows the unresolved image that is present in any good seeing (06) non-AO image. Panels (c) and (d) show the AO simulations at H and K’ band respectively. Figure 9 shows an azimuthally averaged radial profile of the galaxy. The smoother curve is a theoretical fit with a de Vaucouleur’s profile for the bulge and an exponential disk. The effective radii are well determined with rbulge=005 and rdisk=015.
5 Conclusions
In this paper, we have presented a new strategy for observing faint compact galaxies with a high order AO system. Over 40 galaxies were identified near 5 bright stars, all appropriate candidates for early Adaptive Optics observations with large ground based telescopes. Our simulations demonstrate that typical objects found in the fields are observable and that fundamental galaxy properties such as disk and bulge size can be measured. We believe these observations will greatly facilitate the future diffraction limited observations of faint field galaxies, even with the very limited fields of view of early AO cameras.
References
- (1) Aretxaga, I., Lemignant, D. Melnick, J., Terlevich, R. J., & Boyle, B. J. 1998, MNRAS, 298, 13
- (2) Cohen, J., Hoff, D. W., Pahre, M. A., & Blandford, R. 1996, ApJL, 462, L9
- (3) Djorgovski, S., Soifer, B. T., Pahre, M. A., Larkin, J. E., Smith, J. D., Neugebauer, G., Smail, I., Matthews, K., Hogg, D. W., Blandford, R. D., Cohen, J., Harrison, W., & Nelson, J. 1995, ApJ, 438, 13
- (4) Driver, S. P., Fernandez-Soto, A., Couch, W. J., Odewahn, S. C., Windhorst, R. A., Phillips, S., Lanzetta, K., & Yahil, A. 1998, ApJ, 496, 93
- (5) Hutchings, J. B., Crampton, D., Morris, S. L., Durand, D., & Steinbring, E. 1999, AJ, 117, 1109
- (6) Matthews, K., & Soifer, B. T. 1994, Exp.Ast., 3, 77
- (7) Phillips, A. C., Guzman, R., Gallego, J., Koo, D. C., Lowenthal, J. D., Vogt, N. P., Faber, S. M., & Illingworth, G. D. 1997, ApJ, 489, 543
- (8) Stockton, A., Canalizo, G., & Ridgeway, S. E. 1999, ApJ, 519, 131
- (9) Thompson, R. I., Storrie-Lombardi, L. J., Weymann, R. J., Rieke, M. J., Schneider, G., Sobie, E., & Lytle, D. 1999, AJ, 117, 17