VLT observations of GRB 990510 and its environment ††thanks: Based on observations collected at the European Southern Observatory, Chile, programs 63.P-0003, 63.H-0009, and 63.O-0567 (B).
Abstract
We present BVRI photometry and spectrophotometry of GRB 990510 obtained with the ESO VLT/Antu telescope during the late decline phase. Between days 8 and 29 after the burst, the afterglow faded from = 24.2 to . The spectral flux distribution and the light curve support the interpretation of the afterglow as synchrotron emission from a jet. The light curve is consistent with the optical transient alone but an underlying SN with maximum brightness or a galaxy with (3- upper limits) cannot be ruled out. To a 5- detection threshold of , no galaxy is found within 6” of the transient. A very blue extended object which may qualify as a starburst galaxy is located 12” SE, but at unknown redshift.
Key Words.:
Gamma-rays: bursts - optical radiation – Acceleration of particles – Galaxies: general – Galaxies: starburst – Cosmology: miscellaneous1 Introduction
Gamma-ray bursts (GRBs) have their origin in highly dynamical processes which result in relativistic blast waves (e.g. Piran 1999). The currently best candidates are mergers of compact stars or the collapse of massive stars. The blast wave and its interaction with the surrounding interstellar or circumstellar matter creates an optical afterglow which has been observed for eleven GRBs thus far. For seven of these, the host galaxies have been found and for five the redshift could be measured (Hogg & Fruchter 1999). While the final cataclysms of massive stars occur within or near the host galaxies, less massive systems like binary neutron stars can be expelled from their hosts at large velocities and suffer the merging event at distances from the hosts exceeding a Mpc (Fryer et al. 1999).
GRB 990510 was detected by BATSE, Ulysses, and BeppoSAX as a very bright burst lasting 68 s (see Wijers et al. 1999 for the burst profile and a first summary). The optical afterglow was discovered by Vreeswijk et al. (1999a) and subsequently followed by numerous observers. An early spectrum located the optical transient (OT) at a redshift (Vreeswijk et al. 1999b). GRB 990510 is the first burst to show a clearly defined achromatic break in the optical light curve (Harrison et al. 1999, Israel et al. 1999, Stanek et al. 1999) which was readily interpreted as firm evidence for beaming and a total energy release substantially less than the isotropic value of ergs. In this Letter, we report observations with the ESO VLT of the late decline of the optical afterglow at two epochs.
2 Observations
GRB 990510 was observed with ESO’s Very Large Telescope (VLT) Unit 1 Antu equipped with the Focal Reducer Low Dispersion Spectrograph (FORS1) between May 14 and 18, 1999, and again between June 8 and 11, 1999 (3.8–8.0 and 28.7–31.6 heliocentric days after burst, hereafter HDAB). We performed photometry in the Bessel B,V,R, and the Gunn I bands, supplemented by long-slit spectrophotometry. The scale was 0.2”/pixel in all observations except for the B, R images on June 8, 1999 which were taken in the high-resolution mode of FORS1 with 0.1”/pixel. The data were reduced with standard ESO-MIDAS procedures. Photometry was derived relative to the comparison stars given by Pietrzynski & Udalski (1999), with stars A and B near the optical transient (Fig. 3) serving as secondary standards (Table 1). Due to wind buffeting, the point spread function (PSF) was slightly non-circular in some images, so magnitudes were determined by a special PSF-template routine. Table 1 provides a summary of the observations with times given in heliocentric Julian days (HJD) and HDAB. 1- internal statistical errors are quoted for the photometric magnitudes.
Long-slit spectrophotometry was performed on May 14 and 16, 1999. The slit was oriented at a position angle to include objects C south and A north of the OT (Fig. 3) and, coincidentally, also two M stars 12” north of the OT (, outside of Fig. 3). The late spectroscopy of the OT is reported elsewhere (Vreeswijk et al. 1999).
| Star | B | V | R | I |
|---|---|---|---|---|
| A | ||||
| B | ||||
| C | ||||
| D |
The seeing encountered during the observations was never better than 0.8” (Table 2). This resulted in 5- detection thresholds of = 26.6 on June 8, = 25.6 on May 18, = 26.1 on June 8, and = 25.0 on May 14 and June 11.
3 Results
3.1 Spectrophotometry
Our slit spectra of objects A and C reveal their stellar nature. Object A is a dK star of the disk population. Its brightness (Table 1) places it at a distance of kpc, outside the galactic dust layer. The spectral type implies an intrinsic and , consistent with quoted by Stanek et al. (1999). Object C, initially suspected to be the host galaxy, is pointlike. Its spectrum is included in Fig. 1. The probable presence of Mg I suggests that it is an early dK star at a distance of kpc. The photometry of objects B and D suggests they are stars of spectral types dK5 and dM0, respectively (Table 1).
Figure 1 also shows the extinction-corrected spectrophotometric flux distribution of the OT on HDAB 3.9 when the OT had = 21.98, corrected with = 0.20 (histogram; binned in intervals of 200Å). The solid dots denote the photometric result. For the interval of 4900–9000Å, the flux distribution can be described by a power law with . For higher frequencies, the spectral flux distribution steepens, as noted already by Stanek et al. (1999). The steepening may be intrinsic to the source or indicate additional absorption outside our Galaxy.

3.2 Light curve
Our BVRI photometry provides colour information late in the afterglow which is complementary to the ample information gathered earlier by other observers. Around HDAB 1.5, the light curve was found to change from an early power law with to a steeper power law with index 2.2 (Harrison et al. 1999, Israel et al. 1999, Stanek et al. 1999, and references therein).
In the HDAB 0.6–1.1 interval, i.e. before the break, the OT had colours , and . The early spectral flux distribution was possibly slightly bluer, as judged from the Mt. Stromlo data (Harrison et al. 1999) which yield at HDAB 0.15 and for HDAB 0.4. Throughout the further evolution, however, there is no evidence for a significant change in colours: (i) in the HDAB 1.6–2.0 interval are , and , consistent with the colours before the break; (ii) on HDAB 3.85, well after the brak, our BRI photometry yields and ; and (iii) the latest colour information available, for HDAB 5.7–8.0, yields a mean (all colours derived from magnitudes corrected for long-term trends). These results demonstrate that the decay of the afterglow is achromatic in VRI at least for the interval HDAB 0.6–8.0 and in BVRI for HDAB 0.8–3.9. We feel justified, therefore, in converting all measurements to equivalent -magnitudes and fitting a single grand total light curve (Fig. 2. upper panel). The final mean colours used in this conversion were determined iteratively and are given below.
The errors attached to the individual data points are the statistical errors derived from the noise in the CCD images. Systematic zero point errors are typically quoted as 0.02–0.03 mag, consistent with the internal scatter of mag and the lack of obvious time variability among the 101 (of a total of 163) data points in the HDAB 0.6–1.1 interval. While short term variability is certainly small, a systematic search for such variability among all photometric data is still pending. In order to see if systematic zero point errors affect the fit, we also analysed a data set for which 0.03 mag was quadratically added to the statistical errors before fitting the light curve.

Burst models (Piran 1999, Rhoads 1999, Sari et al. 1999) explain the afterglow as synchrotron emission of shock-accelerated electrons injected into an expanding medium with a power law spectrum . In jet models, the time dependent spectral flux at frequencies below the cooling break varies as , with independent of time and or , depending on, respectively, whether the opening angle of the relativistically beamed radiation early in the expansion, or at later time when the jet has been slowed down ( = opening angle of the jet, = bulk Lorentz factor). We choose a function
| (1) |
to describe the transition between the early and late power laws and , where at the transition time . Eq. (1) was also employed by Rhoads (1999) to parameterise his numerical models and is a more general form of the expressions used by Israel et al. (1999), Stanek et al. (1999), and by Harrison et al. (1999), who assumed and , respectively. Of the five free parameters in Eq. (1) (), the exponent provides a measure of the relative width and the smoothness of the transition from to . The extrapolation of the OT brightness from HDAB to late times will also depend on the choice of .
| Date of | HJD | HDAB | Observ. | Seeing | Filter or | Expos. | Flux rel. to star A | Magnitude | Equiv. R-mag |
|---|---|---|---|---|---|---|---|---|---|
| 1999 | –2451300 | (days) | (arcsec) | Grating | (sec) | (%) | |||
| May 14 | 12.707 | 3.837 | Phot. | 0.8 | R | 300 | |||
| May 14 | 12.716 | 3.846 | Phot. | 0.9 | I | 1200 | |||
| May 14 | 12.730 | 3.860 | Phot. | 1.1 | B | 100 | |||
| May 14 | 12.763 | 3.893 | Spectr. | 0.8 | G300V | 1800 | |||
| 12.789 | 3.919 | Spectr. | 0.8 | G300I/OG590 | 1800 | ||||
| May 16 | 14.731 | 5.861 | Phot. | 1.2 | V | 600 | |||
| May 16 | 14.746 | 5.876 | Spectr. | 1.5 | G150I | 1800 | |||
| May 18 | 16.867 | 7.997 | Phot. | 1.0 | V | 1200 | |||
| June 8 | 37.628 | 28.758 | Phot. | 0.8 | B | 1200 | |||
| June 8 | 37.656 | 28.786 | Phot. | 0.9 | R | 2400 | |||
| June 11 | 40.485 | 31.615 | Phot. | 0.9 | I | 3000 |
We first fit the light curve of the OT using all of the available data up to HDAB 8.0. For the data sets with zero (0.03 mag) systematic errors added, we find , and days. The quoted uncertainties are 1- errors. The fitted shows that the fit to the unaltered data is not perfect, but is acceptable if systematic errors of 0.03 mag are considered (). The observed differs significantly from the value found by Rhoads (1999) when fitting his numerical results, which predict a rather smooth transition. The more abrupt break may be due to the superposition of several effects, as the slowing of the jet and its sideways spread (Harrison et al. 1999). By fitting the shape of the mean light curve to the fluxes in each photometric band we obtain the magnitude normalisations corresponding to the quantities in Eq. 1: , , , and . The corresponding colours are consistent with those for HDAB 0.6–1.1. The lack of substantial colour variations can be seen from the small scatter in the residuals of the best fit (Fig. 2).
For comparison, for fixed at 1.0 we obtain , , days and for a fit to the unaltered data points. Since the errors of the ’s and of are correlated, fixing reduces the errors in the other parameters artificially. Our fit to the light curve with allows us to predict the brightness of the OT at later times with some confidence that uncertainties in the shape of the light curve have been accounted for as far as possible. We predict an OT magnitude of on June 8 (HDAB 28.8), when our BR photometry was performed.
Fruchter et al. (1999) have reported detections with the HST-STIS open CCD on June 8.1 and June 17.9 (HDAB 28.7 and 38.5). Assuming an spectrum, they obtained and , corresponding to and , respectively. Given the red sensitivity of the STIS-CCD, these magnitudes are quite robust. We conclude that our June 8 result and the first of the HST detections are consistent with each other.
Assuming that all photometry including the late data points is that of the decaying OT, we obtain nearly identical light curve parameters: ; . Thus, all of the available photometry is consistent with the light curve of a pure OT.
The observed spectral index and the values of and are in excellent agreement with the theoretical predictions if the cooling break stays at wavelengths shorter than the visual band until HDAB 8.0. The slope of the electron injection spectrum then is in agreement with the conclusions drawn by Harrison et al. (1999) and Stanek et al. (1999).
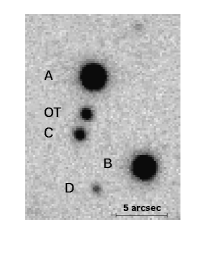
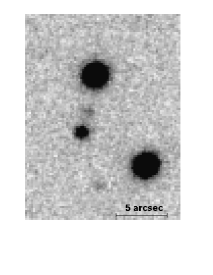
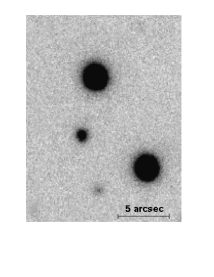
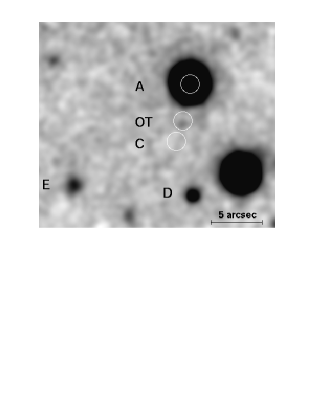
Figures 3a-c depict the late decay of the OT from an equivalent -magnitude of 21.95 (HDAB 3.8) over 23.75 (HDAB 8.0) to 26.4 (HDAB 28.8) (Table 2). Down to the 5- thresholds for a detection at an arbitrary position, and our images show no other object within 6” of the OT, besides the stars A, B, C, and D. The faint emission on June 8 at the OT position is more easily seen when the high-resolution image (0.1” pixels) is slightly smoothed. Figure 3d is an enhanced version of 3c, smoothed with a Gaussian of 0.3” standard deviation and with star C PSF-subtracted. While the emission appears to be slightly offset from the OT position by 0.4” and may signify an underlying object, the shift is within the statistical uncertainty expected for such a faint source.
3.3 The quest for the host galaxy of GRB 990510
Although the light curve analysis does not require another light source in addition to the OT, such contribution can not be excluded. One possibility is that an underlying SN-event contributes to the June 1999 light level. Taking the -band light curve of SN1998bw (Galama et al. 1998, Iwamoto et al. 1998) adjusted to (Bloom et al. 1999) one expects a peak magnitude of (reddened 27.3), just consistent with the 3- upper limit of of the fit [fitted flux relative to star A with R = 19.17 is ]. Forcing the fit to use a peak value of 27.4 results in an increase in from 2.37 to 2.71 and a correlated decrease in from 0.94 to 0.60. Alternatively, the best-fit contribution by an underlying galaxy, which adds a constant to the late-time light curve, yields a 3- upper limit of 27.6 (27.1 de-reddened) [flux relative to star A ]. The forced fit with the 3- upper limit requires and changes nearly identical to those of the corresponding SN fit. We note that many burst models do not require a SN event and that a host fainter than 27 mag presents no problem with the galaxy population responsible for GRBs (Hogg & Fruchter 1999). Fig. 2 shows the fits obtained for the OT alone (early data or all data) and the forced fits with the OT and the 3- upper-limit SN and host contributions added: there is presently no way to distinguish between the three models, but the fact that the early and late OT light curve fits are so similar strongly suggests that we have only seen the OT.
For (Galama et al. 1999) and a standard cosmology with km s-1Mpc-1 and , the distance modulus is 45.2. The de-reddened host magnitude then translates to a restframe for a starburst spectrum similar to NGC 4449 (Bruzual & Charlot 1993) and to for a pure starburst spectrum. Hence, the host is intrinsically faint if at z=1.62. While one might be willing to place the burst at a larger , there is a probable limit from the expected Ly-forest or Lyman-continuum absorption. The lack of a pronounced depression at wavelengths longer than 3600Å (Fig. 1) limits the acceptable redshift to for Ly-forest and to for Lyman-continuum absorption.
The only brighter object possibly related to the OT is the one denoted E in Fig. 3d, 12” to the SE. With a diameter of and its decidedly blue colour it may qualify as a starburst galaxy. Its de-reddened magnitudes and colours are well within the range found for the hosts of other GRBs and OTs, , , , assuming = 0.20. The observed spectral flux distribution is typical of the UV spectrum of a starburst or irregular galaxy (e.g. Bruzual & Charlot 1993). If this is actually a galaxy at , it would be separated by at least 100 kpc from the OT. This would not be a problem if the GRB progenitor were a low-mass system ejected from this galaxy (Fryer et al. 1999). The absence of an associated SN or host galaxy at the OT position would support such a scenario, while the suspected connection of long gamma-ray bursts with massive progenitors does not.
4 Conclusions
The recent observations of the optical transient of GRB 990510 strongly support the synchrotron model for gamma-ray bursts. The pre-break light curve and the Å optical flux distribution are consistent with the adiabatic cooling of relativistic electrons with an injection spectrum with . The steep late decline is a firm indicator of the presence of a slowing jet (Meszaros & Rees 1999, Rhoads 1999, Sari, et al. 1999).
The light level on June 8 is quite consistent with being solely due to the transient, but contributions by either a SN with or a host with (3- upper limits) cannot be ruled out. If located at , the SN could have been nearly as bright as expected from appropriately scaling SN1998bw, while a starburst galaxy as the host would have . Proving the presence or absence of a host galaxy at the OT position or identifying fainter nearby candidates requires additional deep exposures. If ejection of the progenitor of GRB 990510 is considered a possibility, the blue extended object 12” east with de-reddened could be a host candidate.
Acknowledgements.
We thank the ESO staff for the competent performance of part of the observations in TOO service mode and our referee, Ralph Wijers, for his helpful comments. KB thanks Dieter Hartmann for enlightening discussions and comments on GRBs and Wolfram Kollatschny for helpful comments on starburst galaxies.References
- (1) Bloom J.S., Kulkarni S.R., Djorgovski S.G. 1999, Nature, in press (astro-ph/9905301)
- (2) Bruzual G.A. & Charlot S. 1993, ApJ 405, 538
- (3) Fruchter A., Ferguson H., Pepper J. et al. 1999, GCN 386
- (4) Fryer C., Woosley S.E., Hartmann D.H. 1999, ApJ, submitted (astro-ph/9904122)
- (5) Galama T.J., Vreeswijk P.M., van Paradijs J. et al. 1998, Nature 395, 670
- (6) Harrison F.A., Bloom J.S., Frail D.A. et al. 1999, ApJ, in press (astro-ph/9905306)
- (7) Hogg D.W., Fruchter A.S. 1999, ApJ 520, 54
- (8) Iwamoto K., Mazzali P.A., Nomoto K. et al. 1998, Nature 395, 672
- (9) Israel G.L., Marconi G., Covino S. et al. 1999, A&A 348, L5
- (10) Meszaros P., Rees M. 1999, MNRAS, submitted (astro-ph/9902367)
- (11) Pietrzynski G., Udalski A. 1999, GCN 316, 319, 328, and priv. comm.
- (12) Piran T. 1999, Physics Reports 314, 575
- (13) Rhoads, J.E. 1999, ApJ in press (astro-ph/9903399)
- (14) Sari R., Piran T., Halpern J.P. 1999, ApJ 519, L17
- (15) Stanek K.Z., Garnavich P.M., Kaluzny J., Pych W., Thompson I. 1999, ApJ 522, L39
- (16) Vreeswijk P.M., Galama T.J., Rol E. et al. 1999a, GCN 310
- (17) Vreeswijk P.M., Galama T.J., Rol E. et al. 1999b, GCN 324, and paper in preparation
- (18) Wijers R.A.M.J., Vreeswijk P.M., Galama T.J. et al. 1999, ApJ Letters, in press (astro-ph/9906346)