12 (11.03.4 Abell 370; 11.05.2; 11.19.3; 12.03.3; 12.07.1)
J. Bézecourt, bezecour@astro.rug.nl
Lensed galaxies in Abell 370
Abstract
We discuss the statistical properties of faint background galaxies detected in a deep Hubble Space Telescope ultraviolet (F336W) Wide Field Planetary Camera 2 image of the lensing cluster Abell 370 (=0.37). By combining modelled field galaxy counts at this wavelength with a detailed mass model for the cluster, we develop techniques for predicting the expected redshift distribution of lensed sources and find the bulk of the sources should be moderately magnified sources whose redshifts lie between 0.5 and 2. We compare these predictions with redshift estimates derived from the lens inversion method which utilises the shapes of individual arclets in the context of a known field ellipticity distribution. This allows us to infer the comoving star formation rate for the range where there is currently little spectroscopic data. We discuss our results in the context of contemporary pictures for the history of star formation.
keywords:
Galaxies: cluster: individual: Abell 370 – Galaxies: evolution – starburst – Cosmology: observations – gravitational lensing1 Introduction
A detailed understanding of galaxy formation remains a major question of modern cosmology. An important observational indicator is the history and physics of star formation resulting from the induced perturbations of gas clouds in the rapidly evolving gravitational potential. The concept of a single epoch for galaxy formation associated with ”monolithic” collapse models has been replaced by the conviction that galaxies are assembled from smaller structures embedded within merging dark matter halos. If gas cooling is inhibited by various feedback processes, then the cosmic history of star formation will be spread over a wide range in redshift (White & Rees 1978, Baugh et al. 1998). This is consistent with recent high redshift observations (Madau 1999, Madau et al. 1996) although in quantitative detail the results remains controversial because of the different techniques used and the difficulties in quantifying the effect of dust obscuration.
The most commonly used diagnostic for determining the star formation rate within high redshift objects relies on the proportionality between the rest frame UV flux (1500 Å – 2500 Å) and the abundance of short-lived massive stars. Rates derived from the population of Lyman break galaxies (Steidel et al. 1999) can be compared with those from blue-selected intermediate redshift field galaxies in the range (Lilly et al. 1996, Cowie et al. 1999) as well as for observations of nearby galaxies observed at 2000 Å from FOCA, a balloon borne panoramic imaging camera (Milliard et al. 1992, Treyer et al. 1998, Sullivan et al. 1999). The picture emerging from these surveys has the comoving star formation rate rising by a large, but uncertain, factor over 01-2 and possibly declining more slowly at higher redshifts (Steidel et al. 1999). Importantly, the only UV-based constraint on the star formation rate in the region , where the comoving volume-averaged rate apparently peaks, comes from photometric redshift data whose precision is unclear (Connolly et al. 1997).
An independent probe of star formation is based on nebular emission lines measurements. Gallego et al. (1997) undertook an objective prism survey of nearby galaxies and used the H emission line luminosity density to infer a local star formation rate assuming the line is produced by photoionisation of nebular gas by the UV continuum of massive stars (Kennicutt 1998). However, for 0.4, H is shifted beyond reach of most optical spectrographs and searches must be undertaken in the near infrared where detector technology is still rather primitive. Glazebrook et al. (1999) compared estimates of the star formation rate for a small sample of 1 galaxies using both CGS-4 spectroscopy of H and the rest-frame UV continuum. They found significant discrepancies which they attributed to both dust extinction and possible timescale variations in the star formation activity. However, the signal to noise of their infrared spectra precluded a rigorous comparison.
[O ii] is a somewhat less accurate tracer of star formation although available in the optical regime to much higher redshifts than H (Cowie et al. 1995, Guzmán et al. 1997). However, both emission line indicators are prone to uncertainties from the unknown extinction which inhibits the escape of Lyman limit photons (Flores et al. 1999). Recent observations at high in the submillimeter band have emphasised these problems and revealed a potentially separate population of dusty galaxies undergoing intense star formation (Blain et al. 1999, Hughes et al. 1998, Barger et al. 1998). Comoving star formation rates derived from these sub-mm sources are also much higher than those found through the UV continuum methods although uncertainties remain in estimating the bolometric far-infrared flux solely from the sub-mm detections and dust heating may, in many cases, arise from non-thermal UV sources rather than massive stars. Indeed, recent work suggests little disparity between the sub-mm and the Lyman break populations when the various uncertainties are taken into account (Steidel et al., in preparation).
In this paper we explore the possibility of providing new constraints on the UV-based star formation rate by utilising deep lensed images of background galaxies viewed through a well-understood massive cluster. The bonus of using a massive cluster is the significant magnification of those sources viewed through it. The drawback, of course, is that to estimate a comoving star formation rate requires a knowledge of both the redshifts of individual star-forming galaxies (the faint arcs in this case), as well as a good understanding of the survey completeness and lensing mass model, for a detailed study of the magnification variation within the field of view.
Deep spectroscopic surveys of faint arcs have already demonstrated that most lie between redshifts and 2 and several cases exist of more distant, highly-magnified sources (Mellier et al. 1991, Pelló et al. 1999, and other references in Bézecourt et al. 1999). Independent redshift estimates can also be made utilising the fact that the image distortion becomes more significant for a source at higher redshift. By measuring the shape of an arclet it is possible, in the context of a well-constrained mass model for the lensing cluster, to infer a probability distribution for the source redshift by searching for the most circular source corresponding to the observed image (Kneib et al. 1996, Ebbels et al. 1998). Finally multicolour imaging offers a third way of estimating redshift. This has been most successful through the Lyman break surveys (, Steidel et al. 1999) and via photometric redshift surveys up to (Hogg et al. 1998). However, useful constraints in the interval appears to require optical and near infrared data and the predictions, although promising, need to be verified spectroscopically (Pelló et al. 1998).
In this paper, we analyse a deep Hubble Space Telescope (HST) Wide Field Planetary Camera 2 (WFPC2) ultraviolet image (F336W) of the rich cluster Abell 370 () in order to infer the abundance, redshift distribution and intrinsic properties of lensed star forming objects with 111The redshift limit arises from considerations of the location of the Lyman limit. UV imaging is a very efficient way to select background star forming objects as cluster ellipticals disappear in this waveband. Moreover, by comparing the detection of these UV arclets with a deeper sample located in a R (F675W) HST image, it may be possible to infer redshift constraints from both the presence or otherwise of a Lyman break inbetween the two bands.
Section 2 presents the new HST data and discusses the reduction procedures used to construct a photometric catalogue. In Section 3, we discuss the expected number counts and redshift distribution for UV-selected arclets in the specific case of Abell 370 using the evolutionary code and lensing mass model discussed in Bézecourt et al. (1999, hereafter Paper I). The predictions are compared with the observational data. In Section 4, further constraints on the redshifts of individual arclets are derived using a variant of the lensing-inversion method. The results enable us to derive the redshift-dependent comoving star formation rate in Section 5 as well as to compare our estimates with other UV-based values. Our conclusions are summarised in Section 6. Throughout the paper, we adopt a Hubble constant of H, and .
2 Ultraviolet Photometry
The deep ultraviolet image of Abell 370 which forms the basis of this study was obtained with the Hubble Space Telescope (HST) Wide Field Planetary Camera 2 (WFPC2) [ID: 5709, P.I.: J.M. Deharveng]. It was originally taken to study the ultraviolet spectral properties of member elliptical galaxies. For this purpose, exposures were taken with the F336W filter ( = 16.2 ksec) and the F225W filter ( = 11.6 ksec). No objects were detected in the F225W image and thus only the F336W image will be discussed in this paper.
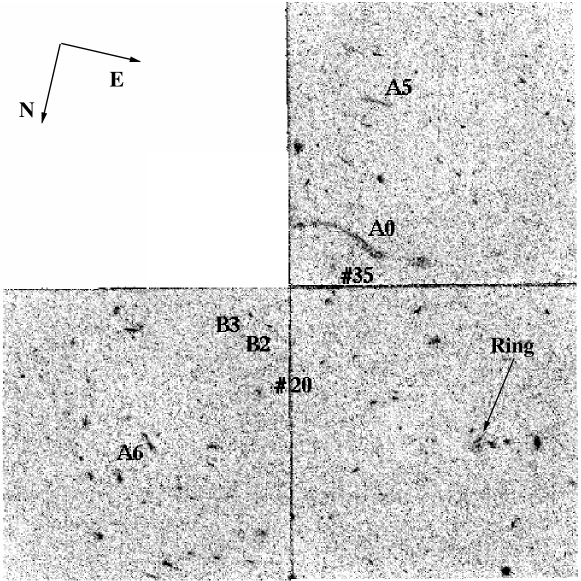
The F336W data was reduced using standard procedures within the IRAF/STSDAS packages. One difficulty that arose was the fact that the individual WFPC2 frames had been binned directly on the telescope. Accordingly, the cosmic ray rejection was slightly sub-optimal. The final reduced F336W image is displayed in Figure 1. Indeed, most of the cluster members are invisible at 336 nm, contrary perhaps to expectations, and the only visible sources appear to be background, lensed star-forming galaxies. Most of the candidate arclets identified in the ground-based study of Fort et al. (1988) are visible in the F336W image. These UV images appear to reveal a significant shear field perpendicular to the axis defined by the two dominant galaxies.
Of these 37 candidates arcs 23 lie inside the F675W field and 22 are detected (not all with ). Although the reverse comparison could potentially be useful in locating candidate F336W ‘dropouts’, unfortunately the UV image is not deep enough to realise this aim. Of 81 candidate arclets identified by Bézecourt et al (1999) in the F675W, 55 are in the F336W field and thus half remain undetected.
Photometry of the detected images was performed using the Sextractor package ([Bertin & Arnouts 1996]) calibrated using zero-points given by Holtzmann et al (1995). Image detection was performed assuming a minimum of 12 contiguous WFPC2 pixels (48 unbinned pixels) above 2 of the local sky level in order to limit the number of spurious objects appearing with the high level of background noise. Although this area limit is somewhat larger than that adopted for the F675W image discussed in Paper I, it is adequate for detecting distorted arclets whose typical areas lie well above this threshold. The adopted 1 surface brightness detection limit is mag arcsec-2 and, from the magnitude histogram obtained from the complete catalogue, we estimate a completeness limit of . As a working hypothesis we will define an arclet as an image whose axis ratio () is larger than 2. The number of arclets with which constitutes our working sample is 37.
3 Model Predictions
3.1 Number-magnitude and number-redshift distributions
Bézecourt et al. (1998) developed techniques capable of predicting both the number-magnitude and the number-redshift distributions of lensed arclets by coupling standard models of galaxy evolution valid in unlensed fields (Bruzual & Charlot 1993 and [Pozzetti et al. 1996]) with the lensing magnifications expected for clusters with detailed mass models. The galaxy evolution models are tested by reproducing, so far as is known, for field galaxies observed in various wavebands. Briefly, the models assume 4 population types, a local luminosity function and two generic models for the evolution depending on the cosmological parameters. The =0 model assumes number-conserving pure luminosity evolution of the form advocated by Pozetti et al. (1996), whereas for =1, number evolution is included. Together with a knowledge of the cluster mass distribution, derived independently from lensing constraints based on series of multiple images with either direct spectroscopy or photometric estimates (c.f. Kneib et al. 1996), the unlensed source counts and redshift distribution can be modified accordingly for comparison with the observations.
This method was applied to the cluster Abell 370 in Paper I (Bézecourt et al. 1999) using an improved lens model constrained by lensed images visible in a HST F675W image (ID: 6003, P.I. : Saglia) and new ground-based spectroscopy. The cluster mass distribution was modelled using a large scale component augmented with smaller scale mass contributions representing the brightest cluster members scaled according to their luminosity ([Kneib et al. 1996]). The intrinsic ellipticity distribution of the faint sources was included in the model predictions. The predicted counts of arclets with 2 agree well with those derived directly from the F675W image. Moreover, the models imply a significant fraction of arclets with have redshifts in contrast to that expected for an unlensed field survey.
We now extend the Abell 370 model developed in Paper I in order to predict the distributions expected for arclets selected at ultraviolet wavelengths. The number magnitude distribution for F336W arclets observed with 2 is compared in Figure 2 to model predictions according to the precepts discussed in Paper I for and 1 as introduced above. It is important to realise that this comparison, whilst useful, is approximate in a number of respects. Firstly, the model predictions do not account for any surface brightness threshold inherent in the actual imaging data and are, instead, based on integrated magnitudes only. Secondly, the lensing magnification is determined statistically assuming a uniform distribution of background sources; for a small sample it is likely there will be significant deviations from the prediction depending on the interplay of source clustering and the large magnification variations across the lens (we will return to this point in §3.2). Finally, the absolute normalisation of the local UV galaxy luminosity function, essential for an accurate comparison, is poorly known. Armand & Milliard (1994) and Fioc & Rocca–Volmerange (1999) have proposed an additional population of star-forming sources in order to account for the FOCA balloon-borne counts of galaxies selected at 2000 Å. The excess population inferred from the FOCA source counts over and above optically-derived estimates amounts to a factor of (Armand & Milliard 1994, Treyer et al. 1998). Such an excess population would significantly improve the comparison in Figure 2 making it reasonable considering the uncertainties.

The predicted arclet redshift distribution based on the statistical lensing expected through the Abell 370 mass model is shown in Figure 3 for a magnitude limit of and an axis ratio limit . The effect of gravitational magnification is clearly visible; below the population is entirely due to unlensed field galaxies. Our selection criteria appear to draw sources primarily with . The decline in numbers at higher redshift arises from the entry of the discontinuity around Ly and later the Lyman break through the F336W filter. A significant advantage of the UV HST image is therefore its ability to select sources in a redshift range which is largely inaccessible via conventional optical spectroscopy. Contrary to the redshift distribution in the R-band (Paper I), there is no strong difference between the two cosmological cases because the redshift range stops at 2.2.
It is important to realise that no internal extinction has been assumed for any of the faint UV sources. Dust extinction is critically important since rest-frame wavelengths of less than Å are implied for . Extinction would reduce the number of arclets observed and, if the effect was more pronounced for high redshift sources, the observed peak of the redshift distribution would shift to lower redshifts. In this respect, modulo the uncertainties in the modelling predictions, our data may provide a sensitive probe of the dust distribution at high redshift.

3.2 The spatial distribution of arclets
We now return to the point raised in 3.1 and consider whether the spatial distribution of arclets within the HST image is consistent with that expected for the adopted mass model given the model parameters and detection limits. Similar comparisons were made for Abell 2218 in Bézecourt et al. (1998) where the methodology is discussed in detail.
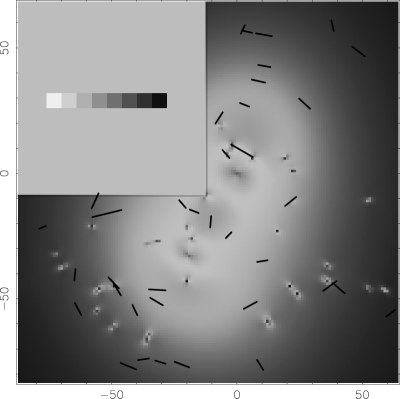
We now apply this procedure to the UV HST image of Abell 370 in order to see where the arclets are expected to lie. The resulting density map is compared to the distribution of the detected arclets in Figure 4. The agreement is fairly reasonable. The giant arc A0 is located close to a fairly high density region and few arclets are found in the low probability areas. The lowest density occurs in the area enclosed by critical lines between and where there is a characteristic depletion in the number counts arising from the so-called magnification bias (Broadhurst 1995, Fort et al. 1996).
Figure 4 can be used to improve the likelihood that an arclet candidate is a true lensed source as well as aiding spectroscopic follow-up surveys. Elongated objects that occur in low probability areas can be rejected in a first step and more attention can be devoted to regions where the probability density that an elongated object is lensed is higher, although the contamination by elongated cluster members will always remain non-zero. Such images will be useful tools for optimal selection of arclets in spectroscopic surveys.
4 Estimating the arclet redshifts
As the strength of gravitational distortion for a particular arclet depends not only on the lensing potential and geometrical alignment but also on the redshifts of the source and lens, it is possible from the deformation properties of a given arclet to derive a probabilistic estimate of the source redshift assuming some distribution for its intrinsic size and shape. The latter can be provided by considering the properties of faint field galaxies observed by HST in unlensed areas. This method was developed by Kneib et al. (1996) and applied in the context of HST data for the cluster Abell 2218. Arclet redshifts, predicted on the basis of a mass model, were later verified successfully through spectroscopic follow-up ([Ebbels et al. 1998]).
In the previous section, we predicted the angular distribution of lensed images from F336W-selected source counts modified by the lensing mass model for Abell 370 (Figure 4). Implicit in this calculation was the redshift distribution expected, statistically, for the source population.
Similarly, it is also possible to compute for each arclet the redshift probability distribution consistent with a lensed image whose orientation and axis ratio matches the observed value. The weighted average of this distribution is then assigned to the arclet as its most probable redshift. The only constraints involved are the deformation vector (c.f. Kneib et al 1996) of the arclet and the limiting magnitude of the sample. This redshift estimate corresponds to an improvement of the method adopted by Kneib et al., as the redshift probability distribution derived from the lensing distorsions is now weighted by that expected for the selected filter and sample magnitude limit. The fact that the arclets are brighter than the limiting magnitude in filter F336W give constraints on their redshift which are then combined with the purely lensing constraints to give a better redshift estimate.
| object | X | Y | a/b | U336W | SFR(1500 Å) | SFR(2000 Å) | other | ||
|---|---|---|---|---|---|---|---|---|---|
| (′′) | (′′) | (M⊙/yr) | (M⊙/yr) | identification | |||||
| 1 | –43.4 | –76.8 | 2.84 | 21.16 | 1.80 | 0.39 | 31.0 | 19.0 | |
| 2 | –22.0 | –76.2 | 4.46 | 22.22 | 1.71 | 0.31 | 6.0 | 3.7 | |
| 3 | 9.3 | –76.4 | 2.44 | 22.40 | 0.34 | 0.21 | 1.1 | 0.69 | |
| 4 | –30.6 | –75.2 | 2.67 | 22.56 | 1.36 | 0.34 | 3.2 | 2.0 | |
| 5 | –37.3 | –74.1 | 2.30 | 22.17 | 0.53 | 0.21 | 2.3 | 1.4 | |
| 6 | 61.3 | –55.7 | 2.66 | 23.14 | 1.65 | 0.44 | 4.6 | 2.8 | |
| 7 | –40.8 | –54.4 | 3.16 | 23.25 | 0.72 | 0.13 | 0.82 | 0.50 | |
| 8 | –63.4 | –54.1 | 2.06 | 21.89 | 1.17 | 0.37 | 6.4 | 3.9 | |
| 9 | 5.3 | –52.6 | 3.31 | 22.37 | 1.03 | 0.15 | 1.3 | 0.81 | |
| 10 | –32.1 | –51.1 | 4.18 | 23.34 | 1.4 | 0.07 | 0.88 | 0.54 | A1 |
| 11 | –31.8 | –46.4 | 2.57 | 21.77 | 0.41 | 0.10 | 2.1 | 1.3 | |
| 12 | –47.8 | –46.2 | 2.38 | 21.99 | 1.23 | 0.32 | 3.0 | 1.8 | |
| 13 | 40.7 | –45.8 | 2.25 | 21.76 | 0.37 | 0.25 | 2.2 | 1.4 | |
| 14 | 37.1 | –44.9 | 3.70 | 22.51 | 1.34 | 0.30 | 3.0 | 1.8 | |
| 15 | –49.2 | –43.6 | 2.73 | 22.29 | 0.69 | 0.09 | 1.6 | 1.0 | |
| 16 | –64.7 | –40.4 | 2.24 | 21.69 | 0.92 | 0.34 | 5.7 | 3.5 | |
| 17 | 10.1 | –35.0 | 2.06 | 22.44 | 0.61 | 0.18 | 1.2 | 0.70 | |
| 18 | –3.3 | –24.6 | 2.10 | 22.91 | 0.28 | 0.11 | 0.49 | 0.30 | |
| 19 | –77.6 | –21.5 | 2.23 | 23.11 | 0.43 | 0.36 | 0.85 | 0.52 | |
| 20 | –10.5 | –19.3 | 4.37 | 23.32 | 1.3 | 0.10 | 3.7 | 2.3 | E2 |
| 21 | –17.1 | –15.1 | 3.14 | 22.89 | 0.806 | 0.002 | 0.40 | 0.25 | B2 |
| 22 | –51.9 | –16.0 | 3.65 | 20.99 | 0.31 | 0.16 | 3.5 | 2.2 | |
| 23 | –21.7 | –12.2 | 2.39 | 22.46 | 0.806 | 0.002 | 0.76 | 0.46 | B3 |
| 24 | –56.6 | –11.0 | 2.27 | 21.63 | 1.06 | 0.33 | 5.7 | 3.5 | |
| 25 | 21.4 | –11.2 | 2.87 | 21.38 | 0.72 | 0.11 | 2.6 | 1.6 | |
| 26 | –4.4 | 7.7 | 4.43 | 23.53 | 0.25 | 0.09 | 0.22 | 0.13 | |
| 27 | 2.0 | 9.0 | 10.0 | 20.07 | 0.725 | 0.001 | 2.3 | 1.4 | A0 |
| 28 | –7.2 | 22.1 | 3.40 | 22.60 | 0.26 | 0.10 | 0.55 | 0.33 | |
| 29 | 10.8 | 55.3 | 4.10 | 22.38 | 1.91 | 0.48 | 6.5 | 4.0 | |
| 30 | 4.3 | 56.4 | 2.29 | 23.48 | 1.17 | 0.35 | 1.3 | 0.78 | |
| 31 | 2.4 | 57.4 | 2.05 | 23.20 | 0.35 | 0.23 | 0.57 | 0.35 | |
| 32 | 38.1 | 58.9 | 3.90 | 23.46 | 0.35 | 0.16 | 0.45 | 0.28 | |
| 33 | 3.0 | 27.3 | 2.48 | 23.35 | 0.60 | 0.09 | 0.41 | 0.25 | |
| 34 | 27.0 | 27.8 | 2.60 | 22.86 | 0.97 | 0.23 | 1.3 | 0.79 | |
| 35 | 8.5 | 36.8 | 2.82 | 22.64 | 0.84 | 0.14 | 1.3 | 0.78 | |
| 36 | 10.9 | 42.8 | 5.0 | 21.58 | 1.3 | 0.26 | 4.2 | 2.6 | A5 |
| 37 | 48.5 | 48.6 | 2.35 | 22.23 | 1.81 | 0.53 | 14.3 | 8.8 |
∗X,Y positions are defined with respect to galaxy # 20.
The redshifts for A0, A1,A5,B2, B3 and E2 are taken from Soucail et al. (1988), Bézecourt et al. (1999) and Mellier et al. (1991).
Star formation rates were computed from the luminosity at 2000 Å according to the Donas et al. (1990) calibration and at 1500 Å according to the Madau et al. (1998) calibration
The lens inversion redshifts range from 0.3 to 1.9 for the objects in the sample (Table 1). We compare these estimates with the redshift distribution derived via the models discussed in Section 3 in Figure 5. As found by Ebbels et al. (1998), redshift estimates are less secure where the lensing power is small which may explain some of the differences seen. Even allowing for the difference in absolute numbers discussed earlier (c.f. Figure 2), at low redshift, the lensing method predicts a significant excess of galaxies over the model predictions. This is, in part, due to the excess UV counts discussed earlier. It would seem most of this excess lies at low redshift as discussed by Treyer et al. (1998). There is also a discrepancy beyond where the model predicts a tail not seen in the lensing-inferred distribution. Again, as discussed earlier, there are many reasons why the modelled overestimates the mean redshift of the F336W population. Considering the uncertainties, the distribution of arclet redshifts in the important region is reasonably well matched.

5 Cosmic star formation rates
The redshift distribution of UV-selected arclets discussed in Section 4 enables us to estimate the volume-averaged star formation rate as a function of redshift in an important interval independently of methods used by other workers. By selecting arclets at F336W, our observations span a much shorter rest-frame wavelength range ( 1200–2200 Å typically) than in other studies of high redshift galaxies and consequently are more sensitive to both star formation activity and dust extinction.
To estimate the star formation rate, we adopt a proportionality between the UV ionizing flux emitted by massive and short-lived stars which has been calibrated by several authors. Donas et al. (1990) used direct UV observations of local galaxies at 2000 Å and give the relation
| (1) |
whereas Madau et al. (1998) use the scaling relation at 1500 Å
| (2) |
where is a conversion factor which depends on the choice of the initial mass function (IMF): for a Salpeter IMF and for a Scalo IMF. Note that there is a factor 2 of difference in this conversion depending on the choice of the IMF. To be consistent with other authors, we will consider a Salpeter IMF in the following and adopt .
5.1 Methodology
Using the redshift assigned to each arclet, the rest-frame luminosity (in erg s-1 Å-1) at a given wavelength (1500 or 2000 Å for our purpose) becomes:
| (3) |
where is the differential k-correction necessary to convert the rest-frame flux at Å to Å or 2000 Å:
The differential k-correction is small, and consequently not too model dependent because, for , the rest-frame wavelength of the F336W filter always lies close to the selected UV wavelength. The correction was determined using the model spectral energy distribution of a typical star-forming Sd galaxy.
is the luminosity distance at redshift and is the magnification factor of the arclet derived from the mass model for Abell 370.
If we remove from the sample given in Table 1 all arclets whose lensing-inferred redshift indicates (i.e. the inversion method suggests they are either cluster members or foreground galaxies) as well as one arc which is a double image (B2/B3), we have 28 arclets. This residual sample can be divided into two bins with similar numbers: 13 arclets in the redshift interval (Bin 1) and 15 arclets in the interval (Bin 2).
We recall that our sample is limited to arclets with an axis ratio larger than 2 in order to increase the probability that they are background sources. This means that the galaxies we study are drawn from a volume which is not necessarily that defined simply according to a fixed F336W magnitude limit. In effect the volume probed corresponds to the integral with redshift of the area in the source plane (at a given redshift) which magnifies arclets to an axis ratio , :
The corresponding volumes are respectively [0.4,1] = 1130 Mpc3 and [1,2] = 2910 Mpc3.
5.2 Star formation rates
Given the above procedures we can infer the mean star formation rates for individual arclets and compare these with those derived for other high redshift sources. Figure 6 shows the trend with redshift using the Donas et al. (1990) relation to convert the 2000 Å luminosity. The distribution shows a modest increase of the SFR across the two broad redshift bins whose significance is discussed below.

The mean star formation rate per object for our arclet sample is 2.5 M⊙/yr. Using the Madau et al. relation would increase this to 4 M⊙/yr (Salpeter IMF) or 9.3 M⊙/yr (Scalo IMF). Such star formation rates are consistent with those inferred for arcs seen in other clusters (e.g. in Abell 2390 [Bézecourt & Soucail 1997]) as well as for other UV-selected sources at higher redshift (Steidel et al. 1999).
In order to address the possible increase in mean star formation rate with redshift apparent in Figure 6 as well as to compute the redshift-dependent comoving star formation rate, we need to estimate the incompleteness correction in both bins. The most direct way, following Lilly et al (1996) and Connolly et al (1997), is to compare our equivalent luminosity function at 2000Å with the one spectroscopically determined at low redshift () by Treyer et al. (1998) and correct for that fraction of sources fainter than the limit appropriate at a given redshift. Adopting the Treyer et al. 2000Å Schechter luminosity function whose faint end slope is we derived correction factors of 1.6 for Bin 1 and 2.1 for Bin 2. The uncertainty depends primarily on the slope of the faint end of the luminosity function which is, of course, not yet constrained at the redshifts in question. Had we adopted Lilly et al.’s slope of the correction factors would have been reduced to 1.2 for Bin 1 and 1.4 for Bin 2. This gives some measure of the uncertainties involved.
Applying this correction, we show the comoving star formation rate, uncorrected for possible extinction effects, in Figure 7 for our two redshift intervals. The inevitably larger incompleteness correction for Bin 2 strengthens the increase of SFR with redshift seen in Figure 6 although the statistical uncertainties clearly are large. For convenience we show the effect of using both the Donas et al. (1990) and Madau et al. (1998) conversions (which differ by a factor of 1.6). Other UV-based measurements are shown in order to allow a consistent comparison between different samples with roughly similar extinction bias.
The absolute value of the star formation density remains unclear in all the surveys compared because of the high sensitivity of the UV to SFR conversion to the initial mass function and because of the damaging effect of even modest amounts of dust extinction. For an extinction of 1.2 magnitudes at 2000 Å (as argued by Buat & Burgarella (1998) on the basis of a sample of starburst galaxies) the corrected rates would be twice as high. Evidence for significant extinction has also been given by Fanelli et al. (1996), who discuss a discrepancy of a factor 2.5–9 between rates derived in the UV (1500 Å) and the far-infrared. Yan et al. (1999) also find a discrepancy factor of 3 between H-based rates and those from the continuum at 2800Å in the redshift range .
Glazebrook et al. (1999) argue that part of the discrepancy between -based star formation rates and those utilising the UV continuum may arise, in small samples, from the different timescales of main sequence evolution involved. Sullivan et al (1999) undertook a detailed comparison for a large sample of UV-emitting galaxies with for which measures were simultaneously available. A significant fraction of the dispersion in the UV-H luminosity correlation arises from such effects. In principle, dust extinction could be calibrated for many of the arclets observed here through multi-object near-infrared spectroscopy of the Balmer lines which may become practical shortly on large telescopes. Gravitationally lensed arcs represent a highly practical alternative to normal field galaxies for such probes of the intrinsic star formation rate because of their high surface density and the fact that lensing constrains their redshift in addition to photometric techniques useful for field galaxies.

6 Conclusions
Using the combination of models for galaxy evolution introduced in Bézecourt et al (1999, PaperI) and a mass distribution for cluster Abell 370 constrained by recent lensing studies, we discuss the statistical properties expected for a lensed sample of faint arclets in a deep Hubble Space Telescope image taken using the F336W filter with the Wide Field Planetary Camera 2. By comparing predicted source counts and their redshift distribution with the spatial distribution and numbers of observed arclets in the HST image, we conclude that the bulk of the UV sources seen are gravitationally lensed and lie in the redshift range 0.5–2. As such they offer a novel probe of the star formation history in this relatively unexplored redshift range.
Using the observed shape of each arclets in the context of the adopted mass model, we derive its most likely redshift using a modified version of the lensing inversion technique developed by Kneib et al. (1996). We compare the inversion-based redshift distribution with that predicted on the basis of the evolutionary models and find general agreement at high redshift although it seems a significant fraction of UV sources represent an excess of low redshift star forming sources consistent with the survey of Treyer et al. (1998).
Assuming an incompleteness correction based on the steep UV luminosity function observed for , we derive star formation densities consistent with other UV-based estimates. The typical arcs seen in our sample imply star formation rates, uncorrected for internal extinction, of a few yr-1.
The spectroscopic follow up of deeper UV-based arclet samples would permit tighter constraints through comparisons of H-based star formation rates and corrections for extinction based on Balmer line ratios. The high surface density of magnified sources seen through rich clusters with well-constrained mass distributions offers significant advantages for probing the star formation characteristics in the regime over traditional field surveys.
Acknowledgements.
We thank R. Pelló for fruitful discussions and encouragement, in particular about photometric and lensing-based redshift techniques. This research has been conducted under the auspices of a European TMR network programme (Contract No. ERBFMRX-CT97-0172) made possible via generous financial support from the European Commission (http://www.ast.cam.ac.uk/IoA/lensnet/) and through support of the Programme National de Cosmologie and CNRS.References
- [Armand & Milliard 1994] Armand C. & Milliard B., 1994, A&A, 282, 1
- [Barger et al. 1998] Barger A.J., Cowie L.L., Sanders D.B., Fulton E., Taniguchi Y., Sato Y., Kawara K., Okuda H., 1998, Nature, 394, 248
- [Baugh et al. 1998] Baugh C.M., Cole S., Frenk C.S., Lacey C.G, 1998, ApJ, 498, 504
- [Bertin & Arnouts 1996] Bertin E. & Arnouts S., 1996, A&AS, 117, 393
- [Bézecourt & Soucail 1997] Bézecourt J. & Soucail G., 1997, A&A, 317, 661
- [Bézecourt et al. 1998] Bézecourt J., Pelló R., Soucail G., 1998, A&A, 330, 399
- [Paper I] Bézecourt J., Kneib J.-P., Soucail G., Ebbels T.M.D. (Paper I), 1999, A&A, 347, 21
- [Blain et al. 1999] Blain A.W., Smail I.R., Ivison R.V., Kneib J-P., 1999, MNRAS, 302, 648
- [Broadhurst 1995] Broadhurst T.J., 1995, astro-ph/9511110
- [Bruzual & Charlot 1993] Bruzual G.A. & Charlot S., 1993, ApJ, 405, 538
- [Buat & Burgarella 1998] Buat V. & Burgarella D., 1998, A&A, 334, 772
- [Connolly et al. 1997] Connolly A.J., Szalay A.S., Dickinson M., SubbaRao M.U., Brunner R.J., 1997, ApJ, 486, 11
- [Cowie et al. 1995] Cowie L.L, Hu E.M., Songaila A., 1995, Nature, 377,603
- [Cowie et al. 1999] Cowie L.L., Songaila A., Barger A., 1999, AJ, in press (astro-ph/9904345)
- [Donas et al. 1990] Donas J., Buat V., Milliard B., Laget M., 1990, A&A, 235, 60
- [Ebbels et al. 1998] Ebbels T.M.D., Ellis, R.S., Kneib J.–P., Le Borgne J.F., Pelló R., Smail I.R., Sanahuja B., 1998, MNRAS 295, 75
- [Fanelli et al. 1996] Fanelli M.N, Stecher T.P., the UIT Science Team, 1996 “Star Formation Near and Far”, Proceedings of the 7th annual Astrophysics Conference in Maryland, astro-ph/9612086
- [Flores et al. 1999] Flores H., Hammer F., Thuan T.X., Césarsky C., Désert F.X., Omont A., Lilly S.J., Eales S., Crampton D., Le Fèvre O., 1999, ApJ, 517, 148
- [Fioc and rocca–Volmerange 1999] Fioc M. & Rocca–Volmerange B., 1999, A&A, 344, 393
- [Fort et al. 1996] Fort B., Mellier Y., Dantel-Fort M., 1996, A&A, 321, 353
- [Fort et al. 1988] Fort B., Prieur J.L., Mathez G., Mellier Y., Soucail G., 1988, A&A, 200, L17
- [Gallego et al. 1997] Gallego J., Zamorano J., Aragón-Salamanca A., 1995, ApJL, 445, L1
- [Glazebrook et al. 1999] Glazebrook K., Blake C., Economou F., Lilly S., Colless M., 1999, MNRAS, 306, 843
- [Guzmán et al. 1997] Guzmán R., Gallego R., Koo D.C., Phillips A.C., Lowenthal J.D., Faber S.M., Illingworth G.D., Vogt N., 1997, ApJ, 489, 559
- [Hogg et al. 1998] Hogg D.W., et al., 1998, AJ, 115, 1418
- [Holtzman et al. 1995] Holtzman J.A., Burrows C.J., Casertano S., Hester J.J., Trauger J.T., Watson A.M., Worthey G., 1995, PASP 107, 1065
- [Hughes et al. 1998] Hughes D., Serjeant S., Dunlop J., Rowan-Robinson M., Blain A., Mann R.G., Ivison R., Peacock J., Efstathiou A., Gear W., Oliver S., Lawrence A., Longair M., Goldschmidt P., Jenness T., 1998, Nature, 394, 241
- [Kennicutt 1998] Kennicutt R.C., 1998, ARA&A, 36, 189
- [Kneib et al. 1996] Kneib J.–P., Ellis R.S., Smail I., Couch W.J., Sharples R.M., 1996, ApJ, 471, 643
- [Lilly et al. 1996] Lilly S.J., Le Fèvre O., Hammer F., Crampton D., 1996, ApJ, 460, L1
- [Madau 1999] Madau P., 1999, in VLT Opening Symposium, ESO Publications in press (astro-ph/9907268).
- [Madau et al. 1998] Madau P., Pozzetti L., Dickinson M., 1998, ApJ, 498, 106
- [Madau et al. 1996] Madau P., Ferguson H.C., Dickinson M.E., Giavalisco M., Steidel C.C., Frutcher A., 1996, MNRAS, 283, 1404
- [Milliard et al. 1992] Milliard B., Donas J., Laget M., Armand C., Vuillemin A., 1992, A&A, 257, 24
- [Mellier et al. 1991] Mellier Y., Fort B., Soucail G., Mathez G., Cailloux M., 1991, ApJ, 380, 334
- [Pelló et al. 1999] Pelló R., Kneib J.P., Le Borgne J.F., Bézecourt J., Ebbels T.M., Tijera I., Bruzual G.A., Miralles J.M., Smail I., Soucail G., Bridges T.J., 1999, A&A, 346, 359
- [Pelló et al. 1998] Pelló R., Kneib J.P., Bruzual G.A., Miralles J.M., 1998, in “The Birth of Galaxies”, 10th Rencontres de Blois, June 1998, Editions Frontières, astro-ph/9809151
- [Pozzetti et al. 1996] Pozzetti L., Bruzual G.A., Zamorani G., 1996, MNRAS, 281, 953
- [Soucail et al. 1999] Soucail G., Kneib J.P., Bézecourt J., Metcalfe L., Altieri B., Le Borgne J.F., 1999, A&A, 343, L70
- [Soucail et al. 1988] Soucail G., Mellier Y., Fort B., Mathez G., Cailloux M., 1988, A&A, 191, L19
- [Steidel et al. 1999] Steidel C.C., Adelberger K.L., Dickinson M., et al., 1998 in The Birth of Galaxies, 10th Rencontres de Blois, Editions Frontières, astro-ph/9812167
- [Sullivan et al. 1999] Sullivan M., Treyer M.A., Ellis R.S., et al., 1999, MNRAS, submitted
- [Treyer et al. 1998] Treyer M.A., Ellis R.S., Milliard B., Donas J., Bridges T.J., 1998, MNRAS, 300, 303
- [White & Rees 1978] White S.D.M., Rees M.J., 1978, MNRAS, 183, 341
- [Yan et al. 1999] Yan L., Mc Carthy P.J., Freudling W., Teplitz H.I., Malumuth E.M., Weymann R.J., Malkan M.A., 1999, ApJL, 519, 47