Interstellar extinction towards the inner Galactic Bulge††thanks: Based on observations collected at the European Southern Observatory, La Silla Chile
Abstract
DENIS observations in the J (1.25 m) and (2.15 m) bands together with isochrones calculated for the RGB and AGB phase are used to draw an extinction map of the inner Galactic Bulge. The uncertainty in this method is mainly limited by the optical depth of the Bulge itself. A comparison with fields of known extinction shows a very good agreement. We present an extinction map for the inner Galactic Bulge ()
Key Words.:
stars: RGB and AGB -stars: infrared, extinction-ISM, stars - Galaxy: Bulge1 Introduction
Studying the stellar populations in the Galactic Bulge requires knowledge of the interstellar extinction. Previous studies (e. g. Catchpole et al. Catchpole90 (1990), Frogel et al. Frogel99 (1999), Unavane et al. Unavane98 (1998)) have shown that it can vary from up to towards the Galactic Centre region. As in most parts of the Galactic Bulge, interstellar absorption is not homogeneous but occurs in clumps, a detailed extinction map of the Bulge is therefore essential.
Catchpole et al. (Catchpole90 (1990)) mapped the interstellar extinction around the Galactic Centre () using the red giant branch of 47 Tuc as a reference. Stanek et al. (Stanek96 (1996)) mapped the interstellar extinction of Baade’s window using OGLE photometry of red clump stars. Frogel et al. (Frogel99 (1999)) determined the interstellar reddening for a few fields in the inner Galactic Bulge using the red giant branch of Baade’s window as a reference. values ranging from 0.27 up to 2.15 mag were found by the latter.
The DENIS survey (Epchtein et al. Epchtein97 (1997), Persi et al. Persi95 (1995)) with 2MASS (Skrutskie et al. Skrutskie97 (1997)) is the first attempt to carry out a complete survey of the southern sky. The limiting magnitudes in the three near-IR photometric bands (I = 0.8 m, J = 1.25 m and m) for point sources are , and respectively. The photometric accuracy (rms) is better than 0.1 mag and the astrometric accuracy better than 1 arcsec. These numbers are for uncrowded fields.
DENIS colour magnitude diagrams (CMDs) in regions of low extinction show a well defined RGB and AGB sequence in the Galactic Bulge (see Fig. 1). Due to their high luminosities (up to for non-saturated sources in DENIS) these stars are ideal tracers of the stellar populations in the Bulge and are found even in highly extincted regions. In this paper we present a method to derive interstellar extinction using isochrones from Bertelli et al. (Bertelli94 (1994)) in combination with DENIS CMDs. We show that this method is appropriate for low as well as for highly extincted regions. Finally we present a map of the extinction in the inner Bulge between -88 and -1.5b. The finer details of the features seen in the map will be discussed in a subsequent paper.
2 Observations
The near infrared data were acquired in the framework of the DENIS survey, in a dedicated observation of a large Bulge field, simultaneously (Summer 1998) in the three usual DENIS bands, Gunn-I (0.8 m), J (1.25 m) and (2.15 m). For the source extraction we used PSF fitting optimised for the crowded fields (Alard et al. in preparation). For the astrometry, the individual DENIS frames were cross-correlated with the PMM catalog (USNO-A2.0). The absolute astrometry is then fixed by the accuracy of this catalog ( 1”). The internal accuracy of the DENIS astrometry, derived from the identifications in the overlaps is of the order of 0.5”.
For the determination of the zero point all standard stars observed in a given night have been used. The typical uncertainty of the zero points has been derived from the overlapping regions and is about 0.05, 0.15 and 0.15 mag in the I,J and bands respectively.
3 Extinction determination using isochrones
Colour-Magnitude Diagrams were constructed for sources in a small window (radius of 2 arcmin) in the field. The modal value of the distribution of the required to move the stars in the CMD to the zero extinction isochrone was taken as the value of the extinction for this window. The interstellar extinction law () from Glass (Glass99 (1999)) was used. The window was then displaced laterally in uniform steps to construct an image of the spatial distribution of the extinction over the whole field. We have found that towards the Galactic Bulge a sampling window of radius 2 arcmin provides a sufficient number of stars to form a sequence enabling a reliable estimate of the extinction in such a window. We presently do not use the DENIS data with due to the saturation of the detectors. We only use those sources which have been detected in J as well as in with brighter than 11 mag in order to be as complete as possible in J. This criterion is also quite important in order to rule out fake sources at the fainter end of the luminosity function and to guarantee an RGB/AGB identification. However, in the regions with very high extinction () we find that a large proportion of the sources detected at do not have counterparts at the shorter wavelengths. The location of these ’missing’ J sources is concentrated in regions with high extinction (). Hence for regions with large extinction, where the number of sources detected with the above criterion is smaller than in regions with lower extinction, we only get a lower limit on the extinction.
Results with such a sampling window and with displacement steps of 1 arcmin are discussed below.
Isochrones from Bertelli et al. (Bertelli94 (1994)) placed at 8 kpc distance for a 10 Gyr stellar population with Z=0.02 has been used as a reference system. The isochrones were calculated for the ESO filter system by convolving the near-infrared bands with the spectral energy distributions from Kurucz (Kurucz92 (1992)) for temperatures higher than 4000 K. At lower temperatures the effective temperature scale from Ridgway et al. (Ridgway80 (1980)) for the late M giants and the Lançon & Rocca-Volmerange (1992) scale for the early M giants has been used. The lack of very red standards limits the near-infrared colour transformation (Bressan & Nasi Bressan95 (1999)) and causes the colours of the Z=0.02 isochrone to ’saturate’ around . Therefore a new, empirical -(J–K) colour relation has been derived by making a fit through the data available for cool giants [see Schultheis et al. Schultheis98 (1998) and Ng et al. (in preparation)]. Schultheis et al. (Schultheis98 (1998)) demonstrated the good agreement of the isochrones with the new -colour relation using NIR photometry of a sample of Miras and Semiregular Variables in a field located at the outer Bulge. However, the upper part above the RGB tip () remains nevertheless more uncertain.
Based on observed near infrared spectra for a sample of M giants and Mira Variables, kindly provided by A. Lançon, we have found the difference between K and to be small, in the order of 0.04-0.05 mag.
3.1 Uncertainties of the isochrone method
Figure 1 shows a DENIS CMD in a part of the Baade’s Window (SgrI, ). Overlaid are the isochrones with different metallicities (for ). The isochrone with Z=0.02 is found to follow well the observed CMD and is shown at and also at which is the modal value of the extinction found for the field.
It is a well known fact that in the Galactic Bulge one deals with a wide metallicity and age range. Using isochrones with a different Z would give us different extinction values. In order to estimate the effect of metallicity on the derived extinction values, isochrones with Z=0.05 and Z=0.008 have been considered. Between the isochrone with Z=0.008 and Z=0.05 there is a (see also e. g. Bressan et al. Bressan98 (1998)) which corresponds to a . This is the typical uncertainty in the determination of the extinction assuming solar metallicity. In contrast to the effect of metallicity the isochrones are hardly affected by an age-range (see e. g. Schultheis et al. 1998).


Analysis of repeated observations (1996 & 1998) shows that the internal dispersion in the photometry, in the crowded regions, is less than 0.15 mag for . Compared to the distance spread of the Galactic Bulge () the errors in the photometric accuracy as well as the errors coming from the isochrones are negligible.
3.2 CMDs in sampling windows
In Figure 2 we show the CMDs for sampling windows at three different locations, namely a field with low extinction in Baade’s window, one with intermediate extinction at and and one at the Galactic Centre (). The low extinction field considered here is a small part of the Sgr I field whose CMD is presented in Figure 1. While the RGB/AGB branch in Baade’s window shows a narrow RGB/AGB sequence, for the two other fields one sees clearly a wide spread in the colour. The Baade’s window is known to have low and well behaved extinction and this is seen as a sharp peak in the distribution of (figure 2). For the field at and around the Galactic Centre one does not find a single well defined peak but perhaps two different peaks which indicates that there maybe two or more distinct layers of extinction causing material along this line of sight. Alternatively the absorbing matter may show clumpiness on a scale smaller than the 4 arcminute diameter of the sampling window. As mentioned earlier, our J and K detections are complete in regions with low extinction (up to ) and a large proportion of K sources do not have J counterparts (up to 60-90%) in the regions with high extinction (GC). It is unfortunately not possible to use the results from the regions with low extinction to assign a completeness limit for the obscured ones because the controlling factors are confusion in the first case and the detector sensitivity in the second. A map of the ’missing’ J sources shows that they are a significant source of uncertainty in regions with .
4 Results
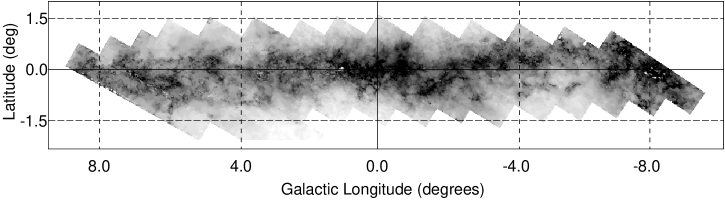
The whole map for the inner Galactic Bulge is shown in Fig. 3. The map has a resolution of 4 arcminutes (the diameter of the sampling window used). Note the clumpy and filamentary behaviour of the distribution of extinction especially close to the Galactic plane. There are also small pockets with uniform extinction of about magnitudes (for example the ISOGAL field studied by Omont et al. 1999). Table 1 gives the values of the mean extinction in various locations in the inner Bulge. The distribution of extinction along the line of sight through the Bulge will be discussed in detail in a subsequent paper (Ganesh et al in preparation).
| 6.8 | 8.9 | 12.0 | 11.9 | 13.7 | |
| 11.7 | 16.3 | 25.7 | 22.8 | 11.6 | |
| 14.7 | 10.9 | 10.9 | 13.5 | 7.7 |
In Fig. 4 we present a contour map of the extinction around the Galactic Centre. The distribution of extinction in this region has been studied earlier by Catchpole et al (Catchpole90 (1990)) using H&K data. We find a good agreement in the observed structures keeping in mind the higher resolution results presented here. The difference in compared to Catchpole et al. is typically smaller than 3. The average interstellar extinction along the Galactic plane (see Fig. 4) is in although this might be a lower limit (as seen by the presence of patches with ) due to the effect of the ’missing’ J sources discussed earlier. Along the minor axis the decreases to towards the edges, starting from nearly near the Centre. The derived extinction values from Fig. 4 are also qualitatively in agreement with the values found by Wood et al. (1998) near the Galactic Centre.

5 Conclusion
DENIS observations in the J and band together with isochrones by Bertelli et al. (Bertelli94 (1994)) are an excellent tool to map the interstellar extinction. A comparison with the field studied by Catchpole shows a very good agreement although we see more details due to the better resolution. Several fields with relatively low () and homogeneous extinction can be identified on the basis of the extinction map. This identification should help further detailed investigation of the stellar population in these windows. A study of the three-dimensional distribution of the material responsible for the interstellar extinction should be facilitated by the availability of the extinction map.
Acknowledgements
We want to thank I. S. Glass, J. van Loon and Y. K. Ng for useful discussions. The referee,
G. P. Tiede, is thanked for useful comments and suggestions. SG was supported by a fellowship from the Ministére des
Affaires Etrangeŕes, France. MS acknowledges the receipt of an ESA
fellowship.
The DENIS project is partially funded by European
Commission through SCIENCE and Human Capital and Mobility plan grants.
It is also
supported, in France by the Institut National des Sciences de l’Univers,
the Education Ministry and the Centre National de la Recherche Scientifique,
in Germany by the State of Baden-Würtemberg, in Spain by the DG1CYT, in Italy
by the Consiglio Nazionale delle Ricerche, in Austria by the Fonds zur Förderung
der wissenschaftlichen Forschung und Bundesministerium für Wissenshaft und
Forschung, in Brazil by the Foundation for the development of Scientific
Research of the State of Sao Paulo (FAPESP), and in Hungary by an OTKA grant
and an ESOC&EE grant.
References
- (1) Bertelli, G., Bressan, A., Chiosio, C., Fagotto, F., Nasi, E., 1994, A&AS, 301, 381
- (2) Bessell, M. S., Brett, J. M., 1988, PASP 100
- (3) Bressan, A, Nasi, E., 1995, priv. communication
- (4) Bressan, A, Granato, G. L., Silva, L., 1998, A&A 332, 135
- (5) Catchpole, R. M., Whitelock, P. A., Glass, I. S., 1990, MNRAS 247, 479
- (6) Epchtein N. et al. 1997, Messenger 87, 27
- (7) Frogel, J. A., Tiede, G. P., Kuchinski, L. E., 1999, AJ, 117, 2296
- (8) Glass, I. S., 1999, Handbook of Infrared Astronomy, Cambridge, Univ. Press
- (9) Kurucz, R. L., 1992, “The stellar populations of galaxies”, IAU symp. 149, 225
- (10) Lançon, A., Rocca-Volmernage, B., 1992, A&AS 96, 593
- (11) Omont, A., Ganesh, S., Alard, C., et al., 1999, accepted for publication in A&A
- (12) Persi, P., Burton, W. B., Epchtein, N., Omont, A. (eds.), 1995, Proc. of the “1st Euroconference on near-infrared sky surveys, San Miniato, Italy”, Mem. S. A. It 66
- (13) Ridgway, S. T., Joyce, R. R., White, N. M., Wing, R. F., 1980, ApJ 235, 126
- (14) Schultheis, M., Ng. Y. K., Hron, J., Kerschbaum, F., 1998, A&A 338, 581
- (15) Skrutskie, M., Schneider, S. E., Stiening, R. et al., 1997, “The impact of Large Scale Near-IR Sky Surveys”, eds. F. Garzon et al., p. 25., Dordrecht, Kluwer
- (16) Stanek, K. Z., 1996, AJ 460, L37
- (17) Unavane,M., Gilmore, G., Epchtein, N., Simon, G., Tiphene, D., de Batz, B., 1998, MNRAS 295, 119
- (18) Wood, P. R., Habing, H. J., McGregor, P. J., 1998, A&A 336, 925