The BeppoSAX 1-8 keV cosmic background spectrum
Abstract
The spectrum of the 1.0–8.0 keV cosmic X-ray background (CXB) at galactic latitudes has been measured using the BeppoSAX LECS and MECS instruments. The spectrum is consistent with a power-law of photon index and normalization photon cm-2 s-1 keV-1 sr-1 at 1 keV. Our results are in good agreement with previous ROSAT PSPC (Georgantopuolos et al. 1996), ASCA GIS (Miyaji et al. (1998)) and rocket (McCammon & Sanders 1990) measurements. On the contrary, previous measurements with the HEAO1 A2 (Marshall et al. (1980)) and the ASCA SIS (Gendreau et al. 1995) instruments, are characterized by normalizations which are respectively 35% and 25% smaller than ours.
Key Words.:
diffuse radiation – X-rays: General1 Introduction
The first measurement of the cosmic X-ray background (CXB) dates back to the early 60s (Giacconi et al. 1962). This serendipitous discovery posed the still unsolved problem of the origin of the CXB. Later observations (e.g. Schwartz & Gursky 1974) have shown that the CXB above 1 keV is highly isotropic. This, as well as other evidence, has led to the current understanding that the CXB, at energies above 1 keV, is of extragalactic origin. High angular resolution X-ray observations, and the absence of distorsions in the cosmic microwave background spectrum (Fixsen et al. 1996), support the idea that the CXB above 1 keV is dominated by the integrated emission from faint sources, with a dominant contribution coming from Active Galactic Nuclei (AGN). Recent results from X-ray surveys show that the fraction of the CXB due to discrete sourcers is 70-80% in the 0.5–2.0 keV band (Hasinger et al. (1998)) and at least 30% in the 2–10 keV band (Fiore et al. (1999)). The CXB spectrum in the 3–50 keV band, measured by HEAO1 A2 (Marshall et al. (1980)), is adequately represented by a power-law with an exponential cutoff at 40 keV. In the 2–10 keV energy range the CXB spectrum is approximated by a power-law with photon index 1.4. Further measurements of the CXB spectrum, performed with the ROSAT PSPC (Hasinger (1992)) in the 0.5–2.0 keV band, with the ASCA SIS (Gendreau et al. (1995)) in the 0.4–7.0 keV band, and with the ASCA GIS (Miyaji et al. (1998)) in the 1.0–10.0 keV band, disagree at about the 20%-30% level as to the value of the 1 keV normalization. While the ASCA GIS and ROSAT PSPC measurements give values around 11 photon s-1 cm-2 keV-1 sr-1, the ASCA SIS spectrum, which lies on the extrapolation of the HEAO1 A2 measurement, yields a value of 9 photon s-1 cm-2 keV-1 sr-1. New observations of the CXB spectrum are needed to clarify the issue.
In this letter we present a new measurement of the CXB spectrum, in the 1.0-8.0 keV, obtained with the LECS and MECS instruments on board BeppoSAX. A previous measurement, using LECS data alone, has been presented by Parmar et al. (1999; P99 hereinafter). The remainder of the letter is organized as follows. In Sect. 2 we discuss instrumental issues relevant to the analysis of the LECS and MECS CXB spectra. In Sect. 3 we present the list of observations which have been used to measure the CXB spectrum. In Sect. 4 we report on the spectral analysis. In Sect. 5 we discuss our findings and compare them to previous results.
2 Instrumental issues
2.1 LECS
The Low-Energy Concentrator Spectrometer (LECS; 0.1–10 keV; Parmar et al. 1997) is an imaging scintillation proportional counter on-board the Italian-Dutch BeppoSAX X-ray astronomy mission (Boella et al. 1997a ). It has a circular field of view of 18.5′ radius, an effective area of 40 cm2 at 2 keV and an energy resolution of 8% at 6 keV. Details on the CXB data reduction can be found in P99. Briefly, the CXB was accumulated within a central circle with an 8′ radius. The spectrum of the non X-ray background (NXB) has been accumulated during 816.3 ks of dark Earth pointing (this is a factor 1.6 greater than in P99). The response matrix we employ is the same used by P99. Briefly, we recall that the response matrix, which is appropriate for the diffuse emission, has been generated, by simulating a set of 100 point sources, randomly distributed within a radius of 12′, therefore larger than the CXB accumulation region. This matrix includes also the effect of off-axis mirror vignetting and the average obscuration of the support strongback. Moreover the LECS matrix has been corrected for the 15% LECS/MECS crosscalibration missmatch present in the September 1997 release of BeppoSAX matrices. We expect any residual crosscalibration error between LECS and MECS to be less than . In addition to the above effects, single reflected X-rays from within 120′ can be detected in the FOV (Conti et al. (1994)). The magnitude of this effect has been found to be 1% of the flux within an 8′ extraction radius (P99). Since this is well within the uncertainty in CXB normalization, this effect is ignored.
2.2 MECS
The Medium-Energy Concentrator Spectrometer (MECS; 1.5–10 keV; Boella et al. 1997b ) is an imaging gas scintillation proportional counter. The MECS was originally composed of 3 units, MECS1, MECS2 and MECS3. MECS1 failed in May 1997, in this paper we shall use only data from the 2 units which are still operative. The energy resolution is 8% at 6 keV. The combined on-axis effective area for the MECS2 and MECS3 units is 80 cm2 at 2.0 keV and 60 cm2 at 8 keV. The MECS has a circular field of view (FOV) of 25′ radius. An annular support structure, commonly referred to as strongback, is localized at about 10′ from the center of the detector. The absolute flux calibration of the MECS was performed using the Crab nebula spectrum. Assuming a power-law model the photon index, , and the 2-10 keV flux, F(2-10), for the Crab, are found to be and F(2-10) erg cm-2s-1. Repeated observations have not revealed any significant variations in either of these parameters so far (Sacco 1999). The uncertainty in the line of sight NH for the Crab, may affect at the few percent level the MECS calibration in the softest (1.65-2.0 keV) energy band. For the present work we have chosen to accumulate spectra from a relatively small central circular region with radius 8′. The main reasons for this choice are that: i) the ratio of the CXB to the NXB is at its highest at the center of the detector; ii) we avoid complications associated to the obscuration form the strongback; iii) the inner region of the MECS detector is better calibrated than the outer one. We have created a response matrix appropriate for uniform diffuse emission. This matrix differs from the standard point-source response matrix in the following ways: i)the effects of off-axis mirror vignetting are included; ii)the CXB is modeled as a uniform diffuse emission, within a radius of 12′. The MECS response matrix has been generated using the EFFAREA program publically available within the latest SAXDAS release. The NXB accounts for a significant fraction of the total background, thus a correct measurement of the NXB is needed to measure the CXB. A total of 1850 ks of NXB data was accumulated using MECS dark Earth pointings. In the central 8′ the MECS NXB spectrum is approximately constant with energy, with a count rate of cts s-1 keV -1 MECS-1, between 1.0 and 4.5 keV. Between 4.5 keV and 7 keV there is a smooth increase in count rate with 3 discrete line-like features superposed. Above 7 keV the spectrum is again flat with a count rate of cts s-1 keV -1 MECS-1. Above 8 keV, the NXB dominates the overall background spectrum. Due to the low-inclination, almost circular, BeppoSAX orbit, variations in the NXB counting rate around the orbit are negligible.
3 CXB observations
| Pointing (J2000) | Observations | |||||||
|---|---|---|---|---|---|---|---|---|
| RA | Dec | Start | Stop | (ks) | (ks) | |||
| (h m s) | () | (yr mn day) | (yr mn day) | |||||
| 01 39 35.4 | +89 14 06 | 123.1 | +26.4 | 1997 Feb 01 | 1997 Feb 03 | … | 115.5 | 6.8 |
| 02 31 42.0 | +89 15 47 | 123.4 | +26.5 | 1996 Jul 01 | 1997 May 23 | 69.7 | 257.8 | 7.0 |
| 05 52 07.9 | 61 05 35 | 270.0 | 30.6 | 1998 Mar 10 | 1998 Mar 22 | 46.7 | 156.6 | 5.3 |
| 06 12 22.7 | 60 59 04 | 270.1 | 28.2 | 1996 Oct 10 | 1996 Oct 12 | 43.3 | 115.0 | 4.2 |
| 06 22 36.4 | 69 15 28 | 279.5 | 27.8 | 1998 Oct 23 | 1998 Oct 23 | 12.4 | 34.4 | 6.9 |
| 16 35 10.7 | +59 46 30 | 89.9 | +40.2 | 1996 Aug 27 | 1996 Aug 31 | 79.9 | 170.4 | 2.0 |
| 16 51 19.5 | +60 11 49 | 89.8 | +38.1 | 1996 Aug 23 | 1996 Aug 27 | 82.3 | … | 2.1 |
| 17 30 42.2 | +60 55 32 | 89.9 | +33.2 | 1996 Aug 21 | 1996 Aug 23 | … | 65.8 | 3.5 |
| 17 38 57.1 | +68 01 10 | 98.2 | +31.8 | 1999 Mar 03 | 1999 Mar 03 | 20.5 | … | 4.4 |
| 17 49 33.7 | +61 05 54 | 90.0 | +30.9 | 1998 Mar 28 | 1998 Mar 29 | … | 53.4 | 3.5 |
| 17 50 51.1 | +61 05 45 | 90.0 | +30.8 | 1998 Sep 10 | 1999 Apr 11 | 88.1 | 49.8 | 3.5 |
| 17 52 07.4 | +61 01 01 | 89.9 | +30.6 | 1998 Aug 22 | 1998 Oct 07 | 116.6 | 206.0 | 3.5 |
| 17 56 46.1 | +61 11 45 | 90.2 | +30.1 | 1997 Mar 23 | 1997 Mar 25 | 94.2 | 116.7 | 3.4 |
| 17 58 14.6 | +61 12 30 | 90.2 | +29.9 | 1997 Mar 18 | 1997 Mar 20 | … | 119.0 | 3.4 |
| 18 18 20.5 | +60 58 42 | 90.2 | +27.4 | 1997 Apr 13 | 1997 Apr 15 | 26.6 | 114.4 | 3.8 |
| 23 07 53.5 | +08 50 06 | 84.4 | 46.1 | 1997 Dec 13 | 1997 Dec 14 | 13.9 | … | 4.7 |
A background spectrum, with a total exposure time of 694.2 ks for the LECS (a factor 1.25 greater than in P99) and 1574.8 ks for the MECS, was accumulated from a number of high galactic latitude exposures by extracting counts within an 8′ radius of the nominal source position within the LECS and MECS FOV (Table 1). While a light leakage problem has forced us to use the LECS only during night time, the MECS data has been accumulated during day and night time. For various reasons of the 16 pointing listed 4 have only MECS data and 3 have only LECS data. We note that the total integration times, the covered solid angles (0.67 sq deg for the LECS, and 0.73 sq deg for the MECS) and most importantly the accumulated photons (more than 44000 for the LECS plus MECS), are larger than those associated to previous measurements of the CXB spectrum, with imaging instruments, in the medium energy band. For this reason we expect our measurement to be limited by systematic effects rather than by counting statistics or by fluctuations associated to the CXB granularity. No point sources are present in the individual fields with 0.1–2.0 keV fluxes erg cm-2 s-1, and with 2.0–10.0 keV fluxes erg cm-2 s-1. Using the 2-10 keV LogN-LogS reported in Comastri et al. (1999) we have estimated that about 5% of the total CXB is produced by source above the erg cm-2 s-1 flux limit. All the fields have galactic latitudes and galactic column densities between 2.0 and atom cm-2. The spectrum was rebinned to have at least 20 counts per bin in order to ensure the applicability of the statistic. All uncertainties are quoted at the 90% confidence level for one interesting parameter ().
4 X-ray background spectrum
Spectral fitting has been performed using the 1.0-4.0 keV LECS spectrum and the 1.65-8.0 keV MECS spectrum (as customary we have equalized MECS2 and MECS3 data and produced a single MECS spectrum). Data below 1.0 keV is ignored as we are interested in characterizing the extragalactic CXB. LECS data above 4.0 keV, where a slight miscalibration problem is present, has also been ignored. MECS data above 8.0 keV, where the NXB becomes dominant is also ignored. All spectral models have been absorbed by a foreground column density, NH, of atom cm-2, which has been derived by averaging the galactic densities of the blank fields listed in Table 1. In all fits we have allowed for a maximum cross calibration mismatch of 5% between LECS and MECS data (see Sect. 2.1). A simple power-law fit gives an acceptable of 75.1 for 74 degrees of freedom (dof) with , a normalization of photon s-1 cm-2 keV-1 sr-1 at 1 keV and a normalization of photon s-1 cm-2 keV-1 sr-1 at 4 keV. The normalization at 1 keV is quoted for comparison with previous works, while the normalization at 4 keV is quoted because when using a 1.0-8.0 keV spectral band the most precise determination of the normalization is obtained at the center of the band rather than at one of its limits.
Since a fraction of the 1-2 keV CXB may quite possibly not be of extragalactic origin, we have fitted the CXB spectra with a power-law together with a single temperature optically thin plasma (the Mewe-Kaastra-Liehdal plasma emissivity model in xspec, Mewe et al. (1985)). Since we are not interested in the thermal component in itself, we fixed its parameters to the best fitting values derived by P99 when fitting the LECS spectrum of the CXB. The power-law plus thermal component fit, which is reported in Fig. 1, gives an acceptable of 75.0 for 74 degrees of freedom (dof) with , a normalization of photon s-1 cm-2 keV-1 sr-1 at 1 keV and a normalization of photon s-1 cm-2 keV-1 sr-1 at 4 keV. Obviously, the addition of a low energy component has resulted in a reduction of the spectral index and of the 1 keV normalization, while the 4 keV normalization is unaffected.

5 Discussion
In Fig. 2 we plot various measurements of the CXB spectrum. To facilitate the comparison the spectra are plotted in the form of a ratio of the photon spectrum to a power-law with index 1.4 and normalization at 1 keV of 11 photon s-1 cm-2 keV-1 sr-1. Note that we have associated a 5% error to the normalization of our measurement to account for residual uncertainties in the absolute calibration of the LECS and MECS instruments.
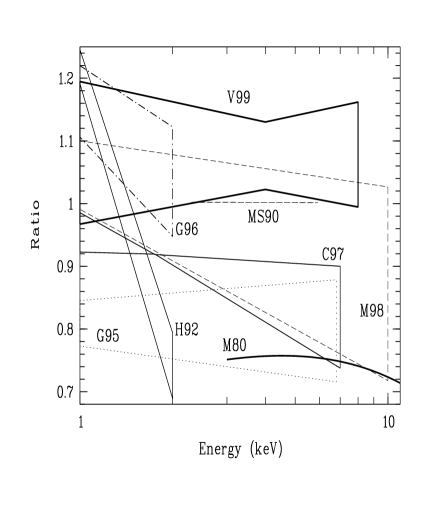
The LECS measurement of P99 is consistent with the LECS-MECS measurement we present here, we have not included the P99 spectrum in Fig.2 to avoid making it even more crowded than it allready is. Our measurement is consistent with the ASCA GIS measurement of Miyaji et al. (1998) on the Lockman Hole. Their normalization at 4 keV is smaller than ours by 13%, and within the errors. We are also in agreement with the rocket measurement (McCammon & Sanders 1990) and with the ROSAT PSPC measurement from Georgantopoulos et al. (1996). The joint ROSAT PSPC ASCA SIS analysis of QSF3 by Chen et al. (1997) is in agreement with our measurement at low energies but, due to its steeper spectral index, falls short of our measurement by about 25% at 7 keV. The ASCA SIS measurement of Gendreau et al. (1995) and the HEAO1 measurement of Marshall et al. (1980) have spectral indices similar to ours, but normalizations which are smaller by 25% and 30% respectively. The discrepancy with the HEAO1 measurement is somewhat larger, 35% if we consider the contribution of bright sources to the total CXB discussed in Section 3.
Acknowledgements.
BeppoSAX is a joint Italian-Dutch programme. MG acknowledges snd ESA Fellowship. We acknowledge support from the BeppoSAX SDC. We thank the referee, G.Hasinger for useful comments. SM thanks A.S.Comastri for useful discussions.References
- (1) Boella G., Butler R.C., Perola G.C., et al., 1997, A&AS 122, 299
- (2) Boella G., Chiappetti, L., Conti, G., et al., 1997, A&AS 122, 327
- Chen et al. (1997) Chen L.-W., Fabian A.C., Gendreau K.C., 1997, MNRAS 285, 449
- (4) Comastri A., Fiore F., Giommi P., et al., 1999, Ad.S.R., in press (astro-ph/9902060)
- Conti et al. (1994) Conti G., Mattaini E., Santambrogio E.B., et al., 1994, SPIE 2279, 101
- Dickey & Lockman (1990) Dickey J.M., Lockman F.J., 1990, ARA&A 28, 215
- Fiore et al. (1999) Fiore F., La Franca F., Giommi P., et al., 1999, MNRAS, 306, L55
- (8) Fixsen D.J., Cheng E.S., Gales J.M., et al., 1996, ApJ, 473, 576
- Gendreau et al. (1995) Gendreau K., Mushotzky R., Fabian A.C., et al., 1995, PASJ 47, L5
- Georgantopoulos et al. (1996) Georgantopulos I., Stewart G., Shanks T., et al., 1996, MNRAS 280, 276
- (11) Giacconi R., Gursky H., Paolini F. & Rossi, B., 1962, Phys. Rev. Lett. 9, 439
- Griffiths & Jordan (1998) Griffiths N.W., Jordan C., 1998, ApJ 497, 883
- (13) Gruber D.E., Matteson J.L., Peterson L.E., Jung G.V. 1999, Report-no: SP-98-25 (astro-ph/9903492)
- Hasinger (1992) Hasinger G., 1992, in: The X-ray Background, Barcons X., Fabian A.C., (eds.) Cambridge University Press, Cambridge, p. 299
- Hasinger et al. (1998) Hasinger G., Burg R., Giacconi R., et al., 1998, A&A 329, 482
- Marshall et al. (1980) Marshall F.E., Boldt E.A., Holt S.S., et al., 1980, ApJ 235, 4
- McCammon & Sanders (1990) McCammon D., Sanders W.T., 1990, ARAA 28, 657
- Mewe et al. (1985) Mewe R., Gronenschild E.H.B.M., van den Oord G.H.J., 1985, A&AS 62, 197
- Miyaji et al. (1998) Miyaji T., Ishisaki Y., Ogasaka Y., et al., 1998, A&A 334, L13
- Parmar et al. (1997) Parmar A.N., Martin D.D.E., Bavdaz M., et al., 1997, A&AS 122, 309
- Parmar et al. (1999) Parmar A.N., Guainazzi M., Oosterbroek T., et al., 1999, A&A 345, 611 (P99)
- (22) Sacco B., in BeppoSAX June 1999 EIWG meeting report
- (23) Schwartz D. & Gursky H. 1974 in: X-ray Astronomy, Giacconi R., Gursky H. (eds.) D. Reidel Publishing Company, Dordrecht, p. 359