Diffuse Thermal Emission from Very Hot Gas in Starburst Galaxies
Abstract
BeppoSAX observations of the nearby archetypical starburst galaxies NGC253 and M82 are presented. Spectral analysis shows that the 2–10 keV spectra of both galaxies, extracted from the central regions, are best fitted by a thermal emission model with 6–9 keV and metal abundances 0.1–0.3 solar. The spatial analysis yields clear evidence that this emission is extended in NGC 253, and possibly also in M82. These results clearly rule out a LLAGN as the main origin of the X-ray emission in NGC 253. For M82, the presence of an Fe-K line at 6.7 keV, and the convex profile of its 2–10 keV continuum, indicate a significant thermal component. Contributions from point sources (e.g. X-ray binaries, supernova remnants, and/or a LLAGN) and Compton emission are also likely. Altogether, BeppoSAX results provide compelling evidence for the existence of a hot interstellar plasma in both galaxies, possibly in the form of superwind outflows from the disks of these galaxies. Order-of-magnitude estimates and some implications, such as the expelled mass and the energetics of the outflowing gas of this superwind scenario, are discussed. These new results also suggest some similarity between the X-ray emission from these galaxies and that from the Galactic Ridge.
Key words: X-rays: galaxies – Galaxies: starburst – Galaxies: NGC 253, M82
1 Introduction
Starburst galaxies (SBGs) are galaxies in which star formation occurrs at a rate significantly higher than a typical galactic rate. The main interest for studying SBGs in the local universe stems from the belief that the starburst phase must have been very frequent during the early () evolution of galaxies (Madau et al. 1996; Heckman 1999). Thus understanding the properties of local SBGs would help in the characterization of galaxies in the early universe. Studies of SBGs can also help to shed light on key astrophysical issues such as: i) the chemical enrichment of the intergalactic medium (IGM) by metal-enriched starburst-driven outflows (Heckman 1998), ii) the formation, evolution and structure of galaxies through the feedback effect provided by massive stars in the forms of radiation, mechanical energy, cosmic rays and metal-rich material (Ikeuchi & Norman 1991); and iii) the AGN/starburst connection, since both phenomena require concentration of material in the nuclear regions and are possibly linked to merging phenomena and/or the presence of molecular bars (Maiolino et al. 1998).
Evidence for complex galactic-scale outflows driven by starburst activity has been gathered in recent years. It is primarily based on optical and low-energy X-ray ( 0.1–3 keV: hereafter LEX) observations (Fabbiano 1989 and references therein). These outflows have sometimes been called “superbubbles” or “superwinds”, the latter referring to those manifestations where the extended hot gas, that emits optical emission lines and LEX emission, appears to be ejected into the IGM. Optical emission usually suffers from extinction and is often almost completely reprocessed into infrared (IR) radiation: therefore the X-ray data, when available, provide the most direct view of the hot wind material. In general, results of spectroscopic X-ray studies confirm or, at least, are consistent with thermal emission from a hot plasma most likely shock-heated by supernovae (e.g. Dahlem, Weaver & Heckman 1998: hereafter DWH98). However, the detailed physical characteristics of the gas –in particular its chemical abundances– have remained unclear because the analysis in the LEX band is complicated by the unknown line-of-sight extinction, the large uncertainties in the theoretical models used (in particular around the FeL-shell energy band), and the presence of multiple temperature components (typically with 0.2 keV 3 keV).
At higher energies, available imaging information to date was essentially limited to the EXOSAT observation of M82 (Schaaf et al. 1989) and to the ASCA observations of a few X-ray bright SBGs [NGC 253, M82: Ptak et al. 1997 (hereafter P97), Moran & Lehnert 1997, DWH98; NGC 3310, NGC 3690: Zezas et al. 1998; NGC 1569, NGC4449, NGC2146: Della Ceca et al. 1996, 1997, 1999]. Schaaf et al. (1989) found that the 1–10 keV spectrum of M82 was equally well fit with a power-law spectrum or with thermal emission characterized by keV. ASCA was able to resolve the 2–10 keV emission from NGC 253 (P97) but not that from M82 (Tsuru et al. 1997). Adequate spatial analysis was not possible even in the case of NGC253. Analysis of the ASCA spectra shows that the hard X-ray (hereafter HEX) components of both sources can be described equally well by either a thermal (–9 keV) or a power-law ( 1.8–2.0) model. The puzzling absence, in the previous data, of significant Fe-K line emission induced several authors to favour the power-law model: this was interpreted in the framework of either a low-luminosity active galactic nucleus (LLAGN) (P97; Tsuru et al. 1997; Matsumoto & Tsuru 1999) or of Compton scattering of relativistic electrons by the intense FIR (, see Telesco & Harper 1980) radiation field (Rephaeli et al. 1991; Rephaeli & Goldshmidt 1995; Moran & Lehnert 1997).
In a previous paper (Persic et al. 1998), we have presented the BeppoSAX spectral results for the central region of NGC 253, which have given the first evidence of the 6.7 keV Fe-K line emission and of the high-energy rollover expected as the signature of thermal emission. In this paper, we present the results obtained from the temporal (Sect. 3), spatial (Sect. 4), and spectral (Sect. 5, 6 and 7) analysis of the BeppoSAX data for both NGC 253 and M82. As will be shown, our results suggest a predominantly thermal origin of the HEX component in both sources. The possible origin(s) and implications of such emission are then briefly discussed (Sect. 8). In what follows, we assume a distance of 4.8 Mpc and 3.9 Mpc to NGC 253 and to M82, respectively.
2 Observations and data reduction
BeppoSAX consists of a low-energy concentrator spectrometer (LECS: Parmar et al. 1997), a medium-energy concentrator spectrometer (MECS: Boella et al. 1997), a high-pressure-gas scintillation proportional counter (HPGSPC: Manzo et al. 1997), and a phoswich detector system (PDS: Frontera et al. 1997).
BeppoSAX observed NGC 253 on Nov.29 – Dec.02, 1996 and M82 on Dec. 6-7, 1997. The HPGSPC data will not be considered in the present paper since the sources are too faint for a correct background subtraction. Our analysis is restricted to the 0.1–4.5 keV and 1.5–10 keV energy bands for the LECS and MECS, respectively, where the latest released (September 1997) response matrices are best calibrated (Fiore, Guainazzi & Grandi 1998). Table 1 reports the log of the observations, with the corresponding exposure times and derived net (background-subtracted) count-rates. The region sizes (Table 1) are chosen in order to minimize the effects of the extended emission in NGC 253 and to maximize the signal-to-noise ratio in M82 (but see also Sect. 4). Standard blank-sky files provided by the BeppoSAX Science Data Center were used for background subtraction, and contributed about 10% (NGC 253) and 7% (M 82) of the total counts at 6 keV.
The PDS data reduction was performed using the XAS software package (v.2.0: Chiappetti & Dal Fiume 1997). The PDS nominal spectral band is 13–300 keV. The detection of both sources is statistically significant (see Table 1). However, when account is taken of the 0.02 cts/s systematic uncertainty, we find that only for M82 is the detection formally significant (at 4), and only up to 30 keV. In the case of NGC 253, no contaminating sources were found either in the PDS field of view (FOV; which has a triangular response with FWHM of 1.3∘, see Frontera et al. 1997), nor in the background regions pointed at 3.5 degrees from the source position (following the so-called rocking collimator mode). Also in the case of M82, no contaminating sources were found in the background FOV. However, the LINER galaxy M81 is only 37′ away from M82 so that, given the PDS triangular response, the measured emission includes half of the M81 flux. A BeppoSAX observation of M81 (Pellegrini et al. 1999) performed in June 1998 indicates that the source was then well fit by a steep ( 1.8 0.1) power-law spectrum from 0.1 to 100 keV and had a 10–50 keV flux of 4 10-11 erg cm-2 s-1. Since the 10–50 keV flux of M82 is 1.7 10-11 erg cm-2 s-1, it seems that most of the E10 keV flux observed from the M82 FOV originates in M81. The spectrum of M82, obtained by fitting the PDS data only is, however, much steeper ( 3.8 1.4) than that of M81 which implies only marginal or no contamination at all. This, combined with the fact that the X-ray flux of M81 is known to have varied by at least a factor of 4 on a timescale of months/years (Pellegrini et al. 1999; Iyomoto 1999), prevents us from claiming the PDS detection of M82111In this respect, it is interesting to note that BATSE (Malizia et al. 1999) has detected an even larger HEX (20–100 keV) flux ( 5.9 10-11 ergs cm2 s-1). All this body of evidence suggest that either M81 or M82 do vary significantly at high energies.. A conservative approach is thus to consider the M82 PDS data as upper limits, as will be done in the rest of this paper.
Table 1: Exposure times and count-rates
| Source | Inst. | Exposure | Region size | Count-rate |
|---|---|---|---|---|
| (ksec) | (′) | (10-2 cts/s) | ||
| NGC 253 | LECS | 55 | 4 | 3.90.1 |
| MECS | 113 | 4 | 8.90.1 | |
| PDSa | 51 | 78 | 5.31.7 | |
| M82 | LECS | 29 | 6 | 190.3 |
| MECS | 85 | 6 | 370.2 | |
| PDSa | 30 | 78 | 7.61.4 |
a Energy range considered between 13–50 keV.
b Detection significance: statistical errors only.
c Detection significance: statistical errors plus systematic errors (see text).
3 Temporal analysis
Fig.1 shows, for both NGC 253 and M82, the LECS (0.1–2 keV) and MECS (2–10 keV) lightcurves as well as the LECS/MECS flux-ratio curve. No variability in either energy band is found for NGC 253. Using the best-fit model obtained in Sect. 5, the count-rates measured from NGC 253 correspond to 3 10-12 erg cm-2s-1 and 5 10-12 erg cm-2s-1. These values are consistent with those obtained with ASCA (P97).
In M82, some short-term ( hrs) variability (with 30% amplitude) was detected in the MECS energy band at 95% significance. The roughly constant hardness-ratio curve (Fig.1, bottom panel) indicates, however, that the flux variations were not accompanied by strong spectral variations. To estimate the fraction of the variable flux in M82, we performed a maximum likelihood fit (see e.g. Maccacaro et al. 1988) of the count-rate distribution of M82, and obtained a dispersion of the light curve around its mean value of only 15% 4%. In conclusion, the lack of spectral variability and small dispersion around the mean suggest that this variable component should not affect significantly the spectral analysis and related inferences presented in this paper.
The short-term variations in M82 observed with BeppoSAX are similar to those reported by Matsumoto & Tsuru (1999) and Ptak & Griffiths (1999) from ASCA. These authors also report long-term HEX (2–10 keV) variations by up to a factor of 4 on a time scale of several days, suggesting the presence of a LLAGN in M82 (see Sect. 8). Using the best-fit model presented in Sect. 5, the observed count-rates correspond to 1.1 10-11 erg cm-2s-1 and 2.9 10-11 erg cm-2s-1, respectively. The low-energy flux is consistent with the (constant) value obtained by ASCA; the flux in the higher energy band is about equal to the average of the values measured with ASCA (Ptak & Griffiths 1999), implying that M82 was in a normal/typical state during the BeppoSAX observation.
4 Spatial analysis
The LECS relatively low spatial resolution (FWHM at 0.3 keV) and low statistics do not allow a detailed spatial analysis at keV. Higher resolution images at low energies were previously obtained with Einstein, ROSAT and ASCA (Fabbiano & Trinchieri 1984; Read, Ponman & Strickland 1997; DWH98; P97, and ref. therein), and show much finer details.
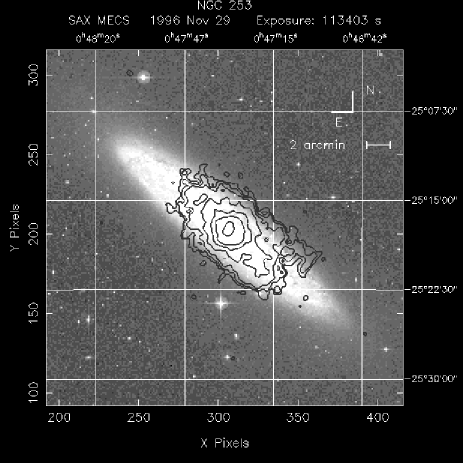
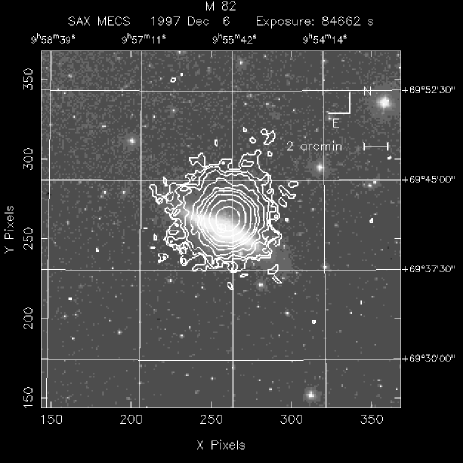
Spatially, BeppoSAX can do better than any previous observation at E2 keV because of the unprecedented MECS statistics and spatial resolution (at 6 keV, the radii –measured from the center of the FOV– encompassing 50% and 80% of the observed flux are 1′ and 2′, i.e. about twice better than ASCA). The analysis presented in this section focuses on the data above 3 keV which are dominated by the HEX component (see Sect. 5). Fig.2 shows the MECS 3–10 keV images of both galaxies superimposed on Digital Sky Survey data. a) The left panel of Fig.2 clearly shows one of the most interesting results of the present analysis: the HEX emission of NGC 253 is extended and elongated along the optical major axis. In NGC 253, there is also an indication for an X-ray “cone” extending southwest. No point sources embedded in the extended emission are detected, but within the MECS resolution their presence cannot be ruled out firmly. Another interesting feature in NGC 253 is the apparently extended emission along the minor axis (northwest to southeast), reminiscent of the ROSAT PSPC and HRI results (R97; DWH98). Indeed, such morphology could be the signature of very hot gas ejected out of the galaxy (see Sect. 8). b) The right panel of Fig.2 suggests the presence of a more symmetric X-ray halo in M82, although with some apparent excess emission (at a 2 level) from the outer galactic regions along the optical minor axis in the northwest direction. The shift between the X-ray and the optical centroids is within the systematics ( 1′) of the absolute position reconstruction for BeppoSAX.
The radial profiles of the 3–10 keV emission from NGC 253 and M82 are shown in Fig.3, together with the instrumental PSF (energy-weighted over the source spectra). The HEX emission in NGC 253 extends up to 8′ ( 11 kpc). There is also marginal evidence that the emission from M82 extends to 5′ ( 6 kpc). If real, the extended component of M82 contributes 10% of the total 3–10 keV flux. (A more quantitative assessment of the reality of this spatial extent as evidenced in the BeppoSAX data is not possible because of PSF and background subtraction systematic uncertainties, which are crucial at these levels of precision.)
In NGC 253, the extension is also evident if one considers the 3–5 keV, 6–7 keV and 7–10 keV datasets separately (Cappi et al. 1999), indicating Fe-K-line emission region is extended. At all radii, the 3–10 keV surface brightness profile can be fitted with a King model (, where is the surface brightness, is the distance from the center, is the core radius, and is an index) having ( kpc) and 1.3. For , the brightness can be fitted with a simple profile consistent with the emissivity expected from an expanding gas dominated by ram pressure (see Sect. 8.2.6). We find that the diffuse component in NGC 253 contributes at least 40% of the total 3–10 keV flux within 8′. If the extension in M82 is real, then the diffuse component is 10% of the total 3–10 keV flux.
5 Spectral analysis
For the spectral analysis, the LECS and MECS data were rebinned so as to sample the instrumental resolution with 3 and 5 channels per energy bin, respectively (corresponding to at least 20 and 50 cts bin-1). The PDS data were grouped logarithmically between 13 and 60 keV in order to achieve a compromise between the highest number of bins and the highest S/N ratios. Given the large uncertainties on the PDS data points (a low S/N for NGC 253 and the possible contamination of the M82 emission by M81), we did not include them in the fitting procedures (but we show them in the figures). Galactic column densities of N 1020 cm-2 for NGC 253, and N 1020 cm-2 for M82, were added in all the spectral fits (Dickey & Lockman 1990). The spectral analysis was performed using version 10.00 of the XSPEC program (Arnaud 1996).
5.1 Continuum
Fig.4 shows the results obtained by fitting the source spectra with a single power-law model. Consistent with results from previous satellites (see P97, and refs. therein), the keV data of both sources clearly require at least one thermal component. At keV, a pure power-law fit to the continuum, which was allowed by the earlier ASCA data (P97), seems to be ruled out by the present BeppoSAX data (owing to the unprecedented statistics at keV), for both NGC 253 (see Persic et al. 1998) and M82. In the case of M82, fitting the LECS+MECS 2–10 keV data by a model that involves a bremsstrahlung (power-law) continuum plus 3 gaussian emission lines gives 78 (92) for 91 d.o.f.: thus, a power-law instead of thermal model is significantly less likely (=14). 222 When the PDS data –if considered as actual detections– and/or the keV data are also taken into account, then the power-law model seems even less likely when compared with the thermal model (typically, ). Matsumoto & Tsuru (1999) likewise note that the HEX component detected with ASCA in M82 is statistically better described by a thermal model than by a power-law component. The situation is similar for NGC 253. These results can also be deduced from the behaviour of the 5 keV MECS and PDS upper-limit residuals (see Fig.4). Even ignoring the Fe-K line detection (see below), these residuals show a clear steepening of the continuum toward higher energies, which may by itself be considered as evidence for thermal emission. Whatever the model used for the HEX continuum (i.e a power-law or a thermal model), it needs to be absorbed in order not to over-produce the continuum at E 1 keV (as was also deduced from ASCA data: see P97).
We then fitted the spectra with a two-temperature bremsstrahlung model (the HEX component being absorbed) plus gaussian lines in order to define the properties (energy and intensity) of the detected emission lines (see Fig.5 and Table 2). At energies lower than 3 keV, several lines are present in the spectra (e.g. from FeL and H- and He-like O, Ne, Mg, Si and S ions): these lines are typical of LEX thermal components (see also the ASCA results of P97). One of the most remarkable results of the present analysis is that an Fe-K line at E 6.7 keV is clearly detected in both galaxies, confirming previous detections from the same data (Persic et al. 1998 for NGC 253), and from ASCA data (Ptak et al. 1997 and Matsumoto & Tsuru 1999 for M82).
To model the broad-band spectra of both galaxies, we then tried several thermal models: pure bremsstrahlung, single-temperature Raymond-Smith (RS), multi-temperature RS, Mewe-Kaastra-Liedahl (; Mewe et al. 1985), and combinations of them, with and without absorption, and with solar and variable abundances. We found that the best description of both galaxies’ spectra is in terms of a two-temperature model with variable abundances ( in XSPEC), as shown in Table 3 and Fig.6. We preferred the to the RS model (in spite of the equally good fit obtained) because of the more recent emissivities (notably for Fe) used in the former (Liedahl et al. 1995). Solar abundance ratios from Anders & Grevesse (1989) are used throughout.
5.2 Emission lines
In order to reduce the number of free parameters (following Persic et al. 1998), the abundances of He, C, and N were set equal to the solar values, while the heavier elements were divided into two groups: Fe and Ni, which are most likely associated with SNe I products, and -elements O, Ne, Mg, Si, S, Ar and Ca, likely associated with SNe II products.
Elements in the same group were constrained to have the same abundances in solar units. Furthermore, the abundances of the -elements related to the HEX component were set equal to those of the LEX component after verifying their mutual consistency (within errors) when left free to vary.
The detection of the Fe-K line allows us to reliably determine the Fe abundances of the line-emitting material: we determine a value of about 0.3 and 0.07 solar for NGC 253 and M82, respectively. The former value is consistent with the upper limits derived from previous X-ray observations. The latter, unusually low value may hint at the presence of an appreciable non-thermal contribution that would raise the local continuum and swamp the iron line (see Sect. 7). Similarly, low Fe abundances are found for the LEX component, but current uncertainties of theoretical models in computing the Fe-L emissivity (e.g. Liedahl et al. 1995) makes this result less certain. On the other hand, the -elements seem to have larger abundances ( 1.6 solar for NGC 253 and 2.9 solar for M82). However, we caution again that these numbers are highly uncertain because of the very likely multi-temperature (and possibly non-equilibrium) nature of the emission (as found in other SBGs, see Della Ceca et al. 1997 and DWH98). Assuming such multi-temperature plasma models would likely result in very different abundances for the -elements (e.g. DWH98). Moreover, given the complexity of the models and the poor statistics of the data at low energies, a significant degeneracy between derived abundances and fitted column density is unavoidable. In view of these considerations, the -element abundances derived here should be considered as purely indicative.
6 Combined spectral & spatial analysis: NGC 253
The results obtained from the spatially-resolved spectral analysis of NGC 253 are shown in Fig.7. The analysis refers only to the MECS data since the quality of the LECS data statistics does not allow a more detailed study.
Spectral fits have been performed in the 3–10 keV band in each of 9 concentric annuli centered on the source and having similar statistics. Based on these fits it is concluded, at a significance level 99.95%, that the temperature decreases with increasing distance from the center. Similar results were obtained from spectral fitting of three different circular regions: center, north and south. These fits show that: (a) the Fe-K line is detected in all three regions (at 99.99 %, 90% and 68%, in the center, north and south, respectively); and (b) the temperature at the center, 6.0 0.4 keV, is significantly higher than in both the north, 3.7 0.5 keV, and south, 3.7 0.6 keV, regions. We are not aware of any instrumental effect that could produce such large differences (despite the poor statistics available) since the BeppoSAX PSF does not vary significantly as a function of energy within the (limited) off-axis distances considered here. No significant spatial variations of either the absorption or the Fe abundance are found. One should, however, bear in mind the limited energy range (1.5–10 keV) available from using only the MECS data for determining the absorption and the limited statistics (and correspondingly large errors) which do not allow a definite measurement of the iron abundance at large radii.
A similar analysis in the case of M82 was not possible because of its smaller, and only marginally significant, spatial extension. It should be noted, however, that analysis of ASCA data (Ptak & Griffith 1999; Matsumoto & Tsuru 1999) presumably shows that X-ray emission comes mostly from the central region of M82.
7 Model-dependence of the best-fit results
Given the various possible contributions to the emission from SBGs, it is essential to quantify the effect of adding an extra power-law component to the best-fit two-temperature model discussed above (Sect. 5). Such an additional spectral component may be due to nonthermal emission from a LLAGN, X-ray binaries (XRBs), supernovae remnants (SNRs), as well as Compton scattering (e.g., Rephaeli et al. 1991). In particular, in M82 some short-term ( hrs) variability (with 30% peak-to-valley variation) is seen in the light curve (see Sect. 3), possibly indicating a contribution from an AGN to the HEX flux. Given the lack of strong point-sources in the ROSAT PSPC/HRI observations of M82 (DWH98; Bregman et al. 1995), these HEX sources could be either highly-variable (see P97) or strongly absorbed at 3 keV. An appreciable non-thermal HEX contribution would presumably result in a reduction of the gas temperature obtained from our best fit, and consequently in an increase of the inferred metal abundances in M82.
We now consider the effect of a non-thermal component in the framework of our derived best-fit model. We repeat the data analysis (with the PDS upper limits included) using a photon index in the range and several values of photoelectric absorption, NH 1022 cm-2. We find that a power-law contribution of 20% and 10% (in the 3–10 keV range) for NGC 253 and M82, respectively, does not improve the fit. In NGC 253, by forcing a =2 power-law contribution to be 50% of the total 3–10 keV flux, the plasma temperature decreases from 5.7 keV to 4.4 keV while the iron abundance increases from 0.3 to 0.5 solar: the fit, however, is slightly worse ( = 5). Likewise, in M82 the plasma temperature decreases from 8 keV to 6 keV, and the iron abundance increases from about 0.08 to 0.25 solar: however, the fit is statistically worse ( = 11). 333 Alternatively, setting the abundances of M82 equal to 0.3 solar, we find that 50% of the 3–10 keV flux must originate from an additional HEX, absorbed component. Likewise, the fit is statistically worse. Because the average XRB spectrum may not be well described by a single absorbed power-law but could require the addition of an Fe-K line emission (most XRBs are known to emit relatively strong Fe-K lines at 6.4 keV and, in some cases, at 6.7 keV) the abundance differences between the cases with and without power-law component may be smaller than what is suggested by this spectral analysis.
To summarize, some contribution from a non-thermal component, while not required (though expected on theoretical grounds), is allowed by the BeppoSAX data. An added motivation for the existence of a non-thermal component in M82 might also be the uncomfortably low iron abundance that is otherwise deduced. The strongest motivation, however, comes from the temporal and spatial analysis of ASCA data (Ptak & Griffiths 1999; Matsumoto & Tsuru 1999). These studies suggest that a HEX component, responsible for most of the 2–10 keV flux and for its time variability, originates from a LLAGN embedded in the nucleus of M82. The fact that we do not see spectral evidence for a power-law component in the BeppoSAX data, may be explained by the relatively low flux state of M82 during our observations, when the putative LLAGN was possibly quiescent.
8 Discussion
8.1 Origin of the LEX emission
The temperature and flux of the low-energy (0.1–2 keV) component for both sources are similar to those obtained from previous observations (compare our results in Table 3 with those of ASCA in Tables 1 and 2 of P97). This is consistent with the conclusions of various authors (P97, DWH98 and references therein) that the LEX emission is most likely the result of both point-source radiation (bright SNRs, X-ray binaries etc.) and of diffuse emission from hot gas, due to either merged SNRs or material shock-heated by the starburst-driven winds. Specifically, for both galaxies, the luminosity of the LEX components is a small fraction ( 1%) of the total power ( erg s-1) available, assuming a SN rate of 0.1 event yr-1 (Antonucci & Ulvestad 1988, Wei et al. 1999), plus a typical SN power of ergs.
The chemical abundances in the low-energy component, deduced for the iron and for the -elements Ne, Mg, Si and S, are in agreement with the predictions of chemical evolution models for SBGs (Bradamante et al. 1998) and superwind models (Suchkov et al. 1994), and hence they too favour the SB-driven galactic superwind picture (Heckman et al. 1990). In such models the galactic wind is powered mostly by Type II SNe (which are predominant [Marconi et al. 1994] and, in fact, dominate the energetics during starbursts) and minimally by Type Ia SNe. Consequently, the resulting wind is overabundant in -elements (ejected during Type II SNe explosions) and underabundant in Fe (of which only a small fraction comes from Type II SNe, whereas the bulk comes from Type Ia SNe). For He, C and N, which are restored by low- and intermediate-mass stars through stellar winds, the predicted abundance is essentially solar. It should be reminded, however, that these considerations should be taken as order-of-magnitude (see Sect. 5).
Similar thermal X-ray components with temperatures corresponding to 0.5–1 keV, often subsolar abundances, and luminosities in the range – erg s-1 have been observed with Einstein, ROSAT and ASCA in a number of other nearby spirals and starburst galaxies (e.g.: Fabbiano 1989, DWH98, Iyomoto et al. 1996; Serlemitsos et al. 1995; Della Ceca et al. 1996, 1997). These studies suggest a common underlying “driver” for the LEX component, i.e. SNRs, whose strenght is proportional to the SN rate. As pointed out in Persic et al. (1998), the important analogy with the Galactic Ridge X-ray Emission (GRXE) should also be stressed. BeppoSAX spectra of NGC 253 and M82 (Fig.6) look indeed remarkably similar to the ASCA 0.4–10 keV spectrum of the GRXE (see Fig.3 in Kaneda et al. 1997). Moreover, rescaling the above energetic arguments to a lower Galactic SN rate of 0.01 yr-1, the GRXE is again 1% of the total energy available from SNe suggesting similar efficiency in transforming mechanical energy into X-ray emission.
In conclusion, the complex LEX X-ray emission from both galaxies is consistent with contributions from mostly SNRs plus a SB-driven superwind.
8.2 Origin of the HEX emission
The origin of the HEX component in NGC 253 and M82 cannot yet be determined. Any viable model of its origin should account for the following BeppoSAX observational results: thermal-like continuum characterized by a 5–8 keV, 6.7 keV Fe-K emission with EW 400 eV (NGC 253) and 60 eV (M82), photoelectric absorption column density of 1022 cm-2, 1040 erg s-1, spatially extended continuum and Fe-K emission (certainly in NGC 253 and possibly in M82), and 30% short-term flux variability in M82.
As in the case of the low-energy component, the present BeppoSAX results highlight an interesting, general similarity with the ASCA observations of the GRXE (Kaneda et al. 1997). Also in this case, a high-energy thermal component is detected with similar temperature and absorbing column density. If scaled for a 1/10 times lower Galactic SN rate, the power in the HEX component is comparable to that from the Galactic ridge. The only spectral difference is an appreciably higher, 0.8 solar, metal abundance deduced from the GRXE. As already recognized by Heckman, Lehnert & Armus (1993), the X-ray data from the plane and the central regions of the Milky Way (Koyama et al. 1986; Yamauchi et al. 1990; Kaneda et al. 1997) are probably one of the best pieces of evidence for a Galactic-scale superwind. This apparent similarity suggests a common physical origin. We note that the origin of the high-energy component from the GRXE (Bleach et al. 1972; Wheaton 1976; Valinia & Marshall 1998, and ref. therein) is still unknown (e.g. Tanaka et al. 1999).
As shown in Sect. 7, a contribution from an additional absorbed high-energy component is consistent with the BeppoSAX data. This caveat should be kept in mind when discussing several hypothesis on the nature of this HEX emission (see below).
8.2.1 Supernova Remnants
As pointed out in Sect. 8.1 for the LEX component, the total energy available from SNRs in these two starburst nuclei is certainly sufficient to drive the X-ray emission power. However, assuming a typical erg s-1, then a large number of SNRs ( for NGC 253 and for M82) are required to power the HEX component while, assuming a SNR shock front of 50 pc radius and a starburst region of 5 kpc radius and 0.5 kpc thickness, SNRs can be at work if the two-phase state of the interstellar matter (ISM) in NGC 253 and M82 are to be preserved. Even neglecting these apparent difficulties, the biggest problem for the SNRs hypothesis is the spectral discrepancy: SNRs usually have substantially lower temperatures ( 3–4 keV) and typically much larger abundances. Therefore, we rule out SNRs as major contributors to the HEX emission.
8.2.2 Compton Scattering
It has been realized that one of the manifestations of the enhanced star formation and SN rates in SBGs is a corresponding increase in the efficiency of the acceleration of protons and electrons to high energies. The main consequence of a strong energetic proton component is a higher rate of ionization and heating of ISM, whereas relativistic electrons give rise to more intense synchrotron and Compton emissions. Moreover, the strong FIR emission from warm dust (heated by stellar emission) further intensifies the emission from Compton scattering of the relativistic electrons on the FIR radiation field (Schaaf et al. 1989; Rephaeli et al. 1991). A detailed convection-diffusion model was proposed for electrons in NGC 253, with the energy density of the electrons normalized by the observed radio flux and estimated mean magnetic field (Goldshmidt & Rephaeli 1995). Calculation of the predicted high energy X-ray emission from Compton scattering of the electrons off the measured FIR emission yielded a 50–200 keV flux in good agreement with what was claimed to have been detected from this galaxy by the OSSE experiment aboard CGRO (Bhattacharya et al. 1994). Irrespective of the reality of the OSSE detection, the model provides adequate description of the expected Compton emission from NGC 253.
As discussed in Section 2, the 13–50 keV NGC 253 flux measured by the PDS is only marginally significant, so a detailed comparison between the model predictions and the PDS data is not meaningful. It is nonetheless interesting to compare the PDS flux level in this band - when viewed as an upper limit - with the level predicted based on the Goldshmidt & Rephaeli (1995) model. Integrating the calculated spectrum from the disk and halo over the band, we compute a flux which is consistent with the PDS upper-limit within a factor of 2. Given the qualitative nature of this comparison and uncertainties in the PDS analysis, the only general conclusion that can be drawn from this rough similarity (in the values of the predicted and measured fluxes) is that the residual (after subtraction of the thermal emission) HEX emission from NGC 253 could indeed be accounted for by Compton emission.
The similarity of the power-law radio index in M82 and best-fit index deduced from a fit to the ASCA measurements, led Moran & Lehnert (1997) to suggest that the main component of the complex emission from this galaxy is due to Compton scattering, whereas P97 found that the ‘harder’ component is equally well fit by either thermal or power-law model. The evidence from our BeppoSAX measurements of significant thermal emission from hot gas which also gives rise to the Fe XXV emission, weakens the need to invoke an appreciable nonthermal component at energies below 10 keV, but the PDS upper-limits in the 13–50 keV band do allow the presence of considerable nonthermal emission in M82. An attempt to quantify the level of this emission in M82 is being made in the ongoing analysis of the results of RXTE measurements of this galaxy (Rephaeli & Gruber 1999).
8.2.3 X-ray binaries
Low-mass and high-mass X-ray binaries (LMXRBs, HMXRBs) may significantly contribute to the total X-ray emission of SBGs. While this is certainly true for their LEX emission, there are several problems for the high energy component. As in the two previous cases, their average X-ray spectra are substantially different from those observed in NGC 253 and M82. Maybe an appropriate combination of LMXRBs and HMXRBs (typically described by exponentially cut-off power-laws with index ) could reproduce a single-temperature thermal continuum, but few of these sources exhibit 6.7 keV lines (they, instead, do show Fe-K lines at 6.4 keV).
The 30% flux variations observed in M82 with BeppoSAX can be taken at first glance as evidence for a significant contribution from X-ray binaries or galactic black-hole candidates (P97). This would require at least a few very strong sources, with 1040 erg s-1. Even ignoring the theoretical difficulties in accounting for such high-luminosity stellar sources, there are several considerations pointing against this scenario; among these: such sources have not been resolved by the ROSAT HRI/PSPC observations (DWH98; but note that strong low-energy absorption may help to explain such discrepancy). Another consideration is that the factor of 4 variability observed by ASCA would require that several of these sources have varied in phase, a condition which seems rather unlikely (Ptak & Griffiths 1999; Matsumoto & Tsuru 1999).
Finally, an XRBs scenario for NGC 253 would require two different populations of XRBs in order to explain the lower temperature at larger radii: one population with harder spectra near the nuclear region, and another one with softer spectra in the outer disk regions.
Thus, we conclude that it is unlikely that XRBs are sources of a significant part of the HEX component.
8.2.4 Hidden LLAGN
The substantial photoelectric absorption obtained from our best-fits require a high hydrogen column density, cm-2. M82 shows short-term (e.g. this work) and long-term (see Ptak & Griffiths 1999) variability. These results suggest that there could be a considerable contribution from a buried LLAGN, with the dust (abundant in actively star-forming regions) explaining the observed intrinsic absorption. It should be noted that in this hypothesis we do not differentiate between a LLAGN and a (possible) medium-mass black hole candidate with 102-4 M⊙ (see Ptak & Griffiths 1999).
However, the BeppoSAX spectra of both M82 and NGC 253 strongly prefer a thermal description for the HEX emission rather than a power-law component, ubiquitous in AGNs (see Sect. 5). The LLAGN scenario is certainly ruled out in the case of NGC 253 because the BeppoSAX data have shown that both its HEX continuum and its Fe-K line emission are extended, and that this extended component contributes more than 40% to the total 3–10 keV emission.
Nevertheless, as detailed below, we cannot exclude some significant, but not dominant, LLAGN contribution in M82. The BeppoSAX observations can be reconciled with the conclusions obtained from the long-term ASCA studies (Ptak & Griffiths 1999; Matsumoto & Tsuru 1999) if one supposes that during the BeppoSAX observation the central LLAGN was in a relatively low state and its HEX emission was swamped by the thermal emission associated with the starburst itself.
8.2.5 A spectral conspiracy?
Another possibility would be to consider a combination of SNRs with emission from Compton scattering, XRBs and/or a LLAGN. In this case, SNRs are a necessary ingredient in order to produce the observed 6.7 keV line and would contribute with a lower (than observed) temperature thermal spectrum. The second component (Compton scattering, XRBs and/or LLAGN) would contribute with an absorbed power-law component. The combination of the two could then “mimic” the measured high-temperature thermal HEX component. A similar explanation, although with a different physical interpretation, has been proposed by Valinia & Marshall (1998) to explain the high-temperature emission from the GRXE.
Even though not warranted, a “spectral conspiracy” may be possible within the BeppoSAX data (see sect.7). It should be noted, however, that in such a case it would be more natural to combine SNRs, Compton scattering and/or XRBs in order to explain the extension of the HEX emission from NGC 253, while a contribution from a LLAGN would explain the short- and long-term variability observed in M82. Higher quality data, such as those expected from the Chandra, XMM and satellites, could possibly clarify the contribution from these different components. In particular, if our hypothesis for M82 is correct, we predict that the equivalent width of the Fe-K line (produced by thermal emission from SNRs) should increase with decreasing 2–10 keV flux (which is affected by the time-varying LLAGN power-law contribution).
8.2.6 The Superwind Model
In this subsection, we consider a simple, alternative explanation for the HEX component that requires no spectral fine-tuning. Such an alternative explanation is that the emission is truly originating from a hot thermal plasma. Our spatial analysis shows that this plasma is extended, at least in NGC 253, along the disk and possibly along its minor axis direction (Sect. 4, Fig.2). In both the HEX and LEX emissions, the diffuse emission we observe may be related to the same superwind phenomenon (Heckman et al. 1990).
On one hand, this interpretation raises a basic question: what is the mechanism producing such high plasma temperatures ( keV in NGC 253 and 8 keV in M82) and high luminosities? Indeed, hydrodynamical simulations of superwinds do predict HEX emission at such high temperatures, but with a lower than observed HEX/LEX luminosity ratio (Suchkov et al. 1994).
On the other hand, this interpretation is the most straightforward and can explain all the observational results. The chemical abundances of the HEX component, consistent with those deduced for the LEX component, are likewise in agreement with the trend expected for SB-driven superwind models (see Sect. 8.1) and hence are compatible with a SN origin for (a substantial fraction of) the HEX component. Of course, if the HEX component of thermal X-ray emission is found to originate in the wind material ejected from the starburst (rather than from the wind-shocked interstellar material), one may expect a higher abundance of heavy elements (Suchkov et al. 1994). In both galaxies, however, Fe in the nuclear regions could have been strongly depleted (relative to lighter elements) by the plentiful dust and warm ISM clouds (Telesco 1988, P97). The superwind model also offers a natural explanation for both the X-ray brightness profile (Sect. 4) and temperature profile (Sect. 6) of NGC 253 since it predicts that the pressures/densities should decline systematically at large radii, thus reducing both emissivity and temperature, as observed (Heckman et al. 1990).
The substantial photoelectric absorption might seem difficult to explain in the (extended) superwind scenario. However, one should consider the following: i) given our limited spatial resolution, it’s still possible that absorption may affect only the fraction of the HEX component that comes from the nuclear region; ii) similar results are found for the GRXE (see Kaneda 1998 for estimates on how such absorption is distributed along the Galactic plane and largely affects also the outer parts of the Galactic disk); and iii) there are several lines of evidence for molecular gas/dust outflows reaching out several kpc from the nucleus (Alton et al. 1999; Wei et al. 1999). Independent estimates of the X-ray absorption column densities can be obtained from the extinction measured in (e.g.) the K band (2.2 peak), using the conversion formula: = cm-2 (Telesco et al. 1991 and ref. therein). Telesco et al. (1991) and Rieke et al. (1980) applied such formula to M82 and NGC 253 obtaining NH cm-2 and cm-2 respectively, consistent with our derived values.
In summary, although it is not clear yet whether a superwind scenario could explain the origin of the observed HEX emission, the simplicity of this interpretation, along with the analogy with the GRXE, make this model somewhat more attractive. In the following, therefore, we explore the implications of a superwind scenario as the main origin of the HEX emission.
8.2.7 Estimates and implications from the Superwind model
If one assumes that a superwind-driven hot, diffuse, gas is responsible for the bulk of the HEX emission, the first immediate consequence is that such thermal gas cannot be confined by gravity. Following Wang et al. (1995), the observed temperatures ( 6.7/9.5 107 K for NGC253/M82) are in fact much higher than the “escape temperature” ( 2/1 106 K for NGC253/M82; Wang et al. 1995) of the gas in these galaxies.
¿From the normalizations of the HEX components (col. 2 of Table 4), one can derive some other interesting parameters (see Table 4): the gas average density () and pressure (), total mass (), radiative cooling time (), and bulk velocity (). For these calculations, we used the simplified formulae from Della Ceca et al. (1997) except for that we take from equation 5.23 of Sarazin (1988). [Average values have been computed over the X-ray emitting region assuming a sphere with radius kpc in both galaxies (corresponding to 1.5 , see Sect. 4), and parameterizing the gas clumpiness by a filling factor . We also provide in Table 4 the mass outflow rate (Ṁbulk) from
where the gas density at 3 kpc () has been calculated assuming a density profile of the form
(see Sect. 4 and equation 5.63 in Sarazin 1988).
We note that both the Fe and -element abundances are similar to those found in cluster of galaxies. From the gas bulk velocity and cooling time, one can derive a typical dimension 3 Mpc, where the gas expelled from the galaxies can be redistributed. This value is of the order of the size of cluster of galaxies suggesting the possible relevance of this observation for the problem of the ICM metal enrichment.
However, assuming a starburst lifetime of 107 yr for both NGC 253 (Engelbracht et al. 1998) and M82 (Satyapal et al. 1997), and Ṁbulk 24 (52) M⊙ yr-1 for NGC 253 (M82), the mass ejected would be 2.4 (5.2) 108 M⊙. Taken at face value, such a “small” ejected mass would eventually require too large a number ( 105) of SBGs to make all of the 1014 M⊙ of a typical cluster, but may nevertheless be significant. Given the 0.1 yr-1 SN rates of NGC 253 and M82, and assuming that each SN ejects 10 M⊙ of gas, most of the gas ( 95%) expelled by the galaxies must necessarily be ambient ISM gas “swept-up” by the superwind. The low Fe abundances derived here may therefore be indicative of low abundances in the disk ISM involved in the starburst.
In the following, we check whether the SNe-driven superwind scenario is energetically self-consistent. The total thermal energy required to heat the gas of NGC 253 (M82) is 6 (16) 1056 erg. These numbers are of the order of the total energy available from SNe ( erg), assuming a SN rate of 0.1 SN yr-1, that each SN releases 1051 erg, and a typical burst duration of 107 yr, and indicate that SNe alone may have supplied the total energy present today in the superwind. This agreement holds, however, if one assumes the gas to be in equilibrium and stationary while, as outlined above, the high gas temperature implies that the gas is probably being expelled out of the galaxy. One can then approximate the thermal energy lost in the outflow Ėth as Ė 3 (7) 1050 erg yr-1 for NGC 253 (M82). This value should be compared with the maximum energy rate of 1050 erg yr-1 available from SNe. Therefore, the superwind hypothesis faces a slight energy replenishment problem. It should be noted that the same problem is not present for the LEX component since in this case, both temperature and mass outflow rate are lower by about an order of magnitude, thus resulting in a thermal energy loss rate 100 times lower which is thereby more than consistent with the energy available from SNe. A solution to this problem may come from one of the following possibilities: i) additional energy sources may come from either the intense stellar winds of “pre-SN stars”, and/or intense UV flux by young stars, and/or a higher SN rate in the past; ii) the filling factor is 1; iii) the gas does not escape from the galaxy but is confined to it (e.g. by some higher than usual interstellar clouds/gas pressure); or iv) there is a more exotic powering mechanism, as outlined below. In conclusion, our simplified estimates indicate no strong inconsistency in the starburst-driven superwind scenario.
Finally, we wish to point out also the similarities of the present results with the X-ray luminous SBGs NGC 3310 and NGC 3690 that exhibit very similar X-ray spectra (Zezas et al. 1998). As a matter of fact, the HEX components found in these sources are statistically (although not significantly) better fit with a thermal model (with 10 keV) rather than with a power-law model. This suggests that the above considerations may apply also to higher luminosity SBGs and, as such, may be rather general to SBGs.
8.2.8 Other mechanisms
Based on recent RXTE data on the non-thermal component in the GRXE HEX flux, which contributes 50% of the total 3–10 keV spectrum and reaches up to 30 keV, Valinia & Marshall (1998) propose an explanation in terms of non-thermal bremsstrahlung emission by energetic electrons accelerated by SNRs. However, this would still require a “spectral conspiracy” as discussed in Sect. 8.2.5, and is furthermore constrained by the PDS upper limits above 10 keV. More appealing could be another mechanism, also first proposed to explain the GRXE observations (Tanaka et al. 1999), that could explain the HEX continuum plus 6.7 keV line: charge exchange by low-energy heavy ions with neutral gas in the galaxies. A magnetic confinement picture has been proposed by Makishima (1994, 1996) to explain, again, the production of the GRXE HEX emission. In this model, some fraction of the cooler plasma, confined by magnetic loops in the galactic disk, is heated to the observed temperature by the dissipation of the galaxy’s rotational and velocity dispersion energy through magnetic compression and reconnection (see Tanuma et al. 1999). This solution has the merit of providing a natural explanation for the confinement of the gas (through the magnetic field) and its heating to high temperatures.
More quantitative work on these models are, however, required in order to estimate their applicability also to SBGs.
9 Summary
NGC 253 and M82 have been observed by BeppoSAX in the 0.1–60 keV energy range. The spectra are complex, exhibiting several emission lines, and including a LEX component and an absorbed HEX one. The analysis of the LEX emission is problematic (due to limited statistics and low spatial resolution), but is consistent with emission from SNRs, X-ray binaries and mildly-hot diffuse gas heated by a SN-driven superwind, as found by other authors (e.g. P97 and ref. therein). As for the latter, the detection of ionized Fe-K emission lines and high-energy continuum cut-offs in the spectra of both SBGs, and the evidence that such HEX component is extended, indicate strongly that a thermal hot ( 5–8 keV) plasma produces most of the HEX emission ( 1–5 1040 ergs-1). Fe abundances are found to be 0.3 solar in NGC 253 and 0.07 solar in M82. A contribution by an additional non-thermal absorbed power-law component is possible, but the present analysis suggests that this is 20%.
We have also discussed several possible alternative explanations for the origin of the HEX component. Possible candidates include SNRs, Compton scattering, XRBs, absorbed LLAGN, and superwind thermal emission to varying degrees. More exotic explanations such as charge exchange processes, non-thermal bremsstrahlung emission or magnetic reconnections have also been discussed. We have shown however that, in spite of some inconsistencies with hydrodynamical models predictions, direct thermal emission from a hot superwind is a likely candidate for the origin of the HEX component. It has the advantage that it can explain most naturally and directly the observational results and does not require any spectral fine-tuning to produce the observed thermal 3–10 keV spectrum. We evaluated the energetic balance taking into account the various energy sources available during the starburst (e.g. SNe explosions, stellar winds and intense UV flux from young stars) and concluded that there is currently no severe inconsistency with the proposed starburst-driven superwind model.
Altogether, our results highlight the significance of high-energy phenomena in actively star-forming galaxies, as previously predicted (e.g. Bookbinder et al. 1980; Heckman et al. 1990, 1993 and ref. therein).
-
Acknowledgements.
We acknowledge partial support by the Italian Space Agency under the contract ASI-ARS-98-119 and by the Italian Ministry for University and Research (MURST) under grant Cofin-98-02-32We acknowledge financial support from ASI and MURST. MC thanks R. DellaCeca, F. Fiore, L. Ciotti, A. D’Ercole and S. Mariani, for helpful discussions.
References
- 1 Alton P.B., Davies J.I., & Bianchi S., 1999, A&A 343, 51
- 2 Anders E., Grevesse N., 1989, Geochimica et Cosmochimica Acta 53, 197
- 3 Antonucci R.R.J., & Ulvestad J.S., 1988, ApJ 330, L97
- 4 Arnaud K.A., 1996, Astronomical Data Analysis Software and Systems V, eds. Jacoby G. and Barnes J., p17, ASP Conf. Series volume 101
- 5 Bhattacharaya D., The L.-S., Kurfess J. D., et al. 1994, ApJ 437, 173
- 6 Boella G., Chiappetti L., Conti G., et al., 1997, A&AS 122, 327
- 7 Bookbinder, J., Cowie, L.L., Krolik, J.H., Ostriker, J.P., Rees, M. 1980, ApJ, 237, 647
- 8 Bradamante F., Matteucci F., D’Ercole A., 1998, A&A 337, 338
- 9 Bleach R.D., Boldt E.A., Holt S.S., et al., 1972, ApJ 174, L101
- 10 Bregman J.N., Schulman E., Tomisaka K., 1995, ApJ 439, 155
- 11 Cappi M., Persic M., Bassani L., et al., 1999, to appear in Advances in Space Research, Proceedings of the 32nd Sci. Ass. of COSPAR, (astro-ph/9902021)
- 12 Chiappetti L., Dal Fiume D., 1997, in Proceedings of “5th International Workshop on Data Analysis in Astronomy”, Ed. Scarsi L. & Maccarone M.C.
- 13 Dahlem W., Weaver K.A., Heckman T.M., 1998, ApJS 118, 401 (DWH98)
- 14 Dickey J.M., Lockman F.J., 1990, ARA&A 28, 215
- 15 Della Ceca R., Griffiths R.E., Heckman T.H., MacKenty J.W., 1996, ApJ 469, 662
- 16 Della Ceca R., Griffiths R.E., Heckman T.H., 1997, ApJ 485, 581
- 17 Della Ceca R., Griffiths R.E., Heckman T.H., Lehnert M.D., Weaver K.A., 1999, ApJ 514, 772
- 18 Engelbracht, C.W., Rieke M.J., Rieke G.H., et al., 1998, ApJ, 505, 639
- 19 Fabbiano G., 1989, ARA&A 27, 87
- 20 Fabbiano G., Trinchieri G., 1984, ApJ 286, 491
- 21 Fiore, F., Guainazzi, M. & Grandi, P. 1999, SDC report ftp://www.sdc.asi.it/pub/sax/doc/software_docs/ saxabc_v1.2.ps.gz
- 22 Frontera F., Costa E., Dal Fiume D., et al. 1997, in proceedings of “EUV, X-ray, and Gamma-ray Instrumentation for Astronomy VIII”, SPIE, 3114, 206
- 23 Goldschmidt O., Rephaeli Y., 1995, ApJ 444, 113
- 24 Heckman T.M., Armus L., Miley G.K., 1990, ApJS 74, 833
- 25 Heckman, T.M., Lehnert, M.D., & Armus, L., 1993, in “The Environment and Evolution of Galaxies”, Ed. J.M. Shull & H.A. Thomson (Dordrecht:Kluwer), 455
- 26 Heckman T.M., 1998, in the proceedings of conference “Origins”, ASP Conference Series, Vol. 148, Ed. Woodward C.E., Shull J.M. & Thronson H.A., p127
- 27 Heckman T.M., 1999, in “After the Dark Ages: When Galaxies were Young”, Ed. S. Holt & E. Smith, American Institute of Physics Press, p. 322
- 28 Ikeuchi S., Norman C.A., 1991, ApJ 375, 479
- 29 Iyomoto N., Makishima K., Fukazawa Y., et al., 1996, PASJ 48, 231
- 30 Iyomoto N., 1999, PhD thesis, Univ. of Tokyo
- 31 Kaneda H., Makishima K., Yamauchi S., et al., 1997, ApJ 491, 638
- 32 Kaneda H., 1998, PhD thesis, Univ. of Tokyo
- 33 Koyama K., Makishima K., Tanaka Y., Tsunemi H., 1986, PASJ 38, 121
- 34 Liedahl D.A., Osterheld A.L., Goldstein W.H., 1995, ApJ 438, L115
- 35 Maccacaro T., Gioia I., Wolter A., Zamorani G., Stocke J.T., 1988, ApJ 326, 680
- 36 Madau P., Fergusson H.C., Dickinson M.E., et al., 1996, MNRAS 283, 1388
- 37 Maiolino R., Salvati M., Bassani L., et al., 1998, A&A 338, 781
- 38 Makishima K., 1994, in proceedings of “New Horizon of X-ray Astronomy”, Universal Accademy press, p. 171
- 39 Makishima K., 1996, in proceedings of “X-ray Imaging and Spectroscopy of Cosmic Hot Plasmas”, Ed. Makino F. & Mitsuda K., Universal Accademy Press, p. 137
- 40 Malizia A., Bassani L., Zhang S.N., et al., 1999, ApJS, in press (astro-ph/9902054)
- 41 Manzo G., Giarrusso S., Santangelo A., et al., 1997, A&AS 122, 341
- 42 Marconi G., Matteucci F., Tosi M., 1994, MNRAS 270, 35
- 43 Matsumoto H., & Tsuru T.G., 1999, PASJ, in press (astro-ph/9904058)
- 44 Mewe, R., Gronenschild, E.H.B.M., and van den Oord, G.H.J. 1985, A&AS 62, 197
- 45 Moran E.C., Lehnert D., 1997, ApJ 478, 172
- 46 Parmar, A., Martin D.D.E., Bavdaz M., et al., 1997, A&AS 122, 309
- 47 Pellegrini S., Cappi M., Bassani L., et al., 1999, submitted to A&A
- 48 Persic M., Mariani S., Cappi M., et al., 1998, A&A 339, L33
- 49 Ptak A., Serlemitsos P., Yaqoob T., Mushotzky R. & Tsuru T., 1997, AJ 113, 1286 (P97)
- 50 Ptak A., Griffiths R., 1999, ApJ 517, L85
- 51 Read, A.M., Ponman T.J., Strickland D.K., 1997, MNRAS 286, 626
- 52 Rephaeli Y., Gruber D., Persic M., McDonald D., 1991, ApJ 380, L59
- 53 Rephaeli Y., Gruber D., Persic M., 1995, A&A 300, 91
- 54 Rephaeli Y., Goldshmidt O., 1995, ApJ, 444, 113
- 55 Rephaeli Y., Gruber D., 1999, in preparation
- 56 Rieke G.H., Lebofsky M.J., Thompson R.I., Low F.J., Tokunaga A., 1980, ApJ, 238, 24
- 57 Sarazin C.G., 1988, “X-ray emission from clusters of galaxies”, Cambridge University Press
- 58 Satyapal S., Watson D.M., Pipher J.L., et al., 1997, ApJ, 483, 148
- 59 Schaaf R., Pietsch W., Biermann P.L., Kronberg P.P., Schmultzler T., 1989, ApJ 336, 722
- 60 Serlemitsos P., Ptak A., Yaqoob T, 1996, “The physics of Liners”, ASP Conference Serie, Ed. M. Eracleous, Koratkar A., Leitherer C., and Ho L., (Baltimore: STScI), p.70
- 61 Suchkov A.A., Balsara D.S., Heckman T.M., Leitherer C., 1994, ApJ 430, 511
- 62 Tanaka Y., Hasinger G., Miyaji T., 1999, in proceedings of “Heating and Acceleration in the Universe”, Tokyo, in press
- 63 Tanuma S., Yokoyama T., Kudoh T., et al., 1999, PASJ 51, 161
- 64 Telesco C.M. & Harper D.A., 1980, ApJ 235, 392
- 65 Telesco C.M., 1988, ARA&A 26, 343
- 66 Telesco C.M., Joy M., Dietz K., Decher R., Campins H., 1991, ApJ, 369, 135
- 67 Tsuru T.G., Awaki H., Koyama K., Ptak A., 1997, PASJ 49, 619
- 68 Valinia A., Marshall F.E., 1998, ApJ 505, 134
- 69 Wang D., Walterbos R., Steakley M., Norman C., Braun R., 1995, ApJ 439, 176
- 70 Wheaton W.A., PhD thesis, University of California at San Diego (UCSD), 1976
- 71 Wei A., Walter F., Neininger N., Klein U., 1999, A&A 345, L23
- 72 Yamauchi, S., Kawada M., Koyama K., et al., 1990, ApJ 365, 532
- 73 Zezas A.L., Georgantopoulos I., Ward M.J., 1998, MNRAS 301, 915
Table 2: Basic Line Parametersa
| NGC 253 | M82 | |||
|---|---|---|---|---|
| Obs. E | Intensity | Obs. E | Intensity | Possible Identifications |
| (keV) | (10-4 ph. cm-2s-1) | (keV) | (10-4 ph. cm-2s-1) | (nearest Kα lines of H- and He-like ions) |
| Low Energy Linesb | ||||
| 0.51 | 4.4 | OVII (0.57 keV) | ||
| 0.66 | 3.9 | OVIII(0.65 keV) | ||
| 0.72 | 11.3 | OVIII,NeIX and less ionized species | ||
| 0.90 | 2.7 | 0.89 | 15.5 | NeIX(0.918 keV) |
| 1.10 | 0.8 | 1.09 | 5.9 | NeX(1.02 keV)-FeL ( 0.8-1.1 keV) |
| 1.39 | 0.4 | 1.35 | 2.9 | MgXI(1.35keV)-MgXII(1.47 keV) |
| 1.88 | 0.3 | 1.88 | 2.2 | SiXIII(1.86 keV) |
| 2.41 | 0.2 | 2.49 | 0.8 | SXV(2.45 keV) |
| 3.65 | 0.2 | ArXVI(3.13 keV)-CaIXX (3.85 keV) | ||
| Fe-Kα Linesc | ||||
| 6.4 (fixed) | 0.04 | 6.4 (fixed) | 0.15 | Fe I (6.4 keV) |
| 6.69 | 0.16 | 6.63 | 0.16 | Fe XXV (6.69 keV) |
Note: Intervals are at 90% confidence for one interesting parameter.
a Obtained by fitting the MECS+LECS data with a continuum model consisting in a two-temperature bremsstrahlung model with temperature and absorption fixed to the best-fit values obtained in Sect. 5 (see Table 3).
b Equivalent widths were ranging from a few hundred eV to a few tens eV.
c Equivalent widths of the detected Fe-K lines at 6.7 keV were 400 eV for NGC 253 and 60 eV for M82.
Table 3: Best-fit two-components (vmekal) thermal models
| Source | soft | Absoft | hard | Ab | / | / | ||
|---|---|---|---|---|---|---|---|---|
| keV | el. | keV | el. | 10-12 | 1040 | |||
| Fe, Ni | cm-2 | Fe, Ni | erg cm-2s-1 | erg s-1 | ||||
| NGC253 | 191/180 | 3/4.8 | 0.8/1.5 | |||||
| M82 | 169/135 | 11.4/29 | 1.6/5.9 | |||||
Note: Intervals are at 90% confidence for one interesting parameter.
a Abhard was set equal to Absoft for the elements.
Table 4: Physical conditions of the hot X-ray emitting gasa
| Source | Kb | Ṁbulk | |||||
|---|---|---|---|---|---|---|---|
| () | ( cm-3) | ( dyne cm-2) | ( M⊙) | ( yr) | ( km s-1) | ( M⊙ yr-1) | |
| NGC 253 | 4.5 | 2.2 | 4 | 4.6 | 3.2 | 1050 | 24 |
| M82 | 22 | 3.9 | 1 | 8.3 | 2.1 | 1250 | 52 |
a The values are averaged over the X-ray emitting volume (sphere with radius kpc)
b normalizations of the hard components at 1 keV, in units of [, where is the distance to the source in cm, is the electron density in units of cm-3, and is the volume filled by the X-ray emitting gas in cm-3.