Abstract
P Cygni is a prototype for understanding mass loss from massive stars. This textbook star is known first of all because of two great eruptions in the 17th century. In the first half of this century it has given its name to a class of stars which are characterized by spectral lines consisting of nearly undisplaced emissions accompanied by a blue-displaced absorption component. This characteristic P Cygni-type profile betrays the presence of a stellar wind, but P Cygni’s wind is quite unlike that of other hot supergiants. P Cygni was the first star that showed the effects of stellar evoluton from a study of its photometric history. It shares some common properties with the so-called Luminous Blue Variables. However, P Cygni is a unique object.
This review deals with P Cygni’s photometric properties, its circumstellar environment - including infrared and radio observations - and its optical and ultraviolet spectrum. Smaller sections deal with P Cygni’s wind structure and evolution.
Key words: Stars: individual – P Cygni: Stars: early-type – Stars: mass loss – Stars: stellar winds
Section 1 Historical overview
About 400 years have elapsed since the Dutch chartmaker, mathematician and geographer Willem Janszoon Blaeu recorded P Cygni (34 Cyg, HR 7763, HD 193237) as a nova. It was discovered on August 18th of the year 1600 when it suddenly reached 3rd magnitude. After remaining at its maximum for about 6 years, the brightness started to decrease and the star became invisible to the naked eye in 1626. It reappeared in 1654 and remained at 3rd magnitude until 1659. The visual magnitude of the star was variable between 1660 and 1683 and started to increase slowly until 5.2 was reached in 1780. Except for a few observations by Herschel in the 1780s, there is no record of variations between 1780 and 1870. Since then P Cygni’s brightness has increased slowly by 0.4 magnitudes to bring it to its current value of V=4.83. Analysis of historical observations of P Cygni has shown that between 1700 and 1988 its overall brightness slowly increased by 0.150.02 magn/century (de Groot and Lamers 1992). The light curve of P Cygni after 1600 AD is displayed in Fig. 1.
The first spectra of P Cygni, obtained as early as 1897, already showed the famous P Cygni-type spectral lines (Fig. 2); an undisplaced emission accompanied by a shortward displaced absorption core (Maury 1897). Initially this was interpreted as a blend of two different lines. McCrea (1929) and Beals (1930a, 1932) were the first to interpret P Cygni-type profiles in novae, Wolf-Rayet stars and P Cygni itself as due to a radially expanding stellar envelope. Later investigations by Struve (1935), Beals (1935) and Struve and Roach (1939) have shown that the outflowing matter is accelerated throughout the observed region since the lower-excitation lines, which presumably form in the remotest part of the envelope, systematically have the highest observed outflow velocities. Early serious detailed analyses of P Cygni’s spectrum have been carried out by Beals (1950), Hutchings (1969) and de Groot (1969). Some identifications and measured equivalent widths from moderate-dispersion spectra were presented by Luud (1967a). More recently, Johnson et al. (1978), Stahl et al. (1993) and Markova (1994) have published spectral atlases with identifications of many weak lines in the visual spectral region. More than one hundred photographic spectra have been obtained between 1980 and 1990 by N. Markova with the coudé spectrograph of the 2m RCC telescope at the Bulgarian National Astronomical Observatory. Another monitoring programme has been carried out by Stahl et al. (1993, 1994) using a fiber-linked echelle spectrograph with EEV CCD coupled to the Heidelberg (Germany), 70 cm telescope in Tautenburg (Germany) and the 2.2 m telescope in Calar Alto (Spain). The study of high-resolution and high-signal-to-noise (S/N) spectra has resulted in an abundance of information about the radial-velocity and line-profile variations of the spectral lines.
The Copernicus satellite obtained the first spectra of P Cygni in the non-visible ultraviolet region (Hutchings 1976; Ambartsumian et al. 1979). A large number of high- and low-resolution ultraviolet spectra has been obtained with the IUE satellite and analysed by Cassatella et al. (1979), Hutchings (1979), Underhill (1979, 1982), Luud and Sapar (1980), Lamers et al. (1983), Lamers et al. (1985) and Israelian et al. (1996).
Near-IR and IR observations have been reported by Barlow and Cohen (1977), Abbott et al. (1984), Waters and Wesselius (1986), and Lamers et al. (1996). Barlow and Cohen (1977) used infrared and radio observations in order to estimate the mass-loss rate. The radio data, which directly measure the amount of ionized gas beyond the acceleration zone of the stellar wind, are able to provide a firm estimate of the mass-loss rate so long as the terminal velocity of the wind is known. Submillimeter and radio data have been obtained by White and Becker (1982), Becker and White (1985) and Altenhoff et al. (1994) while Wendker (1987) has compiled all observations in the range 0.33–20 cm.
P Cygni is located in the upper part of the Hertzprung-Russell (HR) diagram populated by different types of emission-line stars, including Of supergiants, O3If/WN6, Ofpe/WN9, B[e], Luminous Blue Variables (LBVs) and Wolf-Rayet (WR) stars (Fig. 3). It is clear that all these classes represent different phases in the evolution of stars with zero-age main-sequence (ZAMS) masses of more than 40. This is the least understood phase of the evolution of massive stars. Though it is commonly accepted that massive O stars ultimately evolve into WR stars (Maeder and Meynet 1987), the details of the evolutionary connections in the intermediate phases are not yet understood. Objects like P Cygni, Car, AG Car and S Dor are ideal laboratories to be used to understand all missing links in the evolutionary chain O WR. A complete review of LBVs has been given by Humphreys and Davidson (1994). Note that the class of LBVs is not defined by some spectroscopic classification criterion and that, obviously, it may contain stars in different evolutionary states. The fact that several LBVs are located near the so-called Humphreys-Davidson (HD) upper luminosity limit on the HR diagram (Fig. 3) suggests that very massive hot stars do not evolve into red supergiants but somehow reverse their tracks near the HD upper luminosity limit after a significant fraction of their mass is lost. The physics of the mass loss from LBVs is not yet understood. Almost all LBVs, except P Cygni, show moderate-amplitude cyclic spectrophotometric variability with timescales of years to decades. The amplitude of the photometric variability can reach up to 2 mag and stars can change their spectral type from early B to F. It is not yet clear what is happening with a star when it is changing its spectral type. There are some reasons to believe that the bolometric luminosity of LBVs may not be constant between minimum and maximum state. Most curiously, some LBVs do not show a general correlation between mass loss and radius when they move on the HR diagram (Leitherer 1997). However, all these conclusions must be considered as provisonal since the number of LBVs studied in detail during their moderate- or large-amplitide excursions on the H-R diagram is very small.
Though P Cygni and Car are the first LBVs known, later discoveries of other LBVs, e.g. S Dor and AG Car, has shown that the former are not really representative of the class. While both should be classified as LBVs - massive stars () in a critical phase of their post main-sequence evolution when they become unstable and may eject a significant fraction of their mass in a relatively short time - they do not share many properties. The properties of Car have been the subject of a recent review paper by Davidson and Humphreys (1997). We feel it necessary to restore some balance by presenting another review paper which summarises our knowledge about another enigmatic object: PC̃ygni.
Section 2 Photometric observations
2.1 The giant eruptions and long-term variability
In their review paper, Humphreys and Davidson (1994) have used the term astronomical geyser to describe highly unstable processes going on in the atmospheres of Car, P Cygni, S Dor, AG Car and other LBVs. Indeed, there is a similarity with volcanic geysers: moderate activity followed by violent burbling, then the huge eruption followed by relative quiescence. Only four LBVs, specifically Car, P Cygni, V12 in NGC 2403, SN 1961V, have had giant eruptions in which the star brightened by more than two magnitudes. More than one solar mass can be ejected during these giant eruptions which may last for decades. The fact that only four LBVs have passed through the giant-eruption phase can be interpreted in different ways. It is possible that the time interval between giant eruptions is very long (centuries) and that not all LBVs have yet experienced them. Another possibility is that not all LBVs show giant eruptions. However, AG Car, HR Car and R127 may have had giant eruptions as is evidenced by the presence of massive and extended nebulosities around them (Humphreys and Davidson 1994; Nota et al. 1995). Using the number of known LBVs and the number of known eruptions one can estimate a time-scale of giant eruptions 103 years.
It is interesting to compare P Cygni’s and Car’s environments. Both stars have experienced dramatic outbursts a few hundred years ago. The Homunculus of Car, formed by ejecta of the giant eruption that was observed between 1830 and 1860, is one of the most colourful bipolar nebulae known. P Cygni’s nebula, on the other hand, is spherically symmetric and hardly observable at optical wavelengths (Leitherer and Zickgraf 1987; Johnson et al. 1992). Recently, it has been resolved by imaging (Barlow et al. 1994; Nota et al. 1995; Meaburn et al. 1996). The question is: why do these two LBVs, Car and P Cygni, have such very different nebulae? Could it be that their giant eruptions are governed by different physics? No other LBV is similar either to P Cygni or to Car. The only reasons which make us place these two objects into the same evolutionary group are their locations on the HR diagram and the giant eruptions they have experienced. Is this similarity enough to claim convincingly that both stars are in the same evolutionary state?
Our understanding of the physics of giant eruptions is based primarily on historical observations. In the years after the 17th-century eruptions, and aided by the increased use of telescopes at that time, many observers provided estimates of P Cygni’s brightness. Of course, for the first three centuries after AD 1600 these were visual estimates made with or without a telescope and by many different observers. As a result, these early photometric data are not very homogeneous. However, quite an extensive record of these observations has been assembled by the authors of the various issues of the “Geschichte und Literatur des Lichtwechsels der veraenderlichen Sterne” (Müller and Hartwig 1918; Prager 1936; Schneller 1957). A number of additional observations between 1596 and 1917 is given by Zinner (1926). From all these records a fairly accurate picture of P Cygni’s secular photometric history can be reconstructed.
The brightness of the star went through deep minima after the two outbursts in 1600 and 1655 AD (Fig. 1). The matter ejected in the major outbursts most likely condensed into dust rings which expanded into space. The reddish colour of P Cygni during the outbursts has been recorded by several observers. However, various uncertainties do not allow us to distinguish between a circumstellar and an intrinsic origin of this colour. In other words, the historical observations do not provide enough evidence to check whether the star had the same Mbol as at present or whether it was much brighter. Two possibilities have been suggested by Lamers and de Groot (1992). If the mass loss was high during the outburst in 1600 AD, then the reddish colour observed at that time could have been due to the large circumstellar reddening and the larger value (at least one magnitude) of the bolometric magnitude. However, if the circumstellar extinction was small during the outbursts, the observed colour would indicate an effective temperature as low as 5500 K, if the bolometric magnitude of the star was the same as the present value. It is very important to answer the following question: can a LBV like P Cygni evolve down to = 5500 K or must it stop near 8000–10 000 K as many other LBVs do during their excursions on the HR diagram?
It is believed that LBVs at their maximum do not pass beyond the opaque-wind limit (Davidson 1987) because the opacity in the envelope decreases drastically below T 8000 K due to hydrogen recombination. Langer et al. (1994) suggested that LBVs never become cooler than about 10 000 K because of the large mass loss near the instability limit.
It is not yet clear which physical processes are responsible for giant eruptions in LBVs and we cannot rule out the possibility that different mechanisms work in different stars depending on rotation, luminosity, etc. The giant eruption of Car took place between 1830 and 1860 when the star increased its total luminosity reaching M . It remained of the first magnitude for 20 years and then faded down to 8th magnitude. As from 1935 it has been brightening to its current value V 5.2 mag (van Genderen et al. 1994; IAUC 7146). The luminous energy released during the Great Eruption ( 1049 ergs) was about the same as in a supernova explosion. This eruption was more dramatic then the one observed in P Cygni. Furthermore, the eruptions of P Cygni and Car have produced different types of nebulae (Nota et al. 1995). The fact that Car is more luminous than P Cygni does not seem to provide the full answer. More likely it has something to do with the geometry (binarity, magnetic fields, interacting winds?). Therefore, to the question raised by Davidson and Humphreys (1997) “Is Eta really an LBV?” we can add another one: “Is P Cygni really an LBV?”. Indeed, according to Nota et al. (1995) Car’s bipolar nebula shares the morphological class of Shell nebulae with many other LBVs while P Cygni is the only object in the class of Peculiar morphologies. So, in this respect, P Cygni is even more peculiar than Car. This fact suggests that different physical processes would have caused the giant eruptions of these two LBVs.
It is believed that some sort of pulsational instability is driving an extra mass loss that later appears as a giant eruption. Recently, Langer et al. (1994) have discovered a phase of violent radial pulsations when a very massive () shell-H burning star evolves away from the main-sequence and its effective temperature drops below 20 000 K. Their calculations show that a star with MZAMS = 60 may lose 5 yr-1 near K and will evolve again to hotter temperatures when about 6 has been lost. However, it is not clear whether such pulsations occur in stars with enhanced mass loss (either giant or moderate eruptions) and K (e.g. LBVs).
It is known that all normal LBVs, i.e. with the exception of P Cyg and Car whose photometric variations are of much smaller amplitude, show moderate photometric variability with 1–2 mag. Recently, Van Genderen et al. (1997) have introduced the concept of “S Dor phases” (SD), phases of brightening with an almost regular pattern of recurrence. They suggested a new nomenclature discerning between “normal S Dor phases” superimposed on a much slower gradient of brightening and fading for which they introduced the term “very-long term S Dor phase” (VLT-SD). The presence in LBVs of two distinct oscillation time-scales may have a strong impact upon studies of pulsation, stability and evolution of stars near the HD limit.
An important step towards our understanding of the evolution of massive stars was the discovery of a steady increase in P Cygni’s visual brightness between 1700 and 1988 (de Groot and Lamers 1992; Lamers and de Groot 1992). Evaluation of P Cygni’s brightness during the period 1700-2000 is a difficult task because the historical observations are based on a variety of early photometric detectors and different filters. Assuming a constant luminosity during the last three centuries, these authors have shown that the increase in brightness of 0.150.02 mag/century is caused by a steady decrease of the Bolometric Correction in agreement with calculations based on the theory of stellar evolution. This means that P Cygni has been moving to the red on the HR diagram changing its at a rate of 61 percent per century. Clearly, P Cygni is the first massive star whose long-term, steady photometric changes have been shown to be caused by evolutionary effects.
2.2 Microphotometric short-term variability
As for P Cygni’s photometric behaviour on shorter time-scales, reports in the older (i.e. pre-1930) literature are almost unanimous in saying that the star is essentially non-variable: Safarik (1888), e.g., reports P Cygni as “just about constant” on 17 nights between July 1884 and June 1886, and without recognizable variations thereafter until November 1888. Reports by other observers give essentially the same verdict (e.g., Flammarion 1882; Gore 1884; Markwick 1892; Campbell 1940). As a result, there has been no encouragement to observe the star regularly and, from what follows, it must be concluded that during the years before the mid 1930s we have most likely failed to observe certain episodes of more distinct brightness variations.
An early attempt at investigating P Cygni’s short-term variations seems to have been made by von Prittwitz (1900) who used a Zöllner photometer and, despite finding seemingly irregular variations with an amplitude of up to between 1898 and 1900, concluded that the star showed “no appreciable variations”. Later, however, after further observations between 1902 and 1907, she concluded that “P Cygni shows a tendency to very gradually become somewhat brighter” (von Prittwitz 1907). Von Pritwitz’s gradient over her 9-year observation period amounts to 2.1 magnitude per century, more than an order of magnitude larger than the above-quoted figure found by de Groot and Lamers over the much longer interval of almost three centuries.
Another notable exception to the generally indifferent attitude to P Cygni’s brightness is found in the work of the visual observers of the AAVSO. P Cygni was included in their observing programme as early as 1917 and has remained there ever since with a respectable number of photoelectric measurements added since 1985 (Percy et al. 1988). The visual estimates made by the AAVSO observers suffer from some drawbacks, though. They were collected by a large number of individual visual obervers mostly with insufficiently known personal equations, making it difficult to construct a homogeneous light curve that accurately reflects the rather small-amplitude variations of the star.
The early years of the AAVSO observations were also the early years of photoelectric photometry. However, in those early years there was no widely accepted standard photometric system. Photoelectric detectors had very individual characteristics and the choice of filters seems to have been determined largely by whatever piece of coloured glass an observer could lay his hands on. This, together with the absence of serious encouragement for the photometry of P Cygni, must have been largely responsible for the lack of photoelectric data that could in principle be tied in to a modern standard photometric system like, e.g., the Johnston UBV system.
The situation improved considerably when the Abastumani observers started systematic two-colour observations of P Cygni in the mid 1930s (Kharadze 1936; Nikonov 1936, 1937). Though not all observations obtained since these earlier ones have been published (Kharadze et al. 1952) and despite the fact that their pre-1951 observations were done with non-standard filters, these observers concluded that P Cygni must be a W Uma system with a period of 0.5 d (Magalashvili and Kharadze 1967a,b). They ascribed the absence of any earlier detection of this characteristic, and the belief that P Cygni’s light variations were wholly irregular, to the insufficient number of observations that had been made thus far. However, as pointed out by Fernie (1968), the WŨMa interpretation is untenable because it requires a primary star with a mass of 50 and a secondary with an orbital velocity of 10,000 km s-1. Alexander and Wallerstein (1967) and Luud (1969) have provided further photometric evidence and de Groot (1969) gave spectroscopic reasons why P Cygni cannot be considered a simple multiple object.
Although the Abastumani observers seem to have arrived at a wrong conclusion, one fact was established beyond reasonable doubt: P Cygni is a photometric variable. Here it is good to remember that Dreyer, on the basis of a discussion of William Herschel’s observations of 1792 and 1795, came to the conclusion that P Cygni does show some, probably irregular, variation in brightness (Dreyer 1918). Zinner, too, found that PC̃ygni “apparently shows very rapid, substantial brightness variations” (Zinner 1938). The Abastumani results did encourage later observers to dedicate some of their time to P Cygni (e.g., Groeneveld 1947) but there was never a long-term observing campaign until the 1980s when first Percy and his co-workers (Percy and Welch 1983; Percy et al. 1988) and then de Groot (de Groot 1990) began observing P Cygni on both a more regular basis and a longer time-scale. From these observations a number of characteristics of P Cygni’s light variations have become clear.
- a.
-
Over the last 15 to 20 years (and most likely over most of the time since its two 17th century outbursts) P Cygni’s variations have had a maximum amplitude of about in .
- b.
-
Most of the time the variations are slow, say magn month-1 in the V band.
- c.
-
On a time-scale of months to a year there are larger, more rapid variations, say magn month-1 in the band.
- d.
-
The overall light-curve shows a number of quasi-periodicities ranging from 17 to d (de Groot et al. 1999)
Section 3 Circumstellar matter
Nebulae around LBVs are of considerable interest since they provide clues to the mass-loss history of massive stars before they reach the LBV phase. P Cygni’s nebula is very faint at optical wavelengths and composed of a distribution of ”blobs” within a spherically symmetric nebula with a diameter of 22′′. Early detection of nebular emission lines [S ii] 6716, 6731 Å, [N ii] 6584 Å in a long slit spectrum offset 9 arcsec east from P Cygni was achieved by Johnson et al. (1992). They found a ratio N/S of about 335 by number from the [N ii] and [S ii] line fluxes. An anomalously strong nebular [Ni ii] 6667 Å line was detected by Johnson et al. (1992) and by Barlow et al. (1994). Lucy (1995) has explained the strength of the [Ni ii] 7378 and 7412 Å emission from the fact that the [Ni ii] emission in ejected globules is being fluorescently excited by the near-UV radiation of P Cygni. According to Barlow et al. (1994) bow-shocks around these globules, generated by the radiatively driven wind from the star, are responsible for the difference between the [N ii] 6584 Å and [Ni ii] 7378 and 7412 Å expansion velocities of 140 and 110 , respectively. Two faint outer arcs (Fig. 4) with angular diameters 1′ and 1.5′, respectively, have been discovered (Barlow et al. 1994). Meaburn et al. (1996) have measured a radial expansion velocity of 185 of the outer irregular shell located at 1.6 arcmin. The presence of two inner rings detected through the [Ni ii] filter and having radii of 11′′ and 6′′ has also been suggested (Barlow et al. 1994). If confirmed, a 6′′ ring could date back to the 1600 AD event. The shell located at 22′′ has probably been ejected 900 years ago. More recently, based on MOMI observations with the NOT (La Palma), O’Connor et al. (1998) found another filament at a distance 5′ from the star. This filament was investigated further by Meaburn et al. (1999). They concluded that this filament, which extends only to the east of P Cygni, seems the relic of a highly asymmetric ejection some 20,000 years ago. However, the exact nature of this filament and how it was formed remains unclear, leaving several questions unanswered, not the least of which is the fact that this early outburst seems to have happened much longer ago than one would expect P Cygni’s LBV phase to have lasted. Nevertheless, with shells from outbursts 900, 2100 and, maybe 20,000 years ago, a possible scenario for the episodic eruption history of P Cygni is now taking shape.
Some LBVs exhibit an IR excess due to dust emission. At 60 m one would expect at least 7-8 Jy from the P Cygni nebula, assuming the same ratio of dust to ionized gas as observed in other galactic LBVs. However, Waters and Wesselius (1986) obtained 2.05 Jy corresponding to an excess of only 0.5 Jy above the expected free-free emission from the stellar mantle at this wavelength. The observed infrared energy distribution of P Cygni does not show any signature of dust emission and must be due to the free-free and bound-free continuum of the wind. This fact can be used to construct the velocity law and derive a mass-loss rate. Using the ground-based IR fluxes (0.98–20m) by Abbott et al. (1984) and the IRAS fluxes (10–100m), Waters and Wesselius (1986) have concluded that the best fit to the observed infrared energy distribution could be obtained for a linear velocity law. This result has been disputed by Pauldrach and Puls (1990) and by Najarro et al. (1997) who showed that a typical -velocity law [] can reproduce the observations and also account for the wind acceleration.
Recently, Lamers et al. (1996) have reported the ISO observations of P Cygni covering the range 2.38–45.2 m. They found a good agreement comparing the observed profiles of H and He lines and the free-free emission with the predictions from non-LTE atmospheric models of Hillier (1987, 1990). Numerous forbidden lines of singly and doubly-ionized Fe, Ni, Ne and Si have been identified.
The first radio observations of P Cygni, made by Wendker et al. (1973), have clearly revealed the source. The radio emission has been resolved by the VLA (White and Becker 1982) and these observations also confirmed its thermal free-free nature. Wendker (1982) and Baars and Wendker (1987) have detected an arc of faint, thermal radio emission 30′′ to the north-west of P Cygni. This arc has not yet been identified at optical wavelengths. It is well known that for a purely thermal free-free and bound-free emission model of the wind, the observed flux should follow a power law (e.g. Wright and Barlow 1975). Compilation of the observations by Altenhoff et al. (1994, 1.3mm) White and Becker (1982, 6cm) and Becker and White (1985, 2cm) done by Wendker (1987) have been used by Pauldrach and Puls (1990) and Najarro et al. (1997) to model the wind emission. These authors have shown that the measured radio flux is predominantely of thermal nature and can be used to measure the mass-loss rate. The radio flux varies on short time-scales of the order of months (Abbott et al. 1981; van den Oord et al. 1985). The finding of Wright and Barlow (1975) that P Cygni’s optically thick radio photosphere has a diameter 0.1′′ at 6 cm has recently been confirmed by Skinner et al. (1997) who were able to resolve the radio core of the stellar wind at 0.07′′ and show that it is very clumpy.
Polarimetry is another powerful tool to investigate the circumstellar evironment of early-type stars. Hayes (1985) was first to obtain broadband polarization measurements of P Cyg in 1978 and 1979 and to discover an intrinsic polarization of the star. His results suggest temporal variations of the amplitude of the polarization and the scattering angle. Later, Taylor et al. (1991) reported the first optical linear spectropolarimetric measurements from 3200 Å to 7800 Å. They confirmed Hayes’ (1985) earlier results and found large night-to-night variations in continuum polarization indicating that the scattering sources lie close to the star. Both, Hayes (1985) and Taylor et al. (1991a) have concluded that the circumstellar wind of P Cyg is inhomogeneous and that the shape of the polarization versus wavelength curve varies with time. First UV (1400-3200 Å) spectropolarimetry of P Cygni (Taylor et al. 1991b) was obtained with the Wisconsin Ultraviolet Photo-Polarimeter Experiment (WUPPE) on board of the ASTRO-1 space observatory. These observations show that the intrinsic polarization of the star remains constant in the Balmer continuum except for a broad dip between 2600 and 3000 Å. This result was not predicted by theoretical models (e.g. Cassinelli et al. 1987) and explained by Taylor et al. (1991b) in terms of Fe line blanketing between 2600-3000 Å. The intrinstic polarization angle was also found to be constant in the UV except for a rotation accross the feature between 2600-3000 Å. Models to explain polarization data obtained by WUPPE have been developed by Bjorkman and Cassinelli (1993).
Section 4 Optical spectroscopy
The spectrum of P Cygni shows undisplaced emission lines flanked by absorption lines displaced to shorter wavelengths. This characteristic has been the reason for the term ‘P Cygni profile’ whenever a similar composite profile appears in the spectrum of some cosmic source. The P Cygni characteristic is shown most completely in P Cygni itself: almost all the lines in its optical spectrum show a P Cygni profile. The spectrum is dominated by H, He i, N ii, N iii, Si iii, Si ii and Fe iii P Cygni profiles. Pure emission lines due to [N ii], N ii, Fe ii, Fe iii, Mg ii etc. have been identified as well. The earliest mention of this double structure goes back to 1897 (Maury 1897) when it was first interpreted as an overlapping of two different spectra. Between 1888 and 1911 several observers studied the spectrum of P Cygni. Merrill (1913a) did not include P Cygni in a list of stars with variable spectra nor in a list of stars with spectra suspected of variability. This parallels the early conclusions about P Cygni’s photometric behaviour. While different early observers had all come to this conclusion, we should not forget that spectrogrammes of those days did not have a quality comparable to what could be obtained in later years. Therefore, the early conclusion about the non-variability of P Cygni’s optical spectrum is not really a proof that nothing has changed; but the variations must have been small.
In 1913, Merrill (1913b) was the first to report spectral variations after a study of spectrogrammes obtained at Lick in 1912 and 1913. Frost (1912), on the contrary, concluded that there were no variations on the basis of a study of a number of spectrogrammes obtained between 1904 and 1912. Lockyer (1924) was of the same opinion. Elvey (1928 and references therein), on the other hand, showed that some variations in the spectrum seemed to have been observed. However, he attributed these to instrumental errors.
More recently, the question about spectral variations of P Cygni has been answered positively and settled conclusively (e.g., Kupo 1955; Dolidze 1958; Luud 1967a,b; de Groot 1969; Stahl et al. 1994, and references in these). Other papers from this period address P Cygni’s absolute magnitude (Beals 1950: = 6.3; Arkhipova 1964: 7.7; Lamers et al. 1983: 8.3).
The interpretation of P Cygni’s spectrum started in the 1930s with the works of McCrea (1929) and Beals (1930a,b, 1932, 1934, 1935), who explained the typical P Cygni profile as due to a radially-expanding atmosphere around the star, and Struve (1935), who presented the basic physical interpretation of the atmosphere. The recognition that P Cygni’s stellar wind is accelerated came when it was found that there is a clear relationship between the excitation potential of a certain transition and the radial velocities of its absorption lines (Beals 1935; Struve 1935; Kharadze 1936).
After some intermittent progress in the years following (Adams and Merrill 1957), progress accelerated beginning in the 1960s when a number of studies of the star’s spectral variations were published (Luud 1966, 1967a,b, 1969; Markova 1993a). The first and most complete line identification in the range 3100 8750 Å was made by de Groot (1969). More recently, Markova and Zamanov (1995) and Markova (1994) published spectral atlases with line identifications in the ranges 4840 to 6760 Å and 3550 to 4800 Å, respectively. However, all these observations were made on photographic plates. Results of the long-term (1990-1992) spectroscopic monitoring of P Cygni with a spectral resolution of 12,000 and S/N 100 in the wavelength range 4050–9050 Å have been presented by Stahl et al. (1993, 1994). By averaging more than 100 CCD spectra they achieved a S/N-ratio up to 2000. Such high-quality spectra have allowed a detection of a large number of [Fe ii] lines (Stahl et al. 1991; Israelian and de Groot 1992) formed in the outer parts of the stellar wind. Most of these emission lines have a complex structure due to blends (Israelian 1995). Surprisingly, such a high S/N-ratio of the combined spectrum has revealed very weak absorption lines of high-excitation O ii on the top of the flat-topped [Fe ii] lines. These absorption lines of oxygen form deep in the atmosphere and can be used to measure the abundance of oxygen. Despite many attempts to identify all spectral lines in the spectrum of P Cygni, many lines still remain unidentified (Johnson et al. 1978; Israelian and Nikoghossian, 1993; Stahl et al. 1993). The amplitudes of the spectral variations detected by Stahl et al. (1994) are not exceeding 30% for the emission-line fluxes and 30 km sec-1 for the radial velocities. Nevertheless, some larger spectral variations must have occurred during the last decades. For example, comparing different identification line lists, Markova and de Groot (1997) have concluded that more than 70 of the pure emission lines in P Cygni’s spectrum have appeared only recently. Changes in the degree of ionization in the wind can also be the cause of the variations of extended wings of H (Israelian and de Groot 1991; Scuderi et al. 1994). It is becoming clear that the spectral variations of P Cygni are not limited to DACs and line-profile variations.
Section 5 Ultraviolet observations
One of the puzzling features of the UV spectrum is the lack of P Cygni profiles, whereas the visual spectrum is full of them. However, some resonance and low-excitation lines of Mg ii, Fe ii, C ii etc. do have P Cygni-type profiles. Ambartsumian et al. (1979) have argued that the lack of emission is probably not a result of very high density (required to collisionally de-excite the upper levels of the UV transitions) in the wind as proposed by Hutchings (1979). The maximum velocities corresponding to the blue end of the absorption component have velocities up to 300 (Cassatella et al. 1979; Underhill 1979; Ambartsumian et al. 1979; Hutchings 1976). The resonance lines of C iv at 1548 and 1550 Å and those of Si iv at 1398 and 1402 Å show weak P Cyg profiles superimposed on the wide photospheric profiles with extended wings due to blends (Israelian 1995). All stellar absorption lines in the spectrum are shifted to the blue. Singly-ionized metals have narrow (FWHM 60 ) profiles shifted to 220 , whereas the doubly-ionized metals have broad (FWHM 110 ) profiles displaced by about 80 . The fact that doubly-ionized metals have larger width and smaller blue shift indicates that they are formed in the inner part of the wind. This follows from the clear relationship between expansion velocity and excitation potential indicating that the excitation temperature decreases outward (Beals 1950; de Groot 1969; Cassatella et al. 1979; Underhill 1982). Many Fe ii lines have asymmetric absorption lines, deepest at with a sharp cut-off towards the violet and a gradual decrease towards the red at . An excitation temperature in the envelope of 12000900 K has been derived from curve-of-growth analysis (Cassatella et al. 1979). There is no evidence of highly-ionized species such as N v in the wind, unlike many other B1 supergiants (de Jager 1980; Underhill 1982; Ambartsumian et al. 1979; Cassatella et al. 1979). The electron temperature in the wind is lower (Te = 12000 K) than the effective temperature of the star (Teff = 19.000 K) suggesting a possibility that the wind is in radiative equilibrium with the photosphere (Ambartsumian et al. 1979). Thus, the degree of ionization in P Cygni’s wind is lower than in the photosphere. In fact, the spectral type of P Cygni derived from the visual spectrum is generally reported as B1Ie (Lesh 1968; de Groot 1969; Lamers et al. 1983; Underhill 1982). However, there are some spectral indicators in the visual (Struve 1935) and ultraviolet (Underhill 1982) range suggesting that later types may be appropriate. Ultraviolet spectra have allowed the conclusion that the nature of P Cygni’s mass loss is different from that of other supergiants of the same spectral type. The mass ejection may have a dynamical origin whereas radiation pressure acts on the ejected material when its velocity is large enough to shift the wavelengths of the strong lines away from those of their photospheric counterparts. According to Abbott (1977), relatively low ionization in the wind increases the number of strong lines driving a wind, once overlapping with the photospheric lines is overcome. P Cygni has a 7–8 times lower terminal velocity and a 3–10 times higher mass-loss rate than other B1 supergiants (de Jager 1980; Underhill 1982). This apparently is the cause of the lower degree of ionization in the wind.
Section 6 Discrete Absorption Components (DACs)
6.1 Optical DACs
Perhaps the most remarkable feature in the spectrum of P Cygni is the existence of discrete absorption components (DACs) of H, He, C, N, Fe and many other elements. DACs have a FWHM about 10–15 and, therefore, only high-resolution observations can reveal them. The first extensive analysis of multiple absorption components was made by de Groot (1969) who observed three variable componenets in the hydrogen lines at , and and two in the helium lines. He found that the first component at was showing periodic radial-velocity variations with P=114 days and semi-amplitude 30 . No periodic variations were found in other components. Luud et al. (1975) have argued that the second component at was also variable, but with P=57 days. They failed to detect any periodicity in the first component at . According to de Groot (1969) and Luud et al. (1975) the velocity of a given component increases and decreases with time. A different scenario was proposed by Kolka (1983), Markova and Kolka (1984) and Markova (1986b). These authors proposed that the variations of DACs are due to the ejected shells with velocities increasing in time up to a constant value. This idea was supported by Lamers et al. (1985) and Israelian et al. (1996) on the basis of high-resolution IUE spectra. Markova (1986a) has reanalysed the velocities of DACs of the Balmer lines published by de Groot (1969) and Luud et al. (1975) and has shown that the data seem more consistent with the recurrent shell-ejection scenario of Kolka (1983) over the period 1981 to 1983. She derived an ejection time of 200 days from the study of DACs observed in Balmer lines. This period was confirmed by Kolka (1998). Van Gent and Lamers (1986) have reanalysed published radial-velocity measurements of the shell components of P Cygni and found that the variations are not due to periodic oscillations but to shell ejections with a mean time-scale of 60–75 days. From the study of 13 helium lines over three years, Markova (1993b) has concluded that DACs appear every four or five months. Slow profile variations of helium lines have been detected as well. In Table 1 we list all available observations of DACs observed in hundreds of optical and at least 80 high-resolution IUE spectra. In another study, Markova and Kolka (1985) and Markova (1993a) concluded that virtually all absorption lines of H, He i, N ii, O ii, Si iii and Si iv show complicated profile variations which can be explained in terms of fast-moving DACs superimposed on a slowly-varying underlying profile. These slow profile changes are most probably related to the variations detected by Stahl et al. (1994) and can be caused by non-radial pulsations.
6.2 DACs in the Ultraviolet
There have been a number of detections (Cassatella et al. 1979; Luud and Sapar 1980) of DACs in the UV lines of Cr ii, Ni ii, Ni iii, Si iii, Mn ii etc. (Table 1). However, detailed studies have been performed only of those detected in Fe. Variable DACs in Fe ii and Fe iii have been studied in 33 high-resolution IUE spectra by Lamers et al. (1985). They found that Fe ii lines have two absorption components, a stable and a variable one, and explained this phenomenon in terms of variable thick shells ejected from the star with a frequency of about once per year. The stable component at did not vary over 5 years. The second DAC varied from 112 to in 1978/79. They did not find a stable absorpion component in Fe iii lines and concluded that the latter form in variable shells. With hindsight, it is now clear that this failure was due to their use of blended iron lines in their analysis. When one uses all available iron lines, two components are clearly seen in the Fe iii lines (see Fig. 5). More recently, Israelian et al. (1996) have analysed 49 high-resolution IUE spectra obtained in the period 1985–1991 and found a repetition time between two successive shells of 20011 days. This value agrees perfectly with those obtained from Balmer lines by Markova (1986a) and by Kolka (1998). It has also been shown that Lamers et al. (1985) used blended iron lines in their analysis and failed to find Fe iii and Fe ii lines with two and three absorption components, respectively. A clear example of the Fe iii line with two components is presented in Fig. 5. It has been shown (Israelian et al. 1996) that the acceleration of DACs in the earliest phases when they appear at can be as large as 0.60.3, while it is about 0.10.05 at the end. Four shells have been clearly identified on the basis of the gradual variations of DACs in Fe ii lines (Fig. 6).
6.3 On the origin of DACs
P Cygni is the only star in which DACs have been followed for more than 30 years. In spite of all observational studies of DACs, the mechanism of their formation is still unknown. DACs can be produced by spherically symmetric shells, or asymmetric blobs, puffs, etc. In this paper we will use the term shell, keeping in mind that these can be blobs, etc. Shells are denser and have smaller accelerations than the mean wind material.
At least three mechanisms have appeared in the literature aimed at explaining the shell-ejection phenomenon in P Cygni. Lamers et al. (1985) used the ISW model of Kwok et al. (1978) assuming that shells gain their momentum from the fast wind accelerated between the shell and the star. This mechanism neglects radiation pressure acting on the shells and suggests that shells will increase their mass in time (because of the interaction with the fast-moving wind material) and will eventually reach a constant velocity. Another, simplified model was proposed by Kahn (1989) who estimated that Lyman alpha radiation is able to account for the acceleration of shells observed in the optical region. Kahn (1989) and Lamers et al. (1985) did not make any suggestions on the shell–formation mechanism. Finally, Pauldrach and Puls (1990) suggested a so called bi-stability mechanism in which shells represent a high mass–loss and small state of the wind which is optically thick in the Lyman continuum. According to their models, the high mass–loss state of the wind is caused by the radiation pressure on singly-ionized metals. The interaction between fast and slow material was neglected in the bi-stable models of Pauldrach and Puls (1990). They have demonstrated that P Cygni’s wind is very unstable with respect to small changes in the luminosity () or radius (). This finding has led them to propose a cyclic mechanism for the shell-ejection phenomenon. According to this mechanism, the photospheric temperature of the star is controlled by a moving shell due to the wind-blanketing effect. The photospheric temperature increases during a high mass–loss phase (e.g. by backscattering from a shell) until the hydrogen becomes ionized. This leads to a decrease of the line force since the Lyman continuum is optically thin and there are not many lines from singly-ionized metals to drive the wind. Thus, the mass-loss rate switches back towards its lower value and the wind blanketing decreases together with the photospheric temperature. Now again, since the photospheric temperature is low, the hydrogen will recombine and the wind blanketing will start to increase leading to the formation of a new shell. This bi-stability mechanism suggested by Pauldrach and Puls (1990) is able to explain some of the observed characteristics of the shell–ejection phenomenon. In particular, according to the bi-stability model, the shell ejection must be accompanied by photometric changes of the star due to the variations of the surface temperature. Such a correlation has been suggested by Israelian et al. (1996).
Our knowledge of the geometry of the shells is very poor. Direct imaging by Barlow et al. (1994) has resolved dense blobs (knots) with masses of 10-5 and radii of 7.42105 at 7′′ from the star, moving with a velocity 100–140 . It is not yet clear whether these blobs can be identified with the DACs observed in UV and optical lines. It is interesting to mention in this respect, that Vakili et al. (1997) using the Grand Interféromètre à 2 Télescopes (GI2T) found a bright localized blob of moving gas at 4 photospheric radii to the south of P Cygni.
Similar DACs have been widely observed in the UV spectra of many other hot, massive stars (Howarth and Prinja 1989). However, in contrast with other OB-type supergiants, DACs in P Cygni’s spectrum do not appear in the resonance lines of Si iv and C iv but in the subordinate lines of metals. Also, DACs in P Cygni can be followed for weeks or months while those detected in normal OB supergiants have time-scales of the order of hours to days. Finally, it seems that in all instances the DACs observed in P Cygni were much broader than those observed in other early-type supergiants.
The intrinsic instability of the winds provide the basis for numerical simulations of this behaviour (Owocki 1998). The involvement of non-radial pulsations (NRPs) in this phenomenon may contribute an injection of seeds of instability into the wind. Several continuous IUE monitoring campaigns of a limited number of objects concluded that the variability of the wind is probably coupled to the rotational time-scales. In these cases a cyclically repeating pattern in the development of DACs was observed. However, their phase coherence within the few cycles was relatively uncertain. The rotation periods normally exceed the repetition time-scales of DACs by a small factor and the uncertainties in both quantities do not allow one to conclude whether their ratio is a whole number or not. A whole number could have been due to co-rotating surface magnetic structures while a non-integer ratio would indicate the presence of NRPs. The problem is still open and more multiwavelength observing compaigns are required to resolve it. Returning to P Cygni, we note that there is an excellent database for a theoretical study of DACs in P Cygni as long as one can reduce all observations of DACs (Table 1) to the same scale.
Section 7 Structure of the atmosphere and the wind
The goal of any modelling of an expanding atmosphere is to investigate how line profiles and the emergent energy distribution behave as a function of mass loss, luminosity and a velocity law. Many analyses, of varying degrees of approximation, have been carried out on the spectrum of P Cygni. Kuan and Kuhi (1975) attempted to fit broad H profiles adopting the velocity law from the study of Castor et al. (1975) and concluded that P Cygni’s wind has a deceleration zone. This result was difficult to reconcile with the observed velocity-excitation correlations (Beals 1950) and with the infrared index (Wright and Barlow 1975; Barlow and Cohen 1977). Later, Van Blerkom (1978) and Kunacz and Van Blerkom (1979) have succeeded in fitting computed Balmer-line profiles to those observed by means of an accelerating flow. Nugis et al. (1979) have proposed a three-zone model for P Cygni’s wind. According to their model, the material in the first zone is accelerated to about 300 by some pulsation instability, then decelerated to 200 in the second zone due to gravity and then again accelerated to 1000 by radiation pressure. More recent papers on this topic are those of Drew (1985), Lamers (1986), Pauldrach and Puls (1990), Israelian et al. (1993), Scuderi et al. (1994) and Najarro et al. (1997). Some of these studies have given conflicting results and the situation will not become clearer until more accurate data and more sophisticated radiative-transfer codes have become available.
The successes and shortcomings in this area have been outlined in the PhD thesis of F. Najarro (1995) who utilized the code of Hillier (1987, 1990) based on an iterative technique. This code solves the transfer equation in the co-moving frame subject to statistical and radiative equilibrium in an expanding, homogeneous and spherically-symmetric atmosphere. It is believed that the main success towards modelling of P Cygni’s emission-line spectrum is based on the validity of the approximation of spherical geometry. Polarization observations by Taylor et al. (1991) and Hayes (1985) suggest that there is no preferred axis of symmetry. However, there are some difficulties typical for a star located at the position of P Cygni on the HR diagram. As we have mentioned above, Pauldrach and Puls (1990) found that small changes in the stellar parameters (e.g., a change of only 0.05 dex in \genaccent95M or L∗) can lead to dramatic changes in the ionization structure of the wind. Najarro et al. (1997) have concluded that in models in which hydrogen is recombined the Lyman lines remain optically thick and, thus, can account for the absorption dips on the Balmer lines. They found that models where hydrogen is ionized throughout the wind fail to fit the observed profiles of the H and He lines. However, we want to point out that hydrogen is not completely ionized in the radio-emitting region and that this must be taken into account when estimating the mass-loss rate (Wright and Barlow 1975). In order to fit H and He lines simultaneously it was necessary to use a slow velocity law (=2.5) and a photospheric velocity of 30. It appears that P Cygni’s absorption-line profiles are very sensitive to small changes in the mass-loss rate. The latter alters the ionization structure and affects sub-millimeter and radio fluxes. It is quite possible that the variations in radio flux observed by van den Oord et al. (1985) were due to such changes in ionization structure.
Detailed modelling of P Cygni’s emission-line spectrum and of the emergent continuum energy distribution for the wavelength range 2500 Å 60m led Najarro et al. (1997) to the following values of the parameters describing the state of the atmosphere/wind and the position of the star on the H-R diagram:
-
=75
-
-
=18 200 K
-
nHe/nH=0.3
-
\genaccent
95M=3.0yr-1
-
=185
Lamers et al. (1983) derived =76 from a study of the energy distribution of P Cygni (using ATLAS6 models) together with a distance of 1.8 kpc estimated from cluster membership. Such a distance is in agreement with the Hipparcos parallax of 0.520.50 mas.
An important result from different spectroscopic analyses of P Cygni is the enhanced helium abundance. The values of nHe/nH proposed in the literature agree reasonable well; based on the H and He i near-infrared lines Najarro et al (1997) and Deacon and Barlow (1991) suggest 0.40.15 and 0.50.1, respectively.
Section 8 Evolutionary status
The high nHe/nH abundance ratio confirms that P Cygni has evolved away from the ZAMS. There are indications (Johnson et al. 1992) that P Cygni’s nebula is composed of material in which most of the original carbon has been converted into nitrogen by the CN cycle. Since it is known that the CN cycle achieves equilibrium before the CNO cycle converts all oxygen into nitrogen, the fact that we observe pseudo-photospheric absorption lines of oxygen indicating a solar abundance of this element (Israelian 1995) suggests that the upper atmosphere has not yet been contaminated by the products of the CNO cycle.
P Cygni is in a relatively quiescent phase of its post-main-sequence LBV life, exhibiting small-scale spectrophotometric variations but not undergoing the moderate photometric outbursts observed in S Dor, AG Car and other LBVs. The 1600 AD outburst confirms that P Cygni must have crossed the Humphreys-Davidson instability limit at least once. However, we do not know whether it will suffer further outbursts in the future or how soon, if ever, it will evolve towards a Wolf-Rayet-like phase. Using the pulsational analysis of Kiriakidis et al. (1993), Langer et al. (1994) proposed the following evolutionary sequence for very massive stars: O star Of H-rich WN star LBV H-poor WN star H-free WN star WC SN. They have identified P Cygni with the hydrogen shell-burning phase and derived a current mass of 235. This value of the mass, although in conflict with the 50 suggested by El Eid and Hartmann (1993), does fit stellar parameters of the star obtained from a detailed spectroscopic analysis by Najarro et al. (1997).
The mechanism responsible for the giant and moderate variations of LBVs has been intuitively linked to a pulsation instability. The understading of this mechanism is of great importance and will help to understand the intermediate phases in the evolutionary chain O-star LBV WR-star. Maeder (1989) proposed density inversions that would cause strong instabilities in the atmospheres of LBVs. Inverted density gradients may lead to pulsation solutions (so called strange modes) that can grow rapidly in amplitude. These pulsations lie in regions where the supra-Eddington luminosity causes an opacity peak. The rapid growth of the density inversion results in an outburst. The star moves again to the blue (away from the HD limit) when the luminosity decreases to below the Eddington limit in the now exposed deeper layers and the opacity becomes so low that it can no longer drive the catastrophic mass loss. A high helium abundance tends to stabilize the outburst by decreasing the pulsation amplitude. Stothers and Chin (1993, 1995) have investigated a dynamical instability of massive stars in the linear adiabatic approximation and found a relation between its occurrence and values below 4/3 of the mean adiabatic exponent averaged over a conveniently chosen part of the stellar envelope. Their results have not been confirmed by Glatzel and Kirakidis (1998) who also questioned the validity of the adiabatic approximation for a stability analysis of massive stars. However, recently Stothers (1999a) has performed a numerical stability analysis based on linear and nonlinear hydrodynamical models of nonadiabatic, spherically symmetric stellar envelopes, and confirmed results of Stothers and Chin (1993, 1995) that the purely adiabatic criterion does in fact determine dynamical stability. It has been also shown (Stothers 1999b) that rotation is not affecting directly the possible course of stellar evolution. For LBVs, evolving in a late stage of helium-core burning, the luminosity-to-mass ratio would probably be increased by rotation.
The dependence of nonadiabatic instabilities on stellar parameters is linked with the properties of the corresponding opacity maxima (Fe, He or He/H opacity bumps) and their positions within the star. Numerical simulations (Cox et al. 1997; Guzik et al. 1997) of the evolution of strange modes show that the outburst occurs when relatively deep atmospheric layers exceed the Eddington luminosity causing a sudden increase of the photospheric radial velocity (up to 200 ). The rapid opacity rise during a pulsation cycle will lead to supra-Eddington luminosities.
The question is whether in a real star the convection will turn rapidly enough to transport the radiation. To be more realistic, these numerical simulations should consider at least 1) time-dependent convection, 2) a large number of grid points, and 3) to follow the material as it leaves the stellar surface. The last point is added in order to bring the theory closer to the observations. It is also not clear whether these models are predicting (or aiming to predict) moderate or giant eruptions. In general, the results of such simulations must be interpreted with caution.
Section 9 Some conclusions
Even after a study of 400 years, at times particularly intensive during this century, P Cygni continues to baffle us. Surely enough, progress has been made, many observations using different techniques and covering almost all wavelength regions have been made, various aspects of the star’s behaviour have come to be known, and some of the latter have begun to be understood. Despite all this, the number of unanswered questions will be capable of occupying the investigative efforts of a whole generation of researchers. Without pretending to be complete, here we offer a list, in no particular order, of the more important questions deserving our attention in our 21st and P Cygni’s 5th century.
-
P Cygni has shown us that to disentangle the combined effects of a variety of physical processes, the value of long series of observations cannot be overestimated. This approach needs to be continued and also applied more frequently to other objects.
-
The mechanism causing giant outbursts in LBVs is not yet understood. One senses that the mass of the star is the most important parameter, but how differences in mass are manifested in different outbursts and in the overall history of the star, is still a matter of contention that requires both more observations and more calculations. In this respect, the apparent low frequency of giant outbursts seems to indicate that we will need some patience before getting to the bottom of this question.
-
While the short-term variations, both in brightness and in spectral-line profiles, are there to be observed all the time, their mechanism is still surrounded by a nebulosity of unanswered questions. The influences of rotation, pulsations, and magnetic fields, just to name a few, are not yet sufficiently understood.
-
We chose the title “P Cygni: An Extraordinary LBV” for this review. Is the adjective ‘extraordinary’ due to the fact that P Cygni, despite being the first of something, is not a good example of a LBV? Whatever the answer to this question, does P Cygni teach us valuable lessons about LBVs in general, or are all such stars peculiar in one way or other and need an individual approach? Do small differences in physical parameters produce vastly different phenomena in the upper regions of the HR diagram?
It is the authors’s hope that this review may be of some help to keep the interest in P Cygni alive so that further progress towards a more complete understanding of this ‘extraordinary LBV’ can be made.
Acknowledgements
The authors are grateful to Dr. N. Markova for stimulating discussions and to the referees R. M. Humphreys, O. Stahl, and another unknown one for their constructive remarks. This work made use of the STARLINK network. MdG thanks DENI and PPARC for support.
References
- 1
- 2 []Abbott, D.C.: 1977, Ph.D. thesis, Univ. of Colorado.
- 3
- 4 []Abbott, D.C., Bieging, J.H. and Churchwell, E.: 1981, Astrophys. J. 250, 645
- 5
- 6 []Abbott, D.C., Telesco, C.M. and Wolff, S.C.: 1984, Astrophys. J. 279, 225
- 7
- 8 []Adams, W.S. and Merrill, P.W.: 1957, Astrophys. J. 125, 102
- 9
- 10 []Alexander, T. and Wallerstein, G.: 1967, Publ. Astron. Soc. Pac.. 79, 500
- 11
- 12 []Altenhoff, W.J.,Thum, C. and Wendker, H.J.: 1994, Astron. Astrophys. 281, 161
- 1979 Ambartsumian, V.A., Mirzoyan, L.V. and Snow, T.P.: 1979, Astrophys. J. 227, 519
- 13 []Arkhipova, V.P.: 1964, Sov. Astr. 7, 51
- 14 []Astafiev, E.R.: 1968, Astrofizica 4, 461
- 15 []Baars, J.W.M. and Wendker, H.J.: 1987, Astron. Astrophys. 181, 210
- 1977 Barlow, M.J. and Cohen, M.: 1977, Astrophys. J. 213, 737
- 1994 Barlow, M.J., Drew, J.E., Meaburn, J. and Massey, R.M.: 1994, Monthly Notices Roy. Astron. Soc. 268, L29
- 16 []Beals, C.S.: 1930a, Monthly Notices Roy. Astron. Soc. 90, 202
- 17 []Beals, C.S.: 1930b, Pub. Dom. Ap. Obs. 4, 271
- 18 []Beals, C.S.: 1932, Monthly Notices Roy. Astron. Soc. 92, 677
- 19 []Beals, C.S.: 1934, Pub. Dom. Ap. Obs. 6, 125 and 144
- 20 []Beals, C.S.: 1935, Monthly Notices Roy. Astron. Soc. 95, 580
- 21 []Beals, C.S.: 1950, Publ. Dom. Ap. Obs. 9, 1
- 22 []Becker, R. and White, R.L.: 1985, in Hjellming, R.M. and Gibson, D.M. (eds), Astrophys. and Space Sci. Library, Vol. 116, Radio Stars, Reidel, Dordrecht, p. 139
- 23 []Bjorkman, J.E. and Cassinelli, J.P.: 1993, Astrophys. J. 409, 429
- 24 []van Blerkom, D.: 1978, Astrophys. J. 221, 186
- 25 []Campbell, L.: 1940, Harvard Coll. Obs. No. 435
- 1979 Cassatella, A., Beeckmans, F., Benvenuti, P., Clavel, J., Heck, A., Lamers, H.J.G.L.M., Macchetto, F., Penston, M., Selvelli, P.L. and Stickland, D.: 1979, Astron. Astrophys. 79, 223
- 26 []Cassinelli, J.P., Nordsieck, K.H. and Murison, M.A.: 1987, Astrophys. J. 317, 290
- 27 []Castor, J.I., Abbott, D.C. and Klein, R.I.: 1975, Astrophys. J., 195, 175
- 28 []Cox, A.N., Guzik, J.A. and Soukup, S.: 1997, in Nota, A. and Lamers, H.J.G.L.M. (eds), ASP Conf. Series, vol. 120,, LBVs-Massive Stars in Transition, page 133
- 29 []Davidson, K.: 1987, Astrophys. J. 317, 760
- 30 []Davidson, K. and Humphreys, R.M.: 1997, Ann. Rev. Astron. Astrophys. 35, 1
- 1991 Deacon, J.R. and Barlow, M.J.: 1991, in van der Hucht, K.A., Hidayat, B. (eds), IAU-Symp.143, Wolf-Rayet Stars and interrelations with other massive stars in galaxies, Kluwer, p.558
- 31 []Dolidze, M.V.: 1958, Bull. Abastumani Ap. Obs. 23, 69
- 32 []Drew, J. E.: 1985, Monthly Notices Roy. Astron. Soc. 217, 867
- 33 []Dreyer, J.L.E.: 1918, Monthly Notices Roy. Astron. Soc. 78, 554
- 1993 El Eid, M.F. and Hartmann, D.: 1993, Astrophys. J. 404, 271
- 34 []Elvey, C.T.: 1928, Astrophys. J. 68, 416
- 35 []Fernie, J.D.: 1968, Observatory 88, 167
- 36 []Flammarion, C.: 1882, Les Etoiles et les Curiosités du Ciel, p. 193
- 37 []Frost, E.B.: 1912, Astrophys. J. 35, 286
- 38 []van Genderen, A.M., de Groot, M.J.H. and Thé, P.S.: 1994, Astron. Astrophys. 283, 89
- 39 []van Genderen, A.M., Sterken, C. and de Groot, M.: 1997, Astron. Astrophys. 318, 81
- 40 []van Gent, R.H. and Lamers, H.J.G.L.M.: 1986, Astron. Astrophys. 158, 335
- 41 []Glatzel, W. and Kiriakidis, M.: 1998, Monthly Notices Roy. Astron. Soc. 295, 251
- 42 []Gore, J.E.: 1884, Proc. Royal Irish Acad. Ser.2, 4, 149
- 43 []Groeneveld, I.: 1947, Heidelberg Veröff. 14(5)
- 44 []de Groot, M.: 1969, Bull. Astr. Inst. Netherlands 20, 225
- 45 []de Groot, M.: 1988,Irish. Astr. Jour. 18, 163
- 46 []de Groot, M.: 1990, in Garmany, C. (ed.), Properties of Hot Luminous Stars; Boulder-Munich Workshop, ASP Conf. Series, p. 165
- 47 [] de Groot, M. and Lamers and H.J.G.L.M.: 1992, Nature 355, 422
- 48 []de Groot, M., Sterken, C. and van Genderen, A.M.: 1999. Private Communication
- 49 []Guzik, J.A., Cox, A.N. and Despain, K.M.: 1997, in Nota, A. and Lamers, H.J.G.L.M. (eds), ASP Conf. Series, vol. 120,, LBVs-Massive Stars in Transition, page 138
- 1985 Hayes, D.P.: 1985, Astrophys. J. 289, 726
- 50 []Herbig, G.H.: 1962, Astrophys. J. 135, 965
- 51 []Herman, R.: 1964, Ann. d’Astrophys. 27, 507
- 52 []Hillier, D.J.: 1987, Astrophys. J. Suppl. 63, 947
- 53 []Hillier, D.J.: 1990, Astron. Astrophys. 231, 116
- 1989 Howarth, I.D. and Prinja, R.K.: 1989, Astrophys. J. Suppl. 69, 527
- 54 []Humphreys, R.M. and Davidson, K.: 1994, Publ. Astron. Soc. Pac. 106, 1025
- 1969 Hutchings, J.B.: 1969, Monthly Notices Roy. Astron. Soc. 144, 235
- 1976 Hutchings, J.B.: 1976, Astrophys. J. 204, L99
- 1979 Hutchings, J.B.: 1979, Astrophys.J. 233, 913
- 1995 Israelian, G.: 1995, Astron. Astrophys. 300, 894
- 1991 Israelian, G. and de Groot, M.: 1991, Astrofizica 34, 467
- 1992 Israelian, G. and de Groot, M.: 1992, in Drissen, L., Leitherer, C. and Nota, A (eds), ASP Conf. Series, vol. 22, Nonistropic and Variable Outflows from Stars, page 356
- 1993 Israelian, G. and Nikogossian, A.: 1993, Astrofizica 36, 189
- 1993 Israelian, G., Nikogossian, A. and Tambovtseva, L.: 1993, Astron. Rep. 37, 493
- 1996 Israelian, G., de Groot, M., Parker, J. Wm. and Sterken, C.: 1996, Monthly Notices Roy. Astron. Soc. 283, 119
- 55 []Ivanova, N.L., Babaev, M.V., Gusagzade, A.O. and Zvereva, E.B.: 1982, Publ. Krim. Astrophys. Obs. 40, 46
- 56 [] de Jager, C.: 1980, The Brightest Stars, Dordrecht, Reidel.
- 1978 Johnson, H.L., Wisniewski, W.Z. and Faÿ, T.D.: 1978, Rev. Mex. Astron. Astrofis. 2, 273
- 57 []Johnson, D.R.H., Barlow, M.J. and Drew, J.E.: 1992, Monthly Notices Roy. Astron. Soc. 255, 261
- 1989 Kahn, F.D.: 1989, in Davidson, K., Moffat, A.F.J and Lamers, H.J.G.L.M. (eds), Physics of Luminous Blue Variables, Kluwer, page 177
- 58 []Kharadze, E.K.: 1936, Z. Astrophys 11, 304
- 59 []Kharadze, E.K., Magalashvili, N.L. and Megrelishvili, T.G.: 1952, Var. Stars 9, 150
- 60 []Kiriakidis, M., Fricke, K.J. and Glatzel, W.: 1993, Monthly Notices Roy. Astron. Soc. 264, 50
- 1983 Kolka, I.: 1983, Publ. Academy of Sci. Estonian SSR 32, 51
- 61 []Kolka, I.: 1998, in Kaper, L. and Fullerton, A.W. (eds.), ESO Astrophys.Symp., Cyclical Variability of Stellar Winds, Springer, page 111
- 62 []Kuan, P. and Kuhi, L.: 1975, Astrophys. J. 199, 148
- 63 []Kunasz, P. and van Blerkom, D.: 1979, Astrophys. J. 224, 193
- 64 []Kupo, I.D.: 1955, Astron. Circ. U.S.S.R. 163, 23
- 1978 Kwok, S., Purton, C.R. and Fitzgerald, P.M.: 1978, Astrophys. J. 219, L125
- 65 []Lamers, H.J.G.L.M., de Groot, M. and Cassatella, A.: 1983, Astron. Astrophys. 128, 299
- 1985 Lamers, H.J.G.L.M., Korevaar, P. and Cassatella, A.: 1985, Astron. Astrophys. 149, 29
- 66 []Lamers, H.J.G.L.M.: 1986, Astron. Astrophys. 159, 90
- 67 []Lamers, H.J.G.L.M. and de Groot, M.: 1992, Astron. Astrophys. 257, 153
- 68 []Lamers, H.J.G.L.M. et al.,: 1996, Astron. Astrophys. 315, L229
- 1994 Langer, N., Hamman, W.-R., Lennon, M., Najarro, F., Pauldrach, A.W.A. and Puls, J.: 1994, Astron. Astrophys. 290, 819
- 69 []Leitherer, C. and Zickgraf, F.J.: 1987, Astron. Astrophys. 257, 153
- 1997 Leitherer, C.: 1997, in Nota, A. and Lamers, H.J.G.L.M. (eds), ASP Conf. Series, vol. 120,, LBVs-Massive Stars in Transition, page 58
- 70 []Lesh, J.R.: 1968, Astrophys. J. Suppl. 17, 371
- 71 []Lockyer, W.J.S.: 1924, Monthly Notices Roy. Astron. Soc. 84, 409
- 1995 Lucy, L. B.: 1995, Astron. Astrophys. 294, 555
- 72 []Luud, L.S.: 1966, Publ. Tartu Astroph. Obs. 35, 189
- 73 []Luud, L.S.: 1967a, Sov. Astr. 11, 211
- 74 []Luud, L.S.: 1967b, Dokl. Akad. Nauk. Armeanskoi S.S.R. 3, 379
- 75 []Luud, L.S.: 1969, in Detre, L. (ed.), Non-periodic Phenomena in Variable Stars, Academic Press, Budapest, page 197
- 76 []Luud, L.S., Golandski, O. and Iarigina, T.: 1975, Publ. Tartu Astrophys. Obs. 53, 250
- 77 []Luud, L.S. and Sapar, A.: 1980, The UV spectrum of P Cyg, Tartu Obs. preprint A-4
- 78 []Maeder, A.: 1989, in Davidson, K., Moffat, A.F.J and Lamers, H.J.G.L.M. (eds), Physics of Luminous Blue Variables, Kluwer, page 15
- 79 []Maeder, A. and Meynet, G.: 1987, Astron. Astrophys. 182, 243
- 80 []Magalashvili, N.L. and Kharadze, E.K.: 1967a, Inf. Bull. Var. Stars 210
- 81 []Magalashvili, N.L. and Kharadze, E.K.: 1967b, Observatory 87, 295
- 1986a Markova, N.: 1986a, Astrophys. Sp. Sci. 123, 5
- 1986b Markova, N.: 1986b, Astron. Astrophys. 162, L3
- 1990 Markova, N.: 1990, Monthly Notices Roy. Astron. Soc. 244, 105
- 1991 Markova, N.: 1991, PhD thesis, National Astronomical Observatory of Bulgarian Academy of Sciences.
- 1993a Markova, N.: 1993a, Astron. Astrophys. 273, 555
- 1993b Markova, N.: 1993b, Astrophys. Sp. Sci. 201, 61
- 1994 Markova, N.: 1994, Astron. Astrophys. Suppl. 108, 561
- 82 []Markova, N.: 1998, in IAU Coll. 169, Variable and Non-Spherical Stellar Winds in Luminous Hot Stars, in press
- 1984 Markova, N. and Kolka, I.: 1984, Astrofizica 20, 465
- 1984 Markova, N. and Kolka, I.: 1985, Astrofizica 23, 539
- 1995 Markova, N. and Zamanov, R.: 1995, Astron. Astrophys. Suppl. 114, 499
- 83 []Markova, N. and de Groot, M.: 1997, Astron. Astrophys. 326, 1111
- 84 []Markwick, E.E.: 1892, Mem. Brit. Astron. Assn. 1, 71
- 85 []Maury, M.: 1897, Annals Harv. Coll. Obs. 28, 101
- 86 []McCrea, W.S.: 1929, Zs. Phys. 57, 367
- 87 []Meaburn, J., Lopez, J.A., Barlow, M.J. and Drew, J.E.: 1996, Monthly Notices Roy. Astron. Soc. 283, L69
- 88 []Meaburn, J., López, J.A. and O’Connor, J.: 1999, Astrophys. J. 516, L29
- 89 []Merrill, P.W.: 1913a, Lick Obs. Bull. 7, 162
- 90 []Merrill, P.W.: 1913b, Lick Obs. Bull. 8, 24
- 91 []Müller, G. and Hartwig, E.: 1918, Geschichte und Literatur des Lichtwechsels der bis Ende 1915 als sicher veränderlich anerkannten Sterne nebst einem Katalog der Elemente ihres Lichtwechsels, Leipzig, p. 444
- 92 []Najarro, F.: 1995, PhD thesis, Univ. of Münich
- 93 []Najarro, F., Hillier, D.J. and Stahl, O.: 1997, Astron. Astrophys. 326, 1117
- 94 []Nikonov, V.B.: 1936, Bull. Abastumanskoi Astrophys. Obs. 1, 35
- 95 []Nikonov, V.B.: 1937, Bull. Abastumanskoi Astrophys. Obs. 2, 23
- 96 []Nota, A., Livio, M., Clampin, M. and Schulte-Ladbeck, R.: 1995, Astrophys. J. 448, 788
- 97 []Nugis, T., Kolka, I. and Luud, L.: 1979, in Conti, P.S. and de Loore, C.W.H. (eds.), Mass Loss and Evolution of O Type Stars, Reidel, Dordrecht, page 39
- 98 []O’Connor, Meaburn, J. and Bryce, M.: 1998, Monthly Notices Roy. Astron. Soc. 300, 411
- 99 []van den Oord, G.H.J., Waters, L.B.F.M., Lamers, H.J.G.L.M., Abbott, D.C., Bieging, J.H. and Churchwell, E.: 1985, in E. Hjellming, R.M., Gibson, D.M. (eds.), Radio Stars, Astrophys. and Space Sci. Library, Vol. 116, Dordrecht, page 111
- 100 []Owocki, S.: 1998, in Kaper, L. and Fullerton, A.W. (eds.), ESO Astrophys.Symp., Cyclical Variability of Stellar Winds, Springer, page 325
- 101 []Ozemre, K.: 1978, Publ. Istanb. Univ. Obs. No. 101
- 1990 Pauldrach, A.W.A. and Puls, J.: 1990, Astron. Astrophys. 237, 409
- 102 []Percy, J.R. and Welch, D.L.: 1983, Publ. Astron. Soc. Pac. 95, 491
- 103 []Percy. J.R., Napke, A.E., Richer, M.G., Harmanec, P., Horn, J., Koubsky, P., Kriz, S., Bozic, H., Clark, W.E., Landis, H.J., Milton, R.E., Reisenweber, R.C., Xsoldos, E. and Fisher, D.A.: 1988, Astron. Astrophys. 191, 248
- 104 []Prager, R.: 1936, Geschichte und Literatur des Lichtwechsels der veränderlichen Sterne, 2nd ed., Ferd. Dümmlers Verlagsbuchhandlung, Berlin, Vol. 2, p. 61
- 105 []v. Prittwitz, F.: 1900, Astron. Nachr. No. 3694
- 106 []v. Prittwitz, F.: 1907, Astron. Nachr. No. 4210
- 107 []Safarik: 1888, Astron. Nachr. No. 2874
- 108 []Schneller, H.: 1957, Geschichte und Literatur des Lichtwechsels der veränderlichen Sterne, 2nd ed., Akademie verlag, Berlin, Vol. 4, p. 258
- 1994 Scuderi, S., Bonanno, G., Spadaro, D., Panagia, N., Lamers, H.J.G.L.M. and de Koter, A.: 1994, Astrophys. J. 437, 465
- 109 []Skinner, C.J., Exter, K.M., Barlow, M.J., Davis, R.J. and Bode, M.: 1997, Monthly Notices Roy. Astron. Soc. 288, L7
- 1991 Stahl, O., Mandel, H., Szeifert, Th., Wolf, B. and Zhao, F.: 1991, Astron. Astrophys. 244, 467
- 1993 Stahl, O., Mandel, H., Wolf, B., Gäng, Kaufer, A., Kneer, R., Szeifert, Th. and Zhao, F.: 1993, Astron. Astrophys. Suppl. 99, 167
- 110 []Stahl, O., Wolf, B., Gäng, Th., Kaufer, A., Mandel, H., Szeifert, Th. and Zhao, F.: 1994, Astron. Astrophys. Suppl. 107, 1
- 111 []Stothers, R.B: 1999a, Monthly Notices Roy. Astron. Soc. in press
- 112 []Stothers, R.B: 1999b, Astrophys. J. 513, 460
- 113 []Stothers, R.B. and Chin, C.-W.: 1993, Astrophys. J. 408, L85
- 114 []Stothers, R.B. and Chin, C.-W.: 1995, Astrophys. J. 451, L61
- 115 []Struve, O.: 1935, Astrophys. J. 81, 66
- 116 []Struve, O. and Roach, F. E.: 1939, Astrophys.J. 90, 727
- 1991a Taylor, M., Nordsieck, K.H., Schulte-Ladbeck, R.E. and Bjorkman, K.S.: 1991a, Astron. J. 102, 1197
- 1991b Taylor, M., Code, A.D., Nordsieck, K.H., Anderson, C.M., Babler, B.L., Bjorkman, K.S., Clayton, G.C., Magalhães, A.M., Meade, M.R., Schulte-Ladbeck, R.E. and Whitney, B.A.: 1991b, Astrophys. J. 382, L85
- 1979 Underhill, A.: 1979, Astrophys. J. 234, 528
- 1982 Underhill, A.: 1982, Underhill, A. and Doazan, V. (eds.), B Stars With and Without Emission Lines, SP-NASA
- 117 []Vakili, F., Mourard, D., Bonneau, D., Morand, F. and Stee, Ph.: 1997, Astron. Astrophys. 323, 183
- 118 []Viotti, R. and Nesci, R.: 1973, Inform. Bull. Var. Stars No. 878
- 1986 Waters, L.B.F.M. and Wesselius, P.R.: 1986, Astron. Astrophys. 155, 104
- 119 []Wendker, H.J.: 1982, Astron. Astrophys. 256, 452
- 1987 Wendker, H.J.: 1987, Astron. Astrophys. Suppl. 69, 87
- 1973 Wendker, H.J., Baars, J.W.H. and Altenhoff, W.J.: 1973, Nat. Phys. Sci. 245, 118
- 120 []White, R.L. and Becker, R.H.: 1982, Astrophys. J. 262, 657
- 121 []Wright, A.E. and Barlow, M.J.: 1975, Monthly Notices Roy. Astron. Soc. 170, 41
- 122 []Zinner, E.: 1926, Helligkeitsverzeichnis von 2373 Sternen bis zur Grösse 5.50, Veröff. Remeis-Sternw. Bamberg, 2, 1
- 123 []Zinner. E.: 1938, Vierteljahrschrift Bamberg, 74, 47
| ion | variable DAC | IP(eV) | EP(eV) | References |
|---|---|---|---|---|
| Balmer | 90 to 230 | de Groot 1969, Ivanova et al.1982, Markova 1986a | ||
| HeI | 90 to 210 | 0.00 | 20.5 to 21.1 | Herbig 1962, Herman 1964, Astafyev 1968 |
| de Groot 1969, Ivanova et al. 1982, Markova 1993b | ||||
| NaI | 185 | 0.00 | 0.00 | Ozemre 1978 |
| 188 | Markova 1991 | |||
| CaII (UV) | 128 | 6.09 | 0.00 | Luud and Sapar 1980 |
| CaII | 90 to 200 | 0.00 | Viotti and Nesci 1973, Markova 1990 | |
| 170 to 200 | Luud, Golandski and Iarigina 1975, Ozemre 1978 | |||
| 130 | Beals 1950 | |||
| 185 | Ozemre 1978 | |||
| CrII (UV) | 177 | 6.74 | 1.5 | Cassatella et al. 1979, Lamers et al. 1985 |
| 170 | Luud and Sapar 1980 | |||
| MnII (UV) | 100 to 180 | 7.40 | 0.0 to 5.4 | Cassatella et al. 1979, Lamers et al. 1985 |
| 153 | Luud and Sapar 1980 | |||
| NiII (UV) | 100 to 180 | 7.61 | 0.0 to 6.8 | Cassattella et al. 1979,Lamers et al. 1985 |
| 182 | Luud and Sapar 1980 | |||
| MgII (UV) | 158 | 7.61 | 0.0 to 4.4 | Luud and Sapar 1980 |
| MgII | 70 to 180 | 7.61 | 8.83 | Markova 1991 |
| 95 to 124 | Ivanova et al. 1982 | |||
| FeII (UV) | 112 to 174 | 7.86 | 0.9 to 2.6 | Cassatella et al. 1979, Lamers et al. 1985 |
| 90 to 180 | Israelian et al. 1996 | |||
| (UV) | 180 | Luud and Sapar 1980 | ||
| FeIII(UV) | 100 to 157 | 16.16 | 7 to 12 | Lamers et al. 1985 |
| (UV) | 60 to 170 | Israelian et al. 1996 | ||
| (UV) | 133 | Luud and Sapar 1980 | ||
| (UV) | 157 | Hutchings 1979 | ||
| FeIII | 90 to 180 | 8.21 | Herbig 1962, Markova 1998 | |
| SII (UV) | 178 | 10.31 | 0.00 | Luud and Sapar 1980 |
| PII (UV) | 163 | 10.90 | 0.00 | Luud and Sapar 1980 |
| OII | 50 to 90 | 13.56 | 22.9 | Markova 1993a |
| TiIII(UV) | 112 | 13.6 | 0.0 to 4.7 | Cassatela et al. 1979 |
| (UV) | 137 | Luud and Sapar 1980 | ||
| NII | 90 to 130 | 14.49 | 18.4 | Markova 1993a |
| MnIII(UV) | 89 | 15.64 | Luud and Sapar 1980 | |
| SiIII(UV) | 71 | 16.27 | 1.0 to 17.7 | Cassatella et al. 1979 |
| (UV) | 110 | Luud and Sapar 1980 | ||
| (UV) | 140 | Hutchings 1979 | ||
| SiIII | 70 to 115 | 18.92 | Markova 1993a | |
| CrIII(UV) | 92 | 16.6 | 2.1 to 8.9 | Cassatella et al. |
| (UV) | 123 | Luud and Sapar 1980 | ||
| NiIII(UV) | 79 | 18.4 | Cassatella et al. 1979 | |
| (UV) | 131 | Luud and Sapar 1980 | ||
| AlIII(UV) | 202 | 18.75 | 0.00 | Luud and Sapar 1980 |
| AlIII(UV) | 159 | 6.6 | Luud and Sapar 1980 | |
| SiIV | 20 to 70 | 33.32 | 23.95 | Markova 1993a |
| 40 to 80 | Ivanova et al. 1982 |
-
Table 1. Radial-velocity data (in ) of DACs in P Cygni reported in the literature.
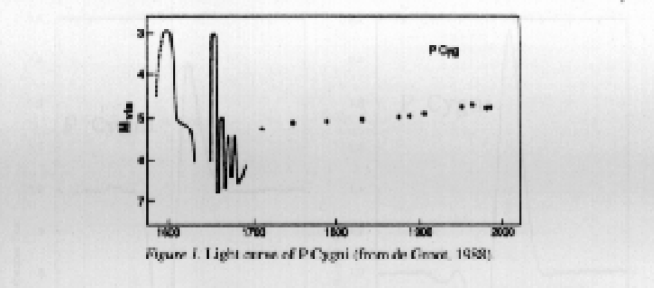
Figure 1: Light curve of P Cygni (from de Groot 1988) -
Fig 1. Light curve of P Cygni (from de Groot 1988).

Figure 2: Typical P Cygni-type profiles of HeI (3819.6 Å) and H lines. The spectrum was obtained 1999 May 29 with the 2.5-m Nordic Optical Telescope of the La Palma Observatory (Canary Islands, Spain) by G. Israelian. The spectrum has a resolution 80 000 and a signal-to-noise (S/N) 200. -
Fig 2. Typical P Cygni-type profiles of HeI (3819.6 Å) and H lines. The spectrum was obtained 1999 May 29 with the 2.5-m Nordic Optical Telescope of the La Palma Observatory (Canary Islands, Spain) by G. Israelian. The spectrum has a resolution 80 000 and a signal-to-noise (S/N) 200.
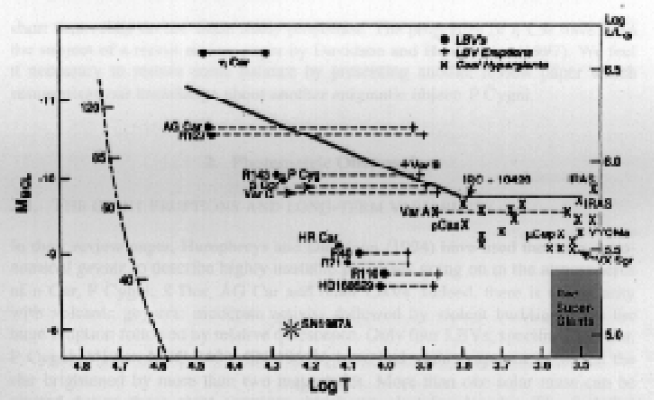
Figure 3: The most luminous stars on the HR diagram. The dashed lines are the LBV transitions from the quiescence (filled circle) and to the eruption phase (crosses). The Humphreys-Davidson upper luminosity limit is shown as a solid line (adopted from Humphreys and Davidson 1994). -
Fig 3. The most luminous stars on the HR diagram. The dashed lines are the LBV transitions from the quiescence (filled circle) and to the eruption phase (crosses). The Humphreys-Davidson upper luminosity limit is shown as a solid line (adopted from Humphreys and Davidson 1994).
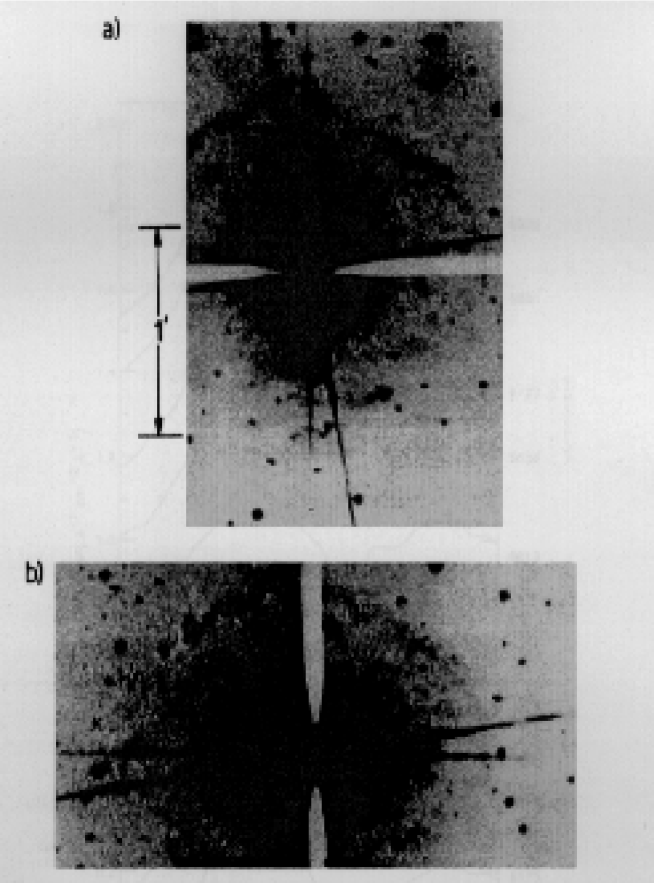
Figure 4: Negative grey-scale images of the outer nebulosity in the [NII] 6548 Å line. The images were obtained at the La Palma Observatory by Barlow et al. (1994) using the 4.3 arcsec wide occulting strip oriented east-west and north-south, respectively. -
Fig 4. Negative grey-scale images of the outer nebulosity in the [NII] 6548 Å line. The images were obtained at the La Palma Observatory by Barlow et al. (1994) using the 4.3 arcsec wide occulting strip oriented east-west and north-south, respectively.

Figure 5: Profiles of the 1873 Å line in the series of IUE spectra SWP25731-30923 (JD6175-6922) (from Israelian et al. 1996). -
Fig 5. Profiles of the 1873 Å line in the series of IUE spectra SWP25731-30923 (JD6175-6922) (from Israelian et al. 1996).

Figure 6: Variations of mean radial velocities of four shells identified in FeII lines (from Israelian et al. 1996). -
Fig 6. Variations of mean radial velocities of four shells identified in FeII lines (from Israelian et al. 1996).