NEW MID-INFRARED DIAGNOSTIC OF THE DUSTY TORUS MODEL FOR SEYFERT NUCLEI
Abstract
We propose a new diagnostic of the “dusty torus” model for Seyfert nuclei. Dust grains in the torus are heated by the nuclear continuum, and reradiate mostly in the mid-infrared wavelengths. From the torus geometry, it is predicted that the emission at µm has strong dependence on the viewing angle. Since the dependence is predicted to be insignificant at µm, we study the flux ratio between 3.5 µm ( band) and 25 µm; . In three different samples (optically selected, X-ray selected, and infrared selected samples) of Seyfert galaxies, the observed values of between type 1 Seyferts (S1s) and type 2 Seyferts (S2s) are found to be clearly separated; for S1s while for S2s. This implies universality of their torus properties. With this result and the other observational characteristics, we investigate the most plausible torus model among those presented in Pier & Krolik (1992, 1993).
Subject headings:
galaxies: Seyfert - infrared: galaxies1. INTRODUCTION
Dusty tori around active galactic nuclei (AGNs) play an important role in the classification of Seyfert galaxies. (Antonucci & Miller 1985; see also Antonucci 1993 for a review). Seyfert galaxies observed from a face-on view of the torus are recognized as type 1 Seyferts (S1s) while those observed from a edge-on view are recognized as type 2 Seyferts (S2s). In this way, the dusty tori act as a material anisotropically obscuring the emission from their interior region.
Dusty tori themselves are also important emitting sources in AGNs. Dust grains within the torus absorb high-energy photons from the central engine, and re-emit them in the mid-infrared (MIR) regime. Therefore, infrared radiation from the dusty torus emission is useful in studying the physical properties of the tori in AGNs (e.g., Dopita et al. 1998 and references therein). Since the tori are quite optically thick, the MIR spectrum is predicted to have strong dependence on the viewing angle [Efstathiou & Rowan-Robinson 1990; Pier & Krolik 1992, 1993 (hereafter PK92 and PK93, respectively); Granato & Danese 1994; Granato, Danese, & Franceschini 1996, 1997]. When the torus is observed from a face-on view, its hot inner surface is seen and the emission at 10 µm is enhanced. When observed from a edge-on view, the emission at 10 µm is obscured and thus weakened. Heckman (1995) observed that the averaged ratio of -band (10 µm) flux to nonthermal radio flux is higher in S1s than in S2s (see also Giuricin, Mardirossian, & Mezzerre 1995). Heckman, Chambers, & Postman (1992) observed a similar enhancement in radio-loud quasars (i.e., type 1) with respect to radio galaxies (i.e., type 2). PK93 observed that flux ratios of band (3.5 µm) to band in S1s are higher than those in S2s. Fadda et al. (1998) observed that the MIR spectrum is steeper (i.e., redder) in S2s than in S1s. However, further details of the MIR emission from dusty tori are unknown.
This paper proposes the flux ratio of band to IRAS 25 µm band as a new MIR diagnostic for the dusty torus model (§2). We compile the observational data from the literature (§3), compare the above ratios of S1s with those of S2s (§4), and discuss properties of the tori (§5).
2. NEW MIR DIAGNOSTIC
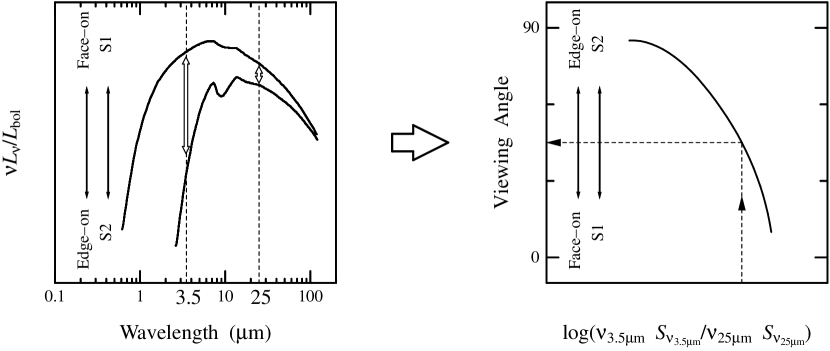
As stated above, the torus emission is expected to be more anisotropic at 10 µm than at 20 µm because the visibility of the inner wall of the torus is highly viewing angle dependent. Therefore, it is of interest to compare S1s with S2s in a flux ratio between µm and µm. Since the IRAS photometric data are available for most of the nearby Seyfert galaxies (Moshir et al. 1992), we adopt the flux ratio between band and IRAS 25 µm band,
The basic concept of our new MIR diagnostic is schematically shown in Figure 1. Since the viewing angle dependence is more significant at 3.5 µm, S2s are expected to have lower values of than S1s.
Here we note that PK 93 used the flux ratio between and bands, , to compare S1s with S2s. However, the -band flux is affected by a silicate line at 9.7 µm. When the torus is observed from a edge-on view, the silicate line is seen as an absorption line, and thus both the fluxes in and bands are weakened. The difference between S1s and S2s in is thereby expected not to be as prominent as that in .
3. DATA SAMPLE
To perform a statistical analysis with the MIR diagnostic defined in the previous section, we have compiled photometric data in , , and IRAS 25 µm bands from the literature (e.g., Ward et al. 1987; Roche et al. 1991; Moshir et al. 1992; PK93). Since radiation form AGNs is anisotropic in most of the energy bands, it is difficult to construct a statistically complete sample. We instead adopt three samples chosen by different selection criteria. The first sample consists of the CfA Seyfert galaxies111The preliminary analysis based on the CfA Seyfert galaxies was reported in Murayama, Mouri, & Taniguchi (1997). (Huchra & Burg 1992), which provide a well defined collection of objects limited by the magnitude of their host galaxies. The second sample is the one limited by the hard X-ray flux from 2 to 10 keV (Ward et al. 1987). Since hard X-rays arise from the central engine itself and are not affected seriously by dust grains, this sample is expected to be fair at least for S1s. The third sample is taken from Roche et al. (1991). This sample is not complete but composed of -band bright objects. For each object in this sample, Roche et al. (1991) observed an emission feature at 11.3 µm, which allows us to examine the presence or absence of any circumnuclear star formation activities. Our CfA, Ward, and Roche samples contain 18 S1s and 6 S2s, 20 S1s and 4 S2s, and 11 S1s and 11 S2s, respectively. Some objects are included in more than one sample. In total, there are 31 S1s and 14 S2s. Their basic data are summarized in Table 1.
| NameaaGalaxies shown with asterisks are excluded from the analysis because of possible contamination to the infrared emission | bbCompactness parameter defined in text | cc | SampleddC: the CfA sample; W: the Ward sample; R: the Roche sample | RejecteeReasons for excluding from the analysis | ||||||
|---|---|---|---|---|---|---|---|---|---|---|
| (Jy) | (Jy) | (Jy) | (Jy) | (Jy) | (Jy) | |||||
| Type 1 Seyfert | ||||||||||
| 2237+07 | 0.016 | 0.082 | 0.1400 | 0.3920 | 0.900 | 1.270 | 0.81 | C | ||
| 3A 0557-383 | 0.113 | 0.347 | 0.5289 | 0.6846 | 0.3223 | 0.78 | 0.07 | W R | ||
| 3C 120 | 0.090 | 0.220 | 0.2860 | 0.6350 | 1.283 | 2.786 | 1.00 | 0.00 | W R | |
| Akn 120 | 0.0740 | 0.139 | 0.3191 | 0.4099 | 0.643 | 1.084 | 0.52 | 0.11 | W | |
| ESO 141-G55 | 0.0640 | 0.184 | 0.2420 | 0.3522 | 0.5741 | 0.92 | 0.11 | W | ||
| I Zw 1 | 0.110 | 0.390 | 0.5118 | 1.211 | 2.243 | 2.643 | 1 | CR | ||
| IC 4329A | 0.227 | 0.760 | 1.082 | 2.213 | 2.030 | 1.661 | 0.90 | W R | ||
| MCG -6-30-15 | 0.0877 | 0.286 | 0.3803 | 0.8088 | 1.087 | 1.096 | 0.97 | W | ||
| MCG 8-11-11 | 0.075 | 0.296 | 0.6394 | 1.948 | 3.005 | 4.235 | 0.65 | W R | ||
| Mrk 79 | 0.0543 | 0.200 | 0.3062 | 0.7625 | 1.503 | 2.363 | 0.87 | W | ||
| Mrk 231 | 0.360 | 1.420 | 1.872 | 8.662 | 31.99 | 30.29 | 1 | CR | ||
| Mrk 279* | 0.032 | 0.076 | 0.1990 | 0.2890 | 1.200 | 1.970 | 0.46 | C | ||
| Mrk 335 | 0.123 | 0.210 | 0.3021 | 0.3777 | 0.3433 | 0.83 | 0.37 | C | ||
| Mrk 509 | 0.113 | 0.220 | 0.3158 | 0.7018 | 1.364 | 1.521 | 0.91 | 0.06 | W R | |
| Mrk 530 | 0.025 | 0.077 | 0.1800 | 0.1910 | 0.8560 | 2.140 | 0.50 | C | ||
| Mrk 590 | 0.0469 | 0.169 | 0.1917 | 0.2214 | 0.4893 | 1.457 | 1 | 0.18 | C W | |
| Mrk 766 | 0.0559 | 0.288 | 0.3855 | 1.295 | 4.026 | 4.658 | 1 | C | ||
| Mrk 817 | 0.0619 | 0.357 | 0.3350 | 1.175 | 2.118 | 2.268 | 1 | C | ||
| Mrk 841 | 0.0407 | 0.1445 | 0.1924 | 0.4726 | 0.4593 | 1 | C W | |||
| Mrk 1040 | 0.105 | 0.294 | 0.6104 | 1.315 | 2.555 | 4.551 | 0.63 | W | ||
| NGC 3227 | 0.0783 | 0.263 | 0.6671 | 1.764 | 7.825 | 17.59 | 0.54 | C W | ||
| NGC 3516 | 0.117 | 0.239 | 0.4258 | 0.8937 | 1.758 | 2.259 | 0.73 | C | ||
| NGC 3783 | 0.131 | 0.400 | 0.8396 | 2.492 | 3.257 | 4.899 | 0.67 | W R | ||
| NGC 4051* | 0.077 | 0.297 | 0.8554 | 1.590 | 7.131 | 23.92 | 0.44 | C W R | ||
| NGC 4151 | 0.344 | 1.400 | 2.080 | 4.600 | 6.720 | 8.600 | 0.88 | C W R | ||
| NGC 4593 | 0.081 | 0.182 | 0.3441 | 0.8089 | 3.052 | 5.947 | 0.70 | W | ||
| NGC 5033* | 0.0487 | 0.031 | 0.9452 | 1.148 | 13.80 | 43.85 | 0.04 | C | ||
| NGC 5273 | 0.016 | 0.134 | 0.1340 | 0.2420 | 0.9910 | 2.030 | 1 | C | ||
| NGC 5548 | 0.0986 | 0.210 | 0.4006 | 0.7690 | 1.073 | 1.614 | 0.67 | C W | ||
| NGC 7213 | 0.115 | 0.261 | 0.6063 | 0.7421 | 2.666 | 8.177 | 0.51 | 0.04 | W | |
| NGC 7469* | 0.1594 | 0.600 | 1.348 | 5.789 | 25.87 | 34.90 | 0.69 | C W R | PAH | |
| Type 2 Seyfert | ||||||||||
| Circinus* | 0.701 | 6.00 | 19.58 | 71.29 | 248.7 | 315.9 | 0.45 | R | ||
| Mrk 266 | 0.007 | 0.306 | 0.2307 | 0.9765 | 7.432 | 11.07 | 1 | C | ||
| Mrk 348 | 0.039 | 0.300 | 0.3080 | 0.8347 | 1.290 | 1.549 | 1 | R | ||
| Mrk 533* | 0.046 | 0.217 | 0.6724 | 1.896 | 5.588 | 8.146 | 0.44 | CR | ||
| NGC 1068 | 1.920 | 18.0 | 39.7 | 85.04 | 176.2 | 224.0 | 0.59 | CR | ||
| NGC 1275 | 0.078 | 0.674 | 1.069 | 3.539 | 7.146 | 6.981 | 0.91 | R | ||
| NGC 2110* | 0.047 | 0.198 | 0.3488 | 0.8397 | 4.129 | 5.676 | 0.75 | R | NLXG | |
| NGC 2992* | 0.057 | 0.249 | 0.594 | 1.422 | 6.941 | 14.44 | 0.56 | W R | PAH, NLXG | |
| NGC 3079* | 0.073 | 0.091 | 1.523 | 2.272 | 44.5 | 89.2 | 0.07 | C | ||
| NGC 4388 | 0.074 | 0.404 | 0.9964 | 3.463 | 10.24 | 18.10 | 0.59 | CR | ||
| NGC 5506* | 0.313 | 0.643 | 1.282 | 3.638 | 8.409 | 8.886 | 0.69 | W R | NLXG | |
| NGC 5929* | 0.0073 | 0.0186 | 0.360 | 1.570 | 9.450 | 12.00 | 0.08 | C | ||
| NGC 7172* | 0.132 | 0.141 | 0.4374 | 0.7612 | 5.712 | 12.29 | 0.40 | 0.09 | W R | , NLXG |
| NGC 7582* | 0.201 | 0.877 | 1.620 | 6.436 | 49.10 | 72.92 | 0.82 | W R | PAH, NLXG | |
Besides the dusty torus, several sources in Seyfert galaxies contribute to the observed MIR fluxes (see below). We exclude galaxies where the contamination with such sources appears to be significant. These galaxies are indicated in Table 1. The resultant final samples consist of 27 S1s and 5 S2s.
The IRAS 25 µm measurements were made with an aperture which is large enough to cover the entire galaxy (; Neugebauer et al. 1984). There could be contamination with the disk of the host galaxy. To find galaxies where the disk emission dominates over the torus emission, we use the compactness parameter at 10 µm (Devereux 1987), Here is the band flux, is the IRAS 12 µm flux, and is the color correction factor, This compactness parameter gives an estimate on the ratio of the small-beam flux to the entire flux at 10 µm. The value of each galaxy is given in Table 1. Some objects exhibit . This is due to uncertainties in the measurement or time variation of the nuclear flux. In such cases, we give . The MIR fluxes of galaxies with are likely to be dominated by the disk emission. These galaxies are not used in our following analysis.
On the other hand, the - and -band data given in Table 1 were obtained with small apertures ( 5″–10″). In these data, the contamination with the host galaxy is unlikely to be important. From -band images of Seyfert galaxies, Kotilainen et al. (1992) estimated the average light contribution from the host galaxy as 32 %. Zitelli et al. (1993) found that -band images of Seyfert galaxies are more centrally concentrated than the -band ones. Hence the contribution from the host galaxy to the -band flux is less than %.
Seyfert galaxies often exhibit circumnuclear starburst activities, which could affect the MIR emission (see Keto et al. 1992 for the case of NGC 7469). Such objects are excluded from our analysis. As a signature of the starburst activity, we use emission features in the 8–13 µm regime (Roche et al. 1991). They are due to transient heating of polycyclic aromatic hydrocarbon molecules (PAHs) by UV photons from OB stars. Since PAHs are destroyed by X-rays, PAH features are absent in genuine AGNs (see Voit 1992 and references therein).
We also exclude narrow-line X-ray galaxies (NLXGs), i.e., S2s with strong hard X-ray emission (Shuder 1980; Véron et al. 1980; Ward et al. 1987). The central engine of these galaxies is believed to be hidden not by a dusty tori but by the disk of the host galaxy. Most of NLXGs are actually edge-on galaxies (see Ulvestad & Wilson 1984 and Keel 1980 for the cases of NGC 2992 and NGC 5506). Furthermore, Glass et al. (1981) reported that values of NLXGs are similar to those of S1s rather than those of S2s.
4. RESULTS
Figure 2 shows frequency distributions of of S1s and S2s separately for the CfA sample (), the Ward sample (), the Roche sample (), and the total sample (). The galaxies excluded in the previous section are shown by white bars. Only the galaxies shown by black bars are used in the following analysis.


All of the S1s have while most of the S2s have . The S2 which lies exceptionally at is Mrk 348. This galaxy exhibits no silicate absorption feature at 9.7 µm (Roche et al. 1991). Since the silicate absorption is a common property of S2s, Mrk 348 is considered to be in a face-on view like usual S1s. The absence of the broad-line region in this galaxy could result from, e.g., obscuration of the central region by a small cloud. There is no significant difference in the distributions of S1s and S2s among the three samples in Figures 2–, thus our samples is probably free of large orientation bias. If we apply the Kolmogrov-Smirnov (KS) test, the probability that the observed distributions of S1s and S2s originate in the same underlying population turns out to be 0.275 %. When galaxies shown by white bars are included, the distribution of S2s is different among the three samples. This difference is likely to come from the different sampling criteria.
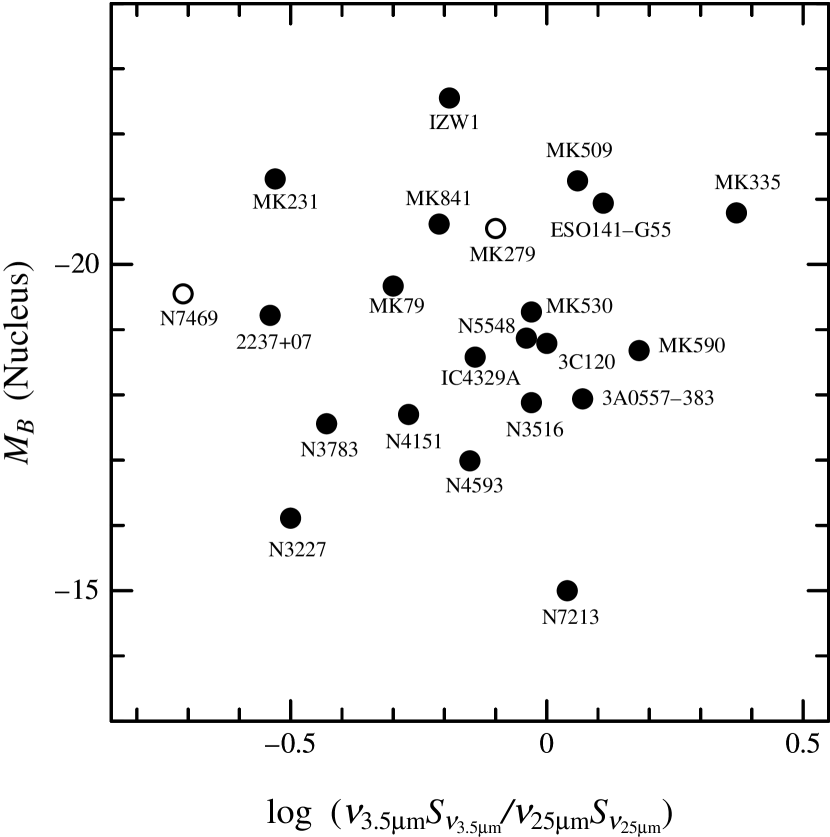
Figure 3 compares the ratio with the nuclear absolute magnitude [ (nucleus)] for S1s. The (nucleus) values are taken from Kotilainen, Ward, & Williger (1993) and Granato et al. (1993), and are used as a measure of the luminosity of the central engine. If the observed ratio depends on the intrinsic luminosity of the central engine rather than the Seyfert type, there would be a certain relationship between and (nucleus). Since no clear correlation is seen in Figure 3, we conclude that the difference in the intrinsic nuclear luminosity does not affect the observed value of in S1s. This conclusion is applicable to S2s because S1s and S2s are likely to have the same torus properties.
Finally, we show the frequency distributions of in Figure 4. The KS probability that the underlying populations of S1s and S2s are the same is 0.0404 %. Although this value is smaller than that for the ratio, the separation between S1s and S2s in (Figure 4) is less clear than that in (Figure 2). This is because the -band emission is affected by the silicate feature at 9.7 µm.

5. DISCUSSION
The values for the S1s are clearly separated from those for the S2s at the critical value of . This limits the extent to which the dusty torus can vary among Seyfert galaxies; such variations would add “noise” and cause overlap between the two types. Hereafter, we compare our results with theoretical torus models of PK92 and PK93, and investigate the model which agrees best with the observations.
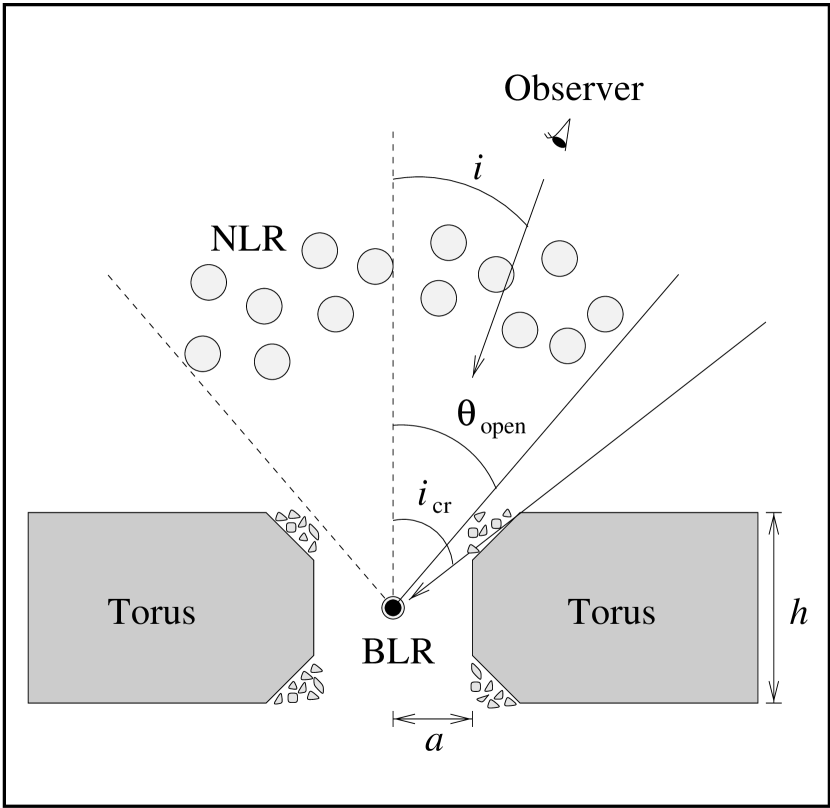
Figure 5 shows the geometrical configuration assumed in PK92 and PK93. The torus surrounds cylindrically around the central engine and the broad-line region. The semi-opening angle is given by the inner radius and the height of the torus; . The viewing angle is defined as an angle between the rotation axis of the torus and the line of sight. The critical viewing angle is defined such that the broad-line region is visible at . Since the actual torus should be clumpy and not have a sharp edge, we expect .
The torus emission is parameterized by the three quantities in the models of PK92 and PK93; 1) : the effective temperature of the inner wall of the torus, 2) : the inner aspect ratio, and 3) and : the radial and vertical Thomson optical depths. In the upper panel of Figure 6, we show the theoretical values as a function of the viewing angle for six dusty torus models of PK92 and PK93. In the lower panel, the observed values are shown separately for S1s and S2s. For each of the models, the observed critical ratio, , yields a critical viewing angle. The results together with the model parameters are given in Table 2.
| Model | aaEffective temperature of the torus | bbInner aspect ratio of the torus | ccRadial Thomson optical depth of the torus | ddVertical Thomson optical depth of the torus | eeSemi-opening angle derived from the inner aspect ratio | ffExpected viewing angle of the torus |
|---|---|---|---|---|---|---|
| (K) | (°) | (°) | ||||
| 1 | 1000 | 0.1 | 1 | 1 | 11 | 44 |
| 2 | 1000 | 0.3 | 0.1 | 0.1 | 31 | |
| 3 | 1000 | 0.3 | 1 | 0.1 | 31 | |
| 4 | 1000 | 0.3 | 1 | 1 | 31 | 87 |
| 5 | 800 | 0.3 | 1 | 1 | 31 | 82 |
| 6 | 500 | 0.3 | 1 | 1 | 31 | 46 |
The derived critical viewing angle ranges from 46° to 87° (Models 1, 4, 5, and 6). Since Models 2 and 3 do not give the critical viewing angle, these models are not appropriate for dusty tori in Seyfert galaxies. To proceed further, we have to compare the results with other observational properties of Seyfert galaxies (see below).
Narrow-line regions of S2s often exhibit conical morphologies, which are due to shadowing of the nuclear ionizing continuum by the torus. The observed semi-opening angle of the cone is thereby equal to the semi-opening angle of the torus . Table 3 summarizes statistical results from observations of conical narrow-line regions (Pogge 1989; Wilson & Tsvetanov 1994; Schmitt & Kinney 1996). These results indicate . On the other hand, Model 1 has . Thus this model is not appropriate for dusty tori in Seyfert galaxies.
| Reference | aaNumber of the observed Seyfert galaxies | |
|---|---|---|
| Pogge 1989 | 4 | |
| Wilson and Tsvetanov 1994 | 11 | |
| Schmitt and Kinney 1996 | 12 |
The critical viewing angle can be estimated from the number statistics of S1s and S2s if we observe Seyfert nuclei from random orientations on the statistical ground,
where (S1) and (S2) are the observed numbers of S1s and S2s, respectively (Miller & Goodrich 1990). Table 4 summarizes the results for three different surveys of Seyfert galaxies (Osterbrock & Shaw 1988; Salzer 1989; Huchra & Burg 1992). The derived critical viewing angles ranges from 27° to 46°. Since Models 4 and 5 give too large critical viewing angles (), they are not appropriate for dusty tori in Seyfert galaxies. Consequently, among the six models of PK92 and PK93, Model 6 with and is the best torus model.
| Reference | aaNumber of type 1 Seyfert galaxies | bbNumber of type 2 Seyfert galaxies | ccNumber ratio between type 1 and type 2 Seyfert galaxies corrected for the completeness of the survey | |
|---|---|---|---|---|
| Osterbrock and Shaw 1988 | 6 | 9 | 0.125 | 27° |
| Salzer 1989 | 9 | 7 | 0.20 | 34° |
| Huchra and Burg 1992 | 25 | 23 | 0.435 | 46° |
The values of the S2s lie between and , which correspond to the viewing angles between and . On the other hand, values of the S1s lie between and . This range is not explained by Model 6. The locus of Model 6 in Figure 6 is drawn down only to . Since the value at the smaller viewing angle is expected to be nearly constant, it would be impossible to reproduce the ratio as high as . One possibility that explains this higher ratio may be the 3 µm bump often seen in type 1 AGNs. This bump may be attributed to thermal emission from hot dust grains with K (e.g., PK93). Because the models of PK92 and PK93 assumed that the host dust component is an additional source to the torus, is underpredicted at small inclination angles. Although it is controversial whether this host dust component is a separate component from the torus or the inner surface of the torus, those hot dust grains lie close to the central engine in either case. Since their emission is important only when the central region is clearly visible, the 3 µm bump is negligible in S2s. Therefore the critical and are not affected by the treatment of the 3 µm bump.

We have examined only the small and sparse sets of the model parameters presented by PK92 and PK93. Further analyses with the larger and denser parameter sets are required to understand the torus properties in more detail. Nevertheless, our most important result, which has been obtained firstly with the new MIR diagnostic, is the clear separation in the ratio between S1s and S2s. This strongly suggests that the torus properties do not vary among Seyfert galaxies. The effective temperature of the inner wall may be universal as a result of that the inner wall is formed by balancing the rate of dust destruction with the rate at which the torus clouds drift inward (Krolik & Begelman 1988; PK92). We suspect that there are also certain mechanisms confining the vertical structure of the torus and shaping the uniform semi-opening angle.
References
- (1) Antonucci, R. 1993, ARA&A, 31, 473
- (2) Antonucci, R., & Miller, J. S. 1985, ApJ, 297, 621
- (3) Devereux, N. A. 1987, ApJ, 323, 91
- (4) Dopita, M. A., Heisler, C., Lumsden, S., Bailey, J. 1998, ApJ, 498, 570
- (5) Efstathiou, A., & Rowan-Robinson, M. 1990, MNRAS, 245, 275
- (6) Fadda, D., Giuricin, G., Granato, G. L., & Vecchies, D. 1998, ApJ, 496, 117
- (7) Giuricin, G., Mardirossian, F., & Mezzetti, M. 1995, ApJ, 446, 550
- (8) Glass, I. S., Moorwood, F. M., & Eichendorf W. 1982, A&A, 107, 276
- (9) Granato, G., & Danese, L. 1994, MNRAS, 268, 235
- (10) Granato, G., Danese, L., & Franceschini, A. 1996, ApJ, 460, L11
- (11) Granato, G., Danese, L., & Franceschini, A. 1997, ApJ, 486, 147
- (12) Granato, G., Zitelli, V., Bonoli, F., Danese, L., Bonoli, C., & Delpino, F. 1993, ApJS, 89, 35
- (13) Heckman, T. M. 1995, ApJ, 446, 101
- (14) Heckman, T. M., Chambers, K., & Postman, M. 1992, ApJ, 391, 39
- (15) Huchra, J., & Burg, R. 1992, ApJ, 393, 90
- (16) Keto, E., Ball, R., Arens, J., Jernigan, G., & Meixner, M. 1992, ApJ, 389, 223
- (17) Keel, W. C. 1980, AJ, 85, 198
- (18) Kotilainen, J. K., Ward, M. J., Boisson, C., Depoy, D. L., Smith, M. G., & Bryant, L. R. 1992, MNRAS, 256, 125
- (19) Kotilainen, J. K., Ward, M. J., Williger, G. M. 1993, MNRAS, 263, 655
- (20) Krolik, J. H., & Begelman, M. C. 1988, ApJ, 329, 702
- (21) Miller, J. S., & Goodrich, R. W. 1990, ApJ, 355, 456
- (22) Moshir, M. et al. 1992, Explanatory Supplement to the IRAS Faint Source Survey, Version 2, JPL-D-10015 8/92 (Pasadena: JPL)
- (23) Murayama, T., Mouri, H., & Taniguchi, Y. 1997, in Diffuse Infrared Radiation and the IRTS, edited by H. Okuda, T. Matsumoto, and T. L. Roellig, ASP Conf. Ser., Vol. 124, 381
- (24) Neugebauer, G. et al. 1984, ApJ, 278, L1
- (25) Osterbrock, D. E., & Shaw, R. 1988, ApJ, 327, 89
- (26) Pier, E., & Krolik, J. 1992, ApJ, 401, 99 (PK92)
- (27) Pier, E., & Krolik, J. 1993, ApJ, 418, 673 (PK93)
- (28) Pogge, R. W., 1989, ApJ, 345, 730
- (29) Roche, P. F., Aitken, D. K., & Smith, C. H. 1991, MNRAS, 252, 282
- (30) Salzer, J. 1989, ApJ, 347, 152
- (31) Schmitt, H. R., & Kinney, A. L. 1996, ApJ, 463, 498
- (32) Shuder, J. M. 1980, ApJ, 240, 32
- (33)
- (34) Spinoglio, L., & Malkan, M. A. 1989, ApJ, 342, 83
- (35) Ulvestad, J. S., & Wilson, A. S. 1984, ApJ, 285, 439
- (36) Véron, P., Lindblad, P. O., uiderwijk, E. J., Véron, M. P., & Adam, G. 1980, A&A, 87, 245
- (37) Voit, G. M. 1992, MNRAS, 258, 841
- (38) Ward, M. J., Elvis, M., Fabbiano, G., Carleton, N. P., Willner, S. P., & Lawrence, A. 1987, ApJ, 315, 74
- (39) Wilson, A. S., & Tsvetanov, Z. I. 1994, AJ, 107, 1227
- (40) Zitelli, V., Granato, G. L., Mandolesi, N., Wade, R., & Danese, L. 1993, ApJS, 84, 185