Adaptive optics near-IR imaging of NGC 2992 - unveiling core structures related to radio figure-8 loops
Abstract
We present near-IR adaptive optics, VLA radio and HST optical imaging of the nearby Seyfert galaxy NGC 2992. Spiral structure and an extension to the West are traced down to the core region at the limiting resolution of our near-IR images. A faint, diffuse loop of near-IR and radio emission is also observed to the north, embedded within the prominent 2″radio loop previously observed to the northwest. Near-IR color maps, and CO narrowband imaging, are then used to identify which regions may not be purely reddened stellar populations. Our new data provide evidence that the VLA radio-loop morphology in the shape of a figure-8 represents two components superimposed: 1) outflow bubbles out of the plane of the disk, coincident with the extended emission line region (EELR); 2) star formation along the spiral arm within the galaxy disk and through the dust lane. The near-IR continuum emission associated with the outflowing radio bubbles suggest that the radio loops are driven by the active nucleus.
keywords:
galaxies: active – galaxies: starburst – galaxies: formation – galaxies: individual: NGC29921 Introduction
NGC 2992 is an Sa galaxy seen almost edge-on with a nearby, likely interacting, companion (NGC 2993). It possesses an active Seyfert 1.9 nucleus. A large and prominent dust lane runs through the center of the galaxy roughly north to south, splitting the nuclear region in two. Ulvestad and Wilson (1984) found that the radio structure of the nucleus of NGC 2992 has the shape of a “figure-8”, with a maximum extent of about 550 pc, oriented out of the plane of the galactic disk (assumed distance 37.3 Mpc using the recession velocity relative to the Local Group of 1864 km s-1 (Ward et al. 1980) and km s-1Mpc-1, angular scale of 182 pc / 1″ ). Most of of the 6cm radio emission from the center of the galaxy arises in the loops of the figure-8 rather than in the nucleus.
There are several favored models for such figure-8 radio emission. The loops could result from expanding gas bubbles which are seen preferentially as limb-brightened loops (Wehrle & Morris 1988). Such outflows may be associated with the AGN core. The continually diminishing X-ray emission has been interpreted as a dying active nucleus (Bassani et al. 1998), possibly because fuel is no longer being channeled down to an accretion disk region. However, this would not likely affect the appearance of the surrounding region at our resolution of 20 pc since even at outflow speeds close to the timescale is 50 years.
Alternatively starburst driven superwinds could result in expanding gas bubbles leading to such emission (Heckman et al. 1990). Extended X-ray and H emission (Colbert et al. 1996, Colbert et al. 1998) perpendicular to the plane of the galaxy may be an indication for the superwind. If the superwind were produced by an energetic burst of supernovae in the past, the current radius of the loop would then imply that the SNe explosion occurred over years ago for a typical expansion velocity of 1000 km/s (Koo et al. 1992, Tenorio-Tagle et al. 1998).
A different model proposes toroidal magnetic fields which result in a loop-like emission of synchrotron emission (Wehrle & Morris 1988). Here, strong differential rotation in the galactic nuclear disk builds up the magnetic field having some radial component, until an instability occurs leading to an expanding magnetic arch. The field configuration upon expansion away from the nucleus is then a pair of loops. The synchrotron emission results when particles are accelerated to relativistic energies in the magnetic arches.
We have observed NGC 2992 at high spatial resolution using the Adaptive Optics Bonnette (AOB) on the CFHT. This is part of a larger project to map the cores of nearby Seyfert galaxies in the near-IR with adaptive optics in order to study core morphologies. Our new near-IR imagery of NGC 2992 unveils emission features (dust obscured in optical wavelength HST imaging) which may be related to the VLA radio emission. This discovery allows a consistent model of the radio emission to be formulated, incorporating the larger scale bi-polar morphology observed in H by Allen et al. (1998). In section 2 we outline the observations and reductions. In section 3 we present the results of our multi-wavelength analysis. Finally in section 4, we discuss the implications of the observed morphologies for various models.
2 Observational Details
2.1 CFHT AOB imaging
Observations were obtained using the CFHT in March, 1997 and 1998, with the Adaptive Optics Bonnette (AOB) (Rigaut et al. 1998) feeding the MONICA (1997) and KIR (1998) near-IR cameras (Nadeau et al. 1994). The AOB is based on the curvature wavefront sensing concept (Roddier et al. 1991), and uses a 19 zone bimorph mirror to correct for wavefront distortions. The MONICA detector is a Rockwell NICMOS3 array with 256x256 pixels and 0.034”/pixel sampling. The KIR camera replaced MONICA in early 1998, and uses the Hawaii 1k x 1k pixel array with the same pixel sampling.
The core of this galaxy is sufficiently bright as a guiding source to enable near diffraction limited resolution under favorable natural seeing conditions. AO correction is much more efficient in the near-IR as a result of the dependence of the Fried parameter, , which characterizes the atmospheric coherence length. We obtained an H-band image with MONICA under good observing conditions (seeing FWHM 06 resulting in 015 resolution. The , , - band and narrow-band images obtained with KIR had worse natural seeing (09) and the corrected PSF has a FWHM of 045 at , and , and 060 at . When forming colour maps, images are always smoothed to the worst resolution of the pair of images in question.
As the field size is small (9”x9” for MONICA, 36” x 36” for KIR), blank sky images were taken intermittently between science frames. On-source images were taken in a mosaic of 4 positions, alternately putting the galaxy core in each of the four quadrants of the array to account for bad pixels and image uniformity. Flux and PSF calibrations were performed using the UKIRT standard stars fs13 and fs25. Flat-field images were taken on the dome with the lamps turned on and off to account for the thermal glow of the telescope. Data reduction was performed in the standard way for near-IR imaging: i) bad pixel correction; ii) sky subtraction, using a median-averaged sky estimate; iii) flat-field correction; iv) re-centering and co-addition of the different exposures through cross-correlation techniques.
The continuum image for the vibrational transition (2-0) absorption ( = 2.296m = 200 Å) was estimated by fitting a line through several regions in the , , and images with no apparent dust-lane structure. All images were convolved to 06 resolution before estimating the CO continuum image. This extrapolation was then sampled with a Gaussian of the same width as the narrow filter centered at 2.296m. This flux level was then used to normalize the -band image for subtraction of the image, resulting in a [continuum - ] index within the range typically observed (see for example Davidge & Courteau, 1999 for results on M81 with the same filter used at CFHT). The above result was also checked against the following procedure. The outer regions of the image have typical early-spiral bulge colours (e.g. Glass & Moorwood 1985) and are likely to be relatively free of dust emission. By matching the -band image in flux to the image near the outer edges of the field, we obtain a zero-point in the [continuum - ] image. These two procedures were found to agree within 15%.
Obtaining an accurate measure of the resulting PSF of the image with AO is problematic, since the atmospheric conditions are continually changing, and a stellar image taken before or after the science exposure will likely not resemble the PSF of the science frame. An accurate PSF must be temporally and spatially coincident with the actual region of interest in the field, since the PSF degrades away from the guiding source. Even when there is a star within the relatively small field of view of the near-IR cameras used with AOB, the PSF is frequently quite different from the core of the active galaxy (guiding source). Attempts have been made to model the off-axis PSF in these cases with some success (Hutchings et al. 1998).
A technique has been developed to reconstruct a model PSF for the nuclear region of the galaxy using the adaptive optics modal control loop information obtained during the actual observations (Veran et al. 1998a,1998b). For the core brightness as seen by the wavefront sensor (V=16.5) in the MONICA H-band image, simulations have shown that the reconstructed PSF should match the true PSF to an accuracy of approximately 10% (Veran et al. 1998). The factors degrading such a reconstruction are mostly the faintness and extension of the particular galaxy core, and superior results are obtained with brighter, point-like galaxy nuclei (or stars). The error in our reconstruction is mostly in the Strehl ratio and outer artifacts with the FWHM being very close to that of the actual PSF.
The image is then deconvolved to the point at which the LUCY algorithm (Lucy 1984) converges (25 iterations), using the model PSF as input. The LUCY deconvolution can create ringing artifacts around bright unresolved galaxy cores. However the core of NGC 2992 is extended while many of the structures surrounding the core are point-like. This is ideal for LUCY since the core region consists essentially of point sources superposed over a varying background. The algorithm was found to provide a believable deconvolution, with no new features appearing which were not in the original image at some level. The main benefit is the reduction of sidelobes, and the seeing pedestal present with achieved Strehl ratios in the range 20-30%. The estimated final resolution in the image is 012 corresponding to 4 pixels.
2.2 Existing HST and UKIRT data
An archive HST F606W filter image was obtained with the WFPC2 camera in 1994 as part of a snapshot survey of nearby active galaxies (Malkan 1998). The pixel scale with the PC camera is 0044 per pixel. In order to compare this directly with our AOB image, we have interpolated and rebinned the image after rotating it to the proper orientation. The prescription to calibrate the HST F606W image to Johnson V-band as outlined in Malkan et al. (1998) is used for NGC 2992.
NGC 2992 was also observed at the United Kingdom InfraRed Telescope (UKIRT) in the near-IR bands J, H and K. The plate scale is 0.29″/pixel. These data were originally presented by Alonso-Herrero et al. (1998).
2.3 VLA radio maps
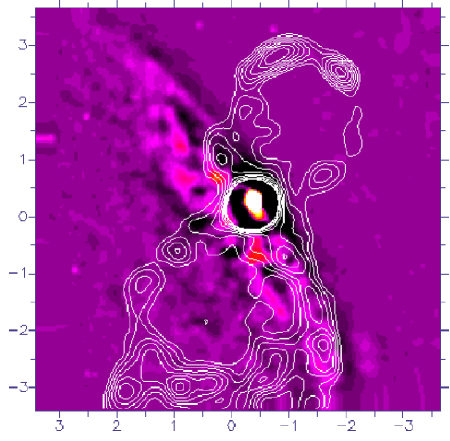
A VLA image at 6 cm (5 GHz) was obtained in 1987 by A. Wehrle and is reproduced here with her permission (figure 1, right panel).
An image at 8.4GHz (3.57cm) was also obtained from the VLA archive (courtesy of H. Falcke) in C-configuration which resolves more clearly into knot-like structures (figure 1, left panel).
3 Results
The morphology in the central region of NGC 2992 is a complicated superposition of various components, appearing most prominently in different wavelength regimes. An irregular-shaped patchy region dominates much of the western portion of the shorter wavelength images (especially -band – see figure 2 and subsequent images). The fact that this region appears clearly as a deficit in the R-band image, and takes on a patchy morphology is strong evidence for dust obscuration as the source of the colour gradient. The region is therefore most pronounced in long baseline colour maps, such as R-H, with longer wavelengths being least affected by dust. Larger scale images of the galaxy reveal this feature as a dust-lane structure bisecting the core region (see Wehrle & Morris 1988). In Table 1, we list the various structural components in the core along with the figure which best highlights the feature.
| Feature | property | flux | size | best figure | location |
|---|---|---|---|---|---|
| resolved core | SF+AGN | H=13 | 0.3″ | All | |
| knots near core | SF | H=16 | unresolved | raw, smooth (4.2,4.5) | S of nucleus |
| radio loops | 2″ | 8.4&5 GHz (4.1) | NW,SE | ||
| near-IR extension | nonstellar colours | H=15.3 | 1″ | model subtract (4) | NW |
| inner loop | SF | 1″ | R-H (4.3) | N | |
| diffuse radio | SF | 1″ | radio (4.1) | N | |
| spiral arms | knots | 3+″ | model& smooth (4.4,4.5) | NE-SW | |
| assoc. radio? | 3+″ | radio (4.1) | NE-SW |
3.1 The Core Region
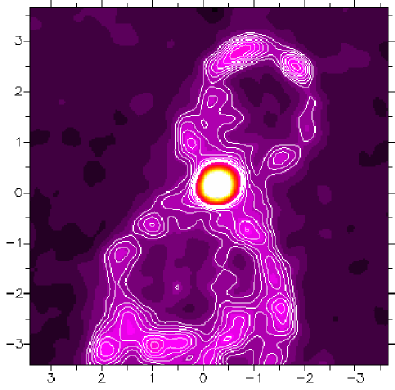
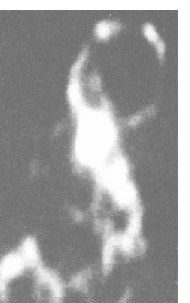
In figure 2, we present the near diffraction limited H-band image of the central 7″ of NGC 2992. The HST F606W (covering V+R band - hereafter called R) image is also depicted. The galaxy core is resolved in both the H and R filters, with a FWHM 026 corresponding to 47.2 pc. For the mediocre correction in the KIR J and K images the core is essentially unresolved with FWHM 045 () and 06 (). It is important to understand what percentage of the nuclear light may be emitted by an unresolved (AGN) component. We estimate the contribution to the extended galaxy core from the unresolved H-band component. Our model-constructed PSF (see section 2 and Veran et al. 1998a) is a reasonable estimate of the true PSF for the diffraction limited H-band image. We first produce a surface brightness profile of the galaxy using the IRAF task , and another one for the PSF. The PSF is then scaled to match the peak of the galaxy brightness. Both profiles are integrated out to a radial distance of 1″ with the result that the an unresolved component contributes at most 38% at H in a 0.2″ diameter aperture, and 17% in a 0.5″ aperture.
In Table 2 we present aperture photometry of the core region. The V-H colour of the nucleus (V-H = 3.4) is typical for a reddened stellar population (Glass & Moorwood 1985). Note that the deconvolved magnitudes agree with the raw data at an aperture radius of 3″ . This would be as expected given that the deconvolution process restores flux to the central spike from the surrounding pedestal. This is encouraging despite the claims that deconvolved images may not be appropriate for photometry since the non-linear algorithm does not necessarily conserve flux (Magain et al. 1998). The disagreement with Alonso-Herrero et al. (1998) for the H-band apertures less than 3″ diameter is likely a result of the improved resolution of our image coupled with our absolute errors of 4% for the RMS of calibration star measurements throughout the observing run.
| Aperture | H(deconvolved) | H(raw) | V(HST) |
|---|---|---|---|
| Diameter | |||
| 05 | 14.08 | 14.50 | 17.46 |
| 10 | 12.84 | 13.16 | 16.71 |
| 15 | 12.29 | 12.50a | 16.22 |
| 20 | 11.96 | 12.08 | 16.17 |
| 30 | 11.56 | 11.57b | 16.14 |
a H = 12.57 from Alonso-Herrero et al. 1998
b magnitudes agree past the 3rd Airy ring
The radio core spectrum is flat to within 5% measured from our 8.4 GHz VLA image, in conjunction with archive 5 GHz and 1.5 GHz VLA measurements (mean of ) Wehrle & Morris 1988, Ulvestad et al. 1984. This is indicative of synchrotron emission arising in the AGN core dominating over any possible synchrotron emission associated with supernovae at these wavelengths (Robson 1996).
Examination of the cores in both optical and near-IR images (figures 2, 4 and 5) reveals a bright point-like knot to the south 110 pc (0.6″) from the nucleus of the galaxy. A second knot to the southwest appears in the near-IR only. An [R-H] colour map is formed by first convolving the HST image with a Gaussian of width 012 to match the AOB resolution. The colour map (figure 3) reveals the southwestern knot is almost one magnitude redder in R-H than the southern knot, likely as a result of dust. The SW knot is completely obscured in the HST image. We find the colours in these regions (V-H = 3.6 to 4.2) are consistent with reddened stellar populations.
We perform aperture photometry on these knots in H-band find apparent magnitudes between 16.0 and 16.5 at H depending on aperture size used (the aperture measurements have relatively large error due to their proximity and overlap with the central AGN core). At the distance of NGC 2992, the absolute magnitudes lie between and which are comparable to the luminosities of stellar clusters detected in the interacting galaxy Arp299, which have an average H-band absolute magnitude of (Lai et al. 1998, Alonso-Herrero et al. 1998). Arp220 (Scoville et al. 1998) also has compact stellar clusters of similar luminosities at 1.6m (H-band). In the latter work, merger remnants have been suggested as an explanation for such bright knots near the galaxy core (% of the AGN peak for NGC 2992).
3.2 Spiral Structure
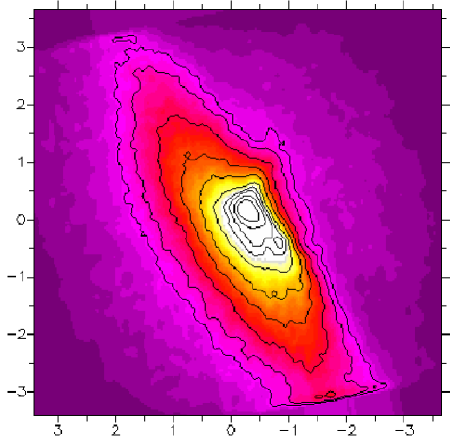
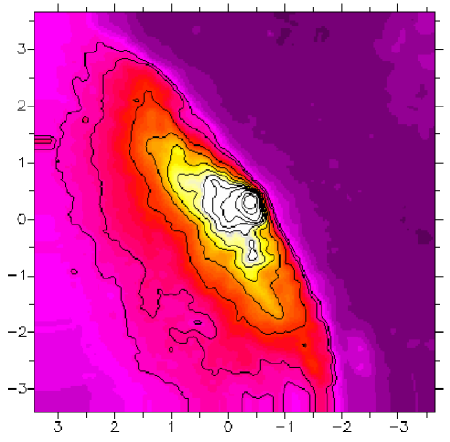
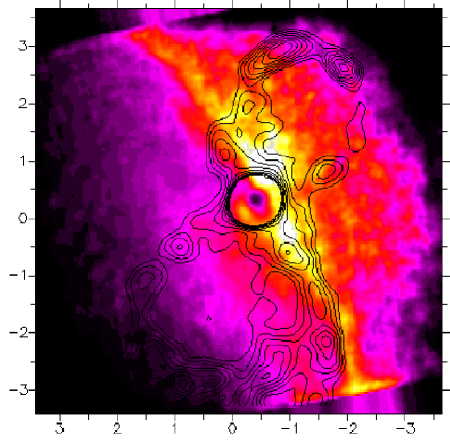
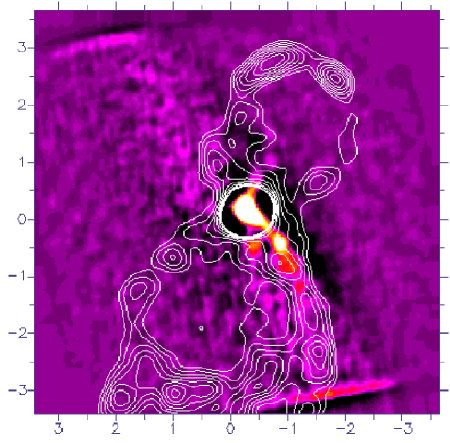
The H- and R-band images (figure 2) show elongated isophotes to the southwest along the galaxy disk, and extending east from the nucleus. In the R-band case the galaxy morphology is much more distorted due to the effects of dust. These extensions and distortions in the isophotes suggest structure underlying the elliptical symmetry of the disk within the central regions of galaxy. We subtract a model image of the galaxy for both a large-scale H-band image (60″ 60″) and the AOB H-band image. The model is built from either elliptical fitted isophotes (figure 4), or a running median filter image of FWHM twice the resolution (figure 5). The elliptical isophote model has the advantage of highlighting structures deviating substantially from elliptical symmetry, while the median filtering tends to bring out fainter point-like structures. The profile in ellipticity () and position angle () of the isophotal model shows that this region has a substantial twist in both and . In figure 4 (upper panel), the model subtracted large-scale image displays what appears to be a spiral structure along the disk, as well as a 3″ extension to the west, also noted in Alonso-Herrero et al. (1998). Our new high resolution images show that both the spiral structure and western extension can be traced down to the very core. This latter extension will be taken up in the next section.
The image of the larger-scale galaxy shows a break in the spiral structures at 7″ radius. This may indicate nested structures which are kinematically distinct, as in the multi-level spiral arm structure observed with adaptive optics in NGC 5248 (Laine et al. 1998). Indeed, the knotty morphology of the spiral structures seen in the AOB and HST images of NGC 2992 are suggestive of star formation in spiral arms. The high inclination of NGC 2992 makes deprojection unreliable and it is difficult to discern how these larger- and smaller-scale spiral structures relate. By the same measure, it is also difficult to know whether the isophotal twists in the core may be due to a bar, a triaxial bulge seen in projection, or simply the effect of the spiral arms (Friedli et al. 1996).
In figures 4 and 5, the 8.4 GHz radio contours are overlayed on the model-subtracted images. There is clearly some radio emission coincident with the southern spiral arm, which breaks up into a similar knotty morphology to the H-band model-subtracted image. Note especially the strong near-IR peak at the southern tip of the spiral arm has an associated peak in the radio, 3″ south and 2″ west of the nucleus. We find the radio spectrum to be steeper along the spiral arm to the south than in the core, possibly indicative of star formation.
The prominent southern knots near the core, outlined in the previous section, clearly lie along the southern spiral arm. By comparing the brightest knots within the spiral arms in the optical and near-IR images, it appears that the nuclei of the galaxy in H- and R-bands, determined by centroiding on the cores, do not line up precisely. The knots in the southern spiral arm, revealed in the model subtracted images, have similar geometric configurations in the two filters (H and R), but when these are superposed, there is a an (x,y) offset of (03, 015) between the nuclei corresponding to a distance of 70 pc. A true offset is possible due to dust obscuration and/or extended unresolved starbursts (see for instance NGC 1068 (Alloin et al. 1998 for a similar case). Given the much more distorted nuclear region in the HST R-band image compared to the H-band, such a scenario is plausible. However, the spiral arm morphology may be slightly different in the two wavelengths, due to the effects of both dust and unresolved, blended structures. The difficulties in matching structures with slightly different morphologies in the outer galaxy leads us to register the images by centroiding on the galaxy nucleus.
3.3 Figure-8 Loops
There is little sign of optical or near-IR counterparts to the radio loops out past the disk of the galaxy, even at K-band where the ability to see through the dust lane is greatest. However, as noted above, there is an extended feature to the northwest, observed as extended contours in the near-IR (figure 2) and as a prominent feature in the model subtracted near-IR images (figure 4), extending 1.5″ before becoming more diffuse and mixing with the stellar emission on the western side of the dust-lane. In the optical HST image (figures 2b, 5b), there is no sign of this extended feature, likely due to the dust lane obscuration. This extension aligns with the mouth of the northern radio loop and appears to continue outwards into the loop, which is verified in the coarser resolution UKIRT image where the S/N allows tracing the feature out further. This indicates that the source of the radio loop may be connected to this feature.
Figure 3 shows that the extended feature is the reddest region in the central 70 of the galaxy with an R-H colour of 4.5. The lower resolution KIR images in J,H,K show that the colours in this region clearly stand out from the surrounding disk colours, possibly as non-stellar (in a 1″ aperture, J-H=0.5, H-K=1.0). These colours may be related to a highly reddened () burst of stars, possibly with a nebular component. However they are also consistent with a reddened continuum power-law emission (Glass & Moorwood 1985).
Artifacts associated with the AO correction have been shown to produce extensions to the PSF when guiding on extended objects such as as Seyfert nuclei (Chapman et al. 1998). Although caution must therefore be taken in associating such a structure with a physical interpretation, we have compared our AOB H-band image with an HST NICMOS K-band image, and found the same extended isophotes to the west of the core.
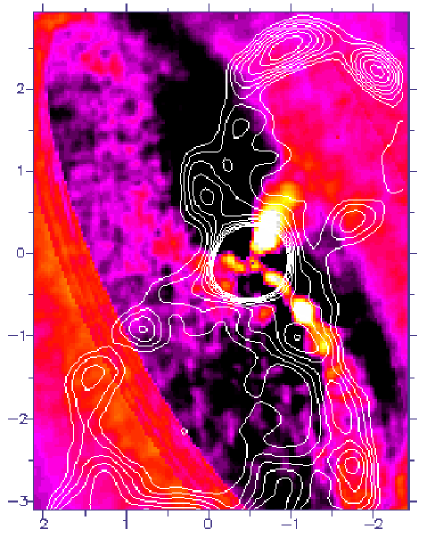
3.4 Diffuse Inner Loop
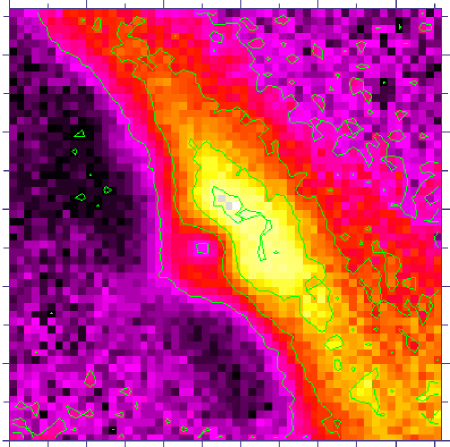
The R-H map (figure 3) shows extended red emission which takes on a loop-like morphology extending north of the nucleus from the 1″ to the 2″ declination offsets, an enhancement in H rather than a deficit in R. It does not appear to be associated with the spiral arm further to the east. In the median filtered H-band image (figure 5), it is also possible to discern knotty features in a loop-like morphology, however the emission lies deep within the region taken to be a dust-lane based on the obscuration of the HST optical imagery. No counterpart is seen in the model subtracted R-band (figure 5).
The 8.4 GHz radio contours superposed over the above figures (3 & 5) reveal a similar loop-like diffuse emission embedded within the larger, well defined radio loop. The spectrum (from 5GHz/8.4GHz) is steeper here than in the core, consistent with star forming regions. Buried star formation regions have been identified in the dust lane crossing the nuclear region of Centaurus A (Schreier et al. 1996,1998), using HST-NICMOS images in H-band. The J,H,K colours in this region of NGC 2992 however are difficult to interpret with the dust absorption gradient across the dust lane. It is not clear that the structure has a true loop morphology, and may be simply a result of the way the dust lane cuts through the core region. However, the coincidence of the radio emission suggests that the near-IR excess may represent more than the artifact of dust absorption.
3.5 The CO map

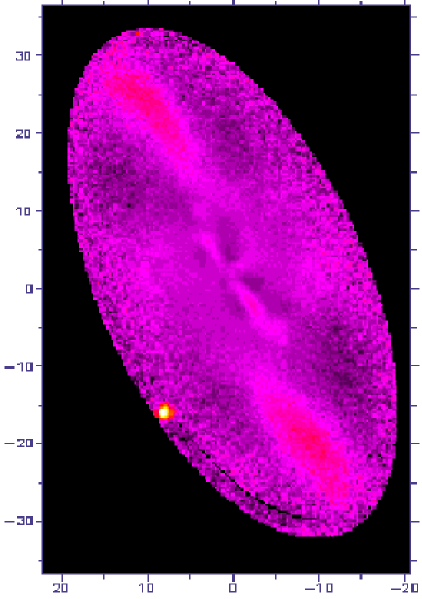
The radial distribution of the CO index, (continuum – CO), is shown in figure 6, where the plotted values are azimuthal averages in 0.1″ bins. Although the CO(2-0) filter used corresponds to the standard photometric index (2.296m center, 200 Åwidth) (Doyon et al. 1994), the subtracted continuum was extrapolated from the broad band colours (see section 2). There is then likely a systematic offset in absolute photometry, and we use caution in interpreting the CO magnitudes.
When 1.5″ the CO index strengthens implying much more CO absorption within the central 3″ . The CO index depends on both the metallicity and the age of the stellar population (giants versus supergiants), and has been found to be difficult to model. If we assume that the metallicity is constant within the center, then the variation may be an age effect. In general, the CO index increases as the starburst ages (Vanzi, Alonso-Herrero & Rieke 1998, Doyon et al. 1994). The NGC 2992 CO profile suggests that a somewhat younger population is present in a ring around the galaxy center, while the stellar population in the very core would be slightly older than the surroundings. Given the rather poor resolution in these images (0.45″), we are unable to discern at what level the stellar population contributes within the resolved 50pc core, evident in the HST R- and MONICA H-band images. However, it is clear that hot dust ( 1000 K) emission does not contribute significantly to the core region. The power-law tail of a strong hot dust continuum contribution at K-band would swamp the CO absorption signature, leading to a weakening CO index (less CO absorption). At larger distances the CO index shows a slight radial gradient, but this is not significant given the uncertainties in the background.
3.6 Characterizing the Extinction
The effects of dust absorption become noticeably less with increasing wavelength in our images of NGC 2992. The K-band image has the most symmetrical appearance, with emission from the galaxy disk visible furthest into the dust-lane. By referencing fiducial colours of expected stellar populations to the actual observed colours in NGC 2992, we can estimate the extinction due to dust. The H-K colour map is in general good for characterizing the extinction because it probes deeper within the dusty regions. However it has the problem that K-band may be contaminated by hot dust (1000 K) emission, resulting in possible overestimates of the extinction. Our CO-narrowband imaging confirms previous speculation from ground-based J-K and K-L colours (Alonso-Herrero et al. 1998) that hot dust is unlikely to contribute significantly.
We assume that the colour of a typical early-type bulge stellar population is (Glass & Moorwood 1985), and that redder colours imply some degree of obscuration. Taking into account that the differential extinction between H and K is and (Rieke et al. 1985), we find
where is the flux ratio corresponding to . Thus in magnitudes.
Such an analysis is only true for extinction to the stars. Other emission processes (power law, emission line gas, etc.) will skew the results. The J-H and H-K colours show that there are two regions which can likely not be explained simply by reddened stellar colours. The first is within the dust lane, along the knotty spiral structure to the south and to the north along the diffuse loop described in section 3.4. The colours here tend to be bluer in both J-H and H-K, possibly indicative of nebular emission. The second is the extended region to the west of the nucleus where the colours are far from the locus of normal stellar colors, and different from both the disk/bulge to the east and the rest of the colours within the dust lane.
The extinction map (figure 7) shows that if the central peak of emission is in fact due mainly to a compact stellar core, then there is an optical extinction of A(V)4 magnitudes. The J-H/H-K colours of the nucleus are consistent with a reddened supergiant population. Taken at face value, the extinction map contours indicate A(V) extinction from 2.6 to 8.6 magnitudes with 2 magnitude intervals, although non-stellar emission likely over-redden some of the circumnuclear regions as discussed above. Using the J-H map results in an extinction estimate which is lower, possibly as a result of the larger optical depth at shorter wavelengths.
4 Discussion
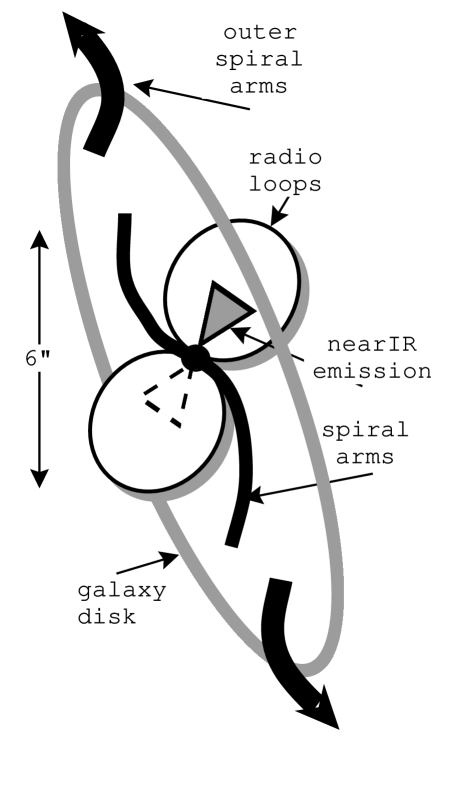
We have combined the various structures observed in the different wavelength regimes and depicted them schematically in figure 8.
The radio loops lack any optical or near-IR counterparts except along the galaxy disk axis. The bipolar outflows along the spin axis of the galaxy observed at larger scales in the optical (Allen et al. 1998) align along the same axis defined by the radio loops. These facts suggest the actual figure-8 loops likely lie out of the galactic disk plane. However, the strong radio contours, emanating from the nucleus to the southwest, lie along the buried spiral arm within the disk. Also, the red R-H loop to the north appears to be associated with the diffuse radio emission embedded within the larger radio loop.
Our hypothesis is then that the radio morphology consists of two components superimposed:
1) the loops out of the plane of the disk.
2) a component in the disk associated with the southern spiral arm,
and a diffuse loop to the north. Starburst SNe remnants are the likely source
of these radio components.
The appearance of the radio figure-8 becomes more symmetrical if the galactic disk components (point 2 above) are subtracted, which supports such a superposition scenario.
The assumption of trailing large-scale spiral arms, in addition to the prominent dust lane likely lying in front of the bulge, imply the NW edge of the galaxy disk is closer to us. This scenario places the southern portion of the Extended Emission Line Region (EELR) closer to us, with associated outflowing material (Allen et al. 1998). The southern radio loop would then also be closer to us, with the northern loop lying partially behind the dust lane. However, the larger-scale spiral arms extending radially out past 30″ appear to wind in the opposite orientation to the inner spiral observed in our high resolution imagery. This either forces the inner spiral arms to be leading, or else they are trailing in counter-rotation, with the inner region kinematically distinct from the outer galaxy. The case is not clear from the velocity fields presented in Allen et al. (1998), which have low spatial resolution coupled with a complicated superposition of rotation and outflow components.
The near-IR extended emission feature to the northwest gives the appearance of expanding into the northern radio loop, and the two emission features may be associated. The morphology and the rather extreme near-IR colours suggest that an AGN driven jet, possibly with some continuum component, could be directed into the radio loop. Hot dust present in an outflow is not ruled out for this feature either. This sort of near-IR “jet” may exist towards the southern radio loop as well at a lower level.
4.1 Interpretation
As noted in the introduction, there have been several models put forward for such figure-8 radio emission. The most convincing in light of our new near-IR imaging is that the figure-8 loops result from expanding gas bubbles which are seen preferentially as limb-brightened loops (Wehrle and Morris 1988). The northern loop may be related to the near-IR extended emission feature to the northwest. Further evidence for the outflow picture exists in the form of soft X-ray emission extended perpendicular to the disk of the galaxy Colbert et al. 1998), and H imagery clearly showing the location of an extended emission line region (EELR) (Colbert et al. 1996). These authors discuss two possible explanations for the extended X-ray emission: 1) an AGN driven hot plasma, 2) a superwind from a compact starburst.
A galactic-scale superwind can be generated by either a compact starburst in the galaxy core, or an AGN driven outflow which thermalizes the ISM at some distance from the core (Colbert et al. 1996). In both cases the superwind would blow preferentially out of the galaxy plane where the pressure is lowest, such as observed in NGC253 (Unger et al. 1987). With the resolved galaxy core in our images, it is not clear to what extent dust absorption, hot dust emission, scattered AGN light, or a compact stellar cluster contribute to the extended emission. The colours appear most consistent with reddened stellar light. Thus either picture could be consistent with our data since a stellar cluster and AGN (optical emission lines, flat radio spectrum) are likely contributing to core emission processes. However, the larger scale EELR need not be aligned with the 2″ diameter radio loops in the case of the AGN driven source. The orientation of the EELR observed at larger scales (Allen et al. 1998) is in fact roughly aligned with the radio loops. For superwind models, the anisotropic EELR, seen in [OIII] and H, is likely to be associated with the outflow regions. However, the superwind in itself does not yield a mechanism to produce continuum emission (Allen et al. 1998), thus our near-IR data may rule out this latter model.
If the near-IR “jet” is not actually related to the radio loops, the superwind model is still a plausible source of the loop emission. The CO index provides evidence for a substantial population gradient in the core. We consider the case where the radio loops are due to a energetic burst of supernovae in the past. The luminosity of the stellar cluster must be at least three times that of the bubble so the shock can reach a galactic scale height (Koo et al. 1992, Tenorio-Tagle et al. 1998) The stellar cluster luminosity is estimated from the H-band image. We determine the size of the “hypothetical” stellar cluster to be 0.5″ with an absolute H-magnitude of , where the AGN contribution is unknown and may be almost zero if the supermassive black hole is no longer being fueled, as described in the introduction (Bassini et al. 1998). The model PSF (section 3.1) scaled to the peak of the extended core revealed that an unresolved AGN component could contribute at most 37% to the emission within a 0.2″ diameter aperture.
The second model outlined in the introduction, with the toroidal magnetic fields causing the emission, is more difficult to explain in light of the near-IR extension and knotty emission along the southern radio loop. The outflow driven bubble model explains the currently available data much more naturally. In addition, a calculation of the magnetic energy in the loops from the 8.4GHz VLA data (Falcke et al. 1997, Werhle et al. 1988), makes it difficult to model consistently in this manner. Other problems with this model (Wehrle et al. 1988, Cameron 1985, Heyvaerts et al. 1987) associated with rotation timescales and the lack of twisting of the radio/near-IR loops, make it even less plausible.
5 Conclusions
We have presented adaptive optics near-IR and radio images of NGC2992 in conjunction with archive HST optical imagery. A spiral structure within the central 6″ and a 1″ extended feature are traced down to the core at the resolution of our images. We speculate that multiple radio components are superposed which contribute to the observed figure-8 morphology in the VLA images: one associated with the spiral structure in the galaxy disk, and another flowing out of the galaxy plane.
IR and optical spectra at high spatial resolution will likely provide the means of determining if the population gradients in the core of NGC 2992 are due to changes in age and/or metallicity. Such spectral imagery will also permit the nature of the extended structures to be explored, shedding light on the possible connection to the radio loops.
Our current hypothesis concerning the radio loops involves an AGN outflow powering the loop rather than a starburst superwind, as any near-IR emission related to the jet would be unlikely in the latter case. NGC 2992 represents yet another example of star formation and AGN components both existing in the galaxy core (Storchi-Bergman et al. 1997). There is no obvious indication in our data of whether there is any connection between the two in evolutionary terms.
ACKNOWLEDGEMENTS
We would like to acknowledge the staff at CFHT and VLA for facilitating these observations. The CADC database was invaluable in obtaining HST images.
References
- [Allen et al. 1999] Allen M.G., Dopita M.A., Tsvetanov Z.I., Sutherland R.S., 1999, ApJ, 511, 686, astroph/9809123
- [Alloin et al. 1998] Alloin D., et al., 1998, proceedings of ESO/OSA: Astronomy with Adaptive Optics, Sonthofen, Germany.
- [Alonso-Herrero et al. 1998] Alonso-Herrero A., Simpson C., Ward M. J., Wilson A. S., 1998, ApJ, 495, 196
- [Alonso-Herrero et al. 1999] Alonso-Herrero A., Rieke M.J., Rieke G.H., & Scoville N.Z., 1999, ApJ, submitted
- [Bassani et al. 1998] Bassani, L., Dadina, M., Maiolino, R., Salvati, Risalti, G., Della Ceca, R., Matt, G., Zamorani, G., 1998, submitted to A&A, astro-ph/9811074
- [Cameron 1985] Cameron A.G.W. 1985, ApJL, 299, L83
- [] Chapman S.C., Morris S.L., Walker G.A.H.W. 1998, Proceedings of ESO/OSA: Astronomy with Adaptive Optics, Sonthofen, Germany.
- [Colbert et al. 1998] Colbert et al. 1998, ApJ, 496, 786
- [Colbert et al. 1996] Colbert et al. 1996, ApJS, 105, 75
- [] Davidge T. and Courteau S., 1999, AJ, 117, 2781
- [] Doyon R., Wells M., Wright G.S., Joseph R.D., Nadeau D., James P., 1994, ApJ, 421, 101.
- [Falcke et al. 1997] Falcke H., 1997, AJ, 95, 1689
- [] Friedli D., Wozniak H., Rieke M., Martinet L., Bratschi P., 1996, A&A Supl, 118, 461
- [] Glass and Moorwood, 1985, 214, 429.
- [Heckman et al 1990] Heckman, T. M., Armus, L., Miley, G. K. 1990, ApJS, 74, 833,
- [] Heyvaerts J., Pudritz R.F. and Norman C., 1987, In The Galactic Center. Proceedings of a symposium in Honor of C.H.Townes , edited by D.C. Backer (AIP, New York).
- [] Hutchings J., Morris S.L., Crampton D., Steinbring E., 1998, PASP, 110, 374
- [Knapen et al. 1997] Knapen J., Laine S., Yates J., Robinson A., Richards A., Doyon R., Nadeau D., 1997, ApJ, 490L, 29
- [Koo & McKee 1992] Koo & McKee, 1992, ApJ, 388, 93
- [Lai et al. 1998a] Lai O., Rouan D., Rigaut F., Arsenault R., Gendron E., 1998, A&A, 334, 783.
- [Lai et al. 1998b] Lai O., Rouan D., Rigaut F., Arsenault R., Gendron E., 1998, A&A, 334, 783.
- [Laine et al. 1998] Laine S., Knapen J.H., Perez-Ramirez D. Doyon R., Nadeau D., 1998, MNRAS, 302, 33L.
- [Lucy 1984] Lucy L.B., 1974, AJ, 79, 745.
- [] Magain P., Courbin F., Sohy S., 1998, SpJ, 494, 472.
- [] Malkan M., Gorjian V., Tam R., 1998, ApJS, 117, 25.
- [Nadeau et al. 1994] Nadeau D., Murphy D.C., Doyon R., Rowlands N., 1994, PASP 106, 909
- [Rieke and Lebofsky 1985] Rieke G.H. and Lebofsky M.J., 1985, ApJ, 288, 618
- [] Rigaut et al., 1998, PASP, 110, 152.
- [] Robson I., Active Galactic Nuclei, Wiley press, West Sussex, England.
- [Roddier et al. 1991] Roddier F.J., Graves J.E., McKenna D. , Northcott M.J., 1991, SPIE, 154, 248.
- [Rouan et al. 1998] Rouan D., Rigaut F., Alloin D., Doyon R., Lai O., Crampton D., Gendron E., Arsenault R., 1998, A&A, 339, 687.
- [Scoville et al. 1998] Scoville N., Evans A., Dinshaw N., Thompson R., Rieke M., Schneider G., Low F., Hines D., Stobie B., Becklin E., Epps H., 1998, ApJL in press, astro-ph/9801006
- [] Schreier E., Capetti A., Macchetto D., Sparks W., Ford H., 1996, ApJ, 459, 535.
- [] Schreier E., Marconi A., Axon D., Caon N., Macchetto D., Capetti A., Hough H., Young S., Packham C., 1998, ApJ, 499L, 143
- [Tenorio-Tagle et al. 1998] Tenorio-Tagle G., Munoz-Tunon, C., 1998, MNRAS, 293, 299
- [Ulvestad & Wilson 1984] Ulvestad J. S., Wilson A., 1984, ApJ, 285, 439.
- [Unger et al. 1987] Unger S. W., Pedlar A., Axon D. J., Whittle M., Meurs E. J. A., Ward M. J., 1987 MNRAS, 228, 671
- [] Vanzi L., Alonso-Herrero A., Rieke G.H., 1998, ApJ, 504, 93.
- [Veran et al. 1998a] Veran J.P., Rigaut F., Maitre H., Rouan D., 1998, J.Opt.Soc. of America, In Press.
- [Veran et al. 1998b] Veran J.P., Rigaut F., Maitre H., 1998, SPIE, Optical Science, Engineering and Instrumentation, San Diego.
- [Ward et al. 1980] Ward M., Penston, M., Blades, J., Turtle, A. (1980), MNRAS 193, 563.
- [Wehrle & Morris 1988] Wehrle A. E., Morris M., 1988, AJ, 95, 1689.