Ionisation, shocks and evolution of the emission line gas of distant 3CR radio galaxies
Abstract
An analysis of the kinematics and ionisation state of the emission line gas of a sample of 14 3CR radio galaxies with redshifts is carried out. The data used for these studies, deep long–slit spectroscopic exposures from the William Herschel Telescope, are presented in an accompanying paper. It is found that radio sources with small linear sizes ( kpc) have lower ionisation states, higher emission line fluxes and broader line widths than larger radio sources. An analysis of the low redshift sample of Baum et al. demonstrates that radio galaxies at low redshift show similar evolution in their velocity structures and emission line ratios from small to large radio sources.
The emission line ratios of small radio sources are in agreement with theoretical shock ionisation predictions and their velocity profiles are distorted. Together with the other emission line properties this indicates that shocks associated with the radio source dominate the kinematics and ionisation of the emission line gas during the period that the radio source is expanding through the interstellar medium. Gas clouds are accelerated by the shocks, giving rise to the irregular velocity structures observed, whilst shock compression of emission line gas clouds and the presence of the ionising photons associated with the shocks combine to lower the ionisation state of the emission line gas. By contrast, in larger sources the shock fronts have passed well beyond the emission line regions; the emission line gas of these larger radio sources has much more settled kinematical properties, indicative of rotation, and emission line ratios consistent with the dominant source of ionising photons being the active galactic nucleus.
This strong evolution with radio size of the emission line gas properties of powerful radio galaxies mirrors the radio size evolution seen in the nature of the optical–ultraviolet continuum emission of these sources, implying that the continuum alignment effect is likely to be related to the same radio source shocks.
keywords:
Galaxies: active — Galaxies: interstellar medium — Radio continuum: galaxies — Shock waves1 Introduction
Powerful high redshift () radio galaxies display a number of remarkable characteristics. Their near infrared emission shows them to be amongst the most massive galaxies known in the early Universe and to have radial light profiles following de Vaucouleurs law, indicating that they are fully formed giant elliptical galaxies [Best et al. 1998]. At optical and rest–frame ultraviolet (UV) wavelengths, however, the galaxies have very irregular morphologies, frequently showing a strong excess of emission aligned along the axis of the radio source [McCarthy et al. 1987, Chambers et al. 1987]. Their emission line properties are equally spectacular; luminous emission line regions surround the radio galaxies, extending for several tens of kiloparsecs or more (e.g. McCarthy et al. 1995), with velocity shears up to a few hundred km s -1 and line widths as high as 1500 km s -1 (e.g. McCarthy et al. 1996). The emission line regions are characterised by high ionisation spectra including strong emission from species such as NeV and CIV. The origin of this luminous emission line gas, its kinematics and ionisation, and their connection to the radio source phenomenon remain important astrophysical questions.
Over the past few years we have been carrying out a detailed investigation of a sample of 28 radio galaxies with redshifts from the revised 3CR catalogue [Laing et al. 1983], using optical imaging with the Hubble Space Telescope (HST), high resolution radio interferometry with the Very Large Array (VLA) and near infrared imaging with UKIRT [Longair et al. 1995, Best et al. 1996, Best et al. 1997, Best et al. 1998]. Here, and in an accompanying paper (Best et al. 1999; hereafter Paper 1), results are presented from a deep spectroscopic campaign using the William Herschel Telescope (WHT) on 14 of these radio galaxies, to study in detail the emission line gas. The reader is referred to Paper 1 for details of the sample selection, data reduction, the reduced one dimensional spectra and tabulated line fluxes, and the distributions of the intensity, velocity and line width of the emission line gas as a function of position along the slit for each galaxy.
The current paper is concerned with investigating the galaxy to galaxy variations in the ionisation and kinematics of the emission line gas, and comparing these variations with the radio and optical properties. The layout is as follows. In Section 2 the photoionisation and shock ionisation models are discussed and their predictions are compared with the observed emission line ratios of the galaxies on an emission line diagnostic diagram. The kinematics of the gas are studied in Section 3. In Section 4 the results are compared with those of a low redshift sample of galaxies and a scenario is proposed to explain the observed properties of the emission line gas at low and high redshifts. The spectroscopic properties of the distant galaxies are compared to their optical properties, and the implications of these results for the continuum alignment effect are discussed. Conclusions are drawn in Section 5. Throughout the paper, values for the cosmological parameters of and km s-1 Mpc-1 are assumed.
2 The ionisation of the extended emission line regions
Robinson et al. [Robinson et al. 1987] showed that for most low redshift () radio galaxies the emission line spectrum can be explained adequately if it is assumed that the gas is photoionised by a power–law emission source such as that provided by an active galactic nucleus (AGN). Baum et al. [Baum et al. 1992] obtained similar results for a sample of radio galaxies out to redshift 0.2, although they noted that photoionisation models could not reproduce [NII] 6584 /H ratios as high as were observed for some galaxies; they suggested that localised sources of heating and ionisation, for example shocks or the UV continuum of surrounding hot gas (e.g. Heckman et al. 1989), may play a role in some radio sources. McCarthy [McCarthy 1993] constructed a composite spectrum from a large sample of radio galaxies with redshifts ; he showed that the emission line spectra of these more distant (more radio powerful) sources are also consistent with being photoionised, but as Villar–Martín et al. [Villar–Martín et al. 1997] argued, this composite spectrum is dominated by the few most highly ionised galaxies and so this result does not necessarily apply to the population as a whole. This photoionisation mechanism is in complete agreement with the currently popular orientation–based unification schemes of radio galaxies and radio loud quasars (e.g. Barthel 1989) in which all radio galaxies should host a powerful obscured active galactic nucleus, supplying a large flux of anisotropically emitted ionising photons. The presence of such an obscured quasar nucleus is also indicated by the detection of spatially extended polarised emission and broad permitted lines in polarised light, due to scattering of the AGN light by electrons or dust (see Antonucci 1993 for a review).
Photoionisation is not the only story, however. As reviewed by Binette et al. [Binette et al. 1996], simple photoionisation models fail to reproduce some important features of the emission line spectra of the narrow line regions of active galaxies. In particular, the strengths of many high excitation lines (e.g. [NeV] 3426, CIV 1549, and high ionisation Fe lines) are under–predicted by factors as large as 10, the electronic temperatures derived by simple photoionisation models are too low when compared with those inferred from the line ratio [OIII] 4363 / [OIII] 5007, and photoionisation models alone cannot reproduce the large observed scatter in the HeII 4686 / H ratio. Moreover, a significant fraction of radio galaxies show indications of interactions between the radio jets and the surrounding emission line gas, with the radio source shocks determining the morphology and kinematics of the gas. Detailed studies of individual sources (e.g. PKS 225041, , Clark et al. 1997, Villar–Martín et al. 1999; 3C171, , Clark et al. 1998) have shown that in some regions of the source the shocks can also dominate the ionisation; for example, minima in the ionisation state are observed coincident with the radio hotspots, and an anticorrelation is found between the ionisation state of the extended gas and its (jet shock broadened) line width.
At high redshifts, , interactions between the radio jets and the gas are readily apparent from the kinematics of the ionised gas (see Section 3). What has not been clear, however, is to what extent the shocks play a role in the ionisation of these high redshift sources.
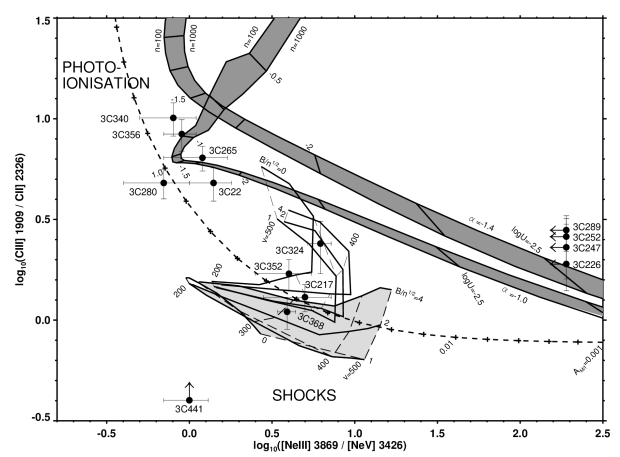
2.1 The CIII] 2326 / CII] 1909 vs [NeIII] 3869 / [NeV] 3426 diagram
Line ratio diagnostic diagrams, pioneered by Baldwin et al. [Baldwin et al. 1981], provide a powerful tool for investigating the ionisation mechanism of emission line gas. They have been widely used to distinguish the extended emission line regions of active nuclei from HII regions and planetary nebulae, and in recent years also between shock and photoionisation models for AGN. Standard emission line diagnostics at rest–frame optical wavelengths are shifted in to the near–infrared wavebands for redshifts , and so cannot easily be used for high redshift radio galaxies. In the past couple of years, however, new diagnostic diagrams have been constructed for rest–frame UV emission lines redshifted into the optical window [Villar–Martín et al. 1997, Allen et al. 1998].
The emission line pairs CIII] 2326 & CII] 1909 and [NeIII] 3869 & [NeV] 3426 are well–suited for use as line ratio diagnostics for distant radio galaxies for a number of reasons. All four of these fairly high excitation lines are relatively strong in AGN spectra, and so their fluxes can be determined with sufficient accuracy even for high redshift radio galaxies. The two lines in each pair involve the same element, and therefore there is no dependence of the line ratios on metallicity or abundances; they are also close in wavelength, and so the effects of differential reddening or calibration errors are minimised. Perhaps most importantly, the predictions of shock and photoionisation models for these line ratios are significantly different.
The line ratio CIII] 2326 / CII] 1909 was determined for 13 of the 14 sources in the sample from the data presented in Paper 1; the values of this ratio are given in Table 1 together with many other derived quantities of the radio galaxies. For the lowest redshift source, 3C340, CII] 1909 is not redshifted to a sufficiently high wavelength to be observed. The ratio [NeIII] 3869 / [NeV] 3426 is only available from the Paper 1 data for the source 3C324, but for nine of the other sources in the sample values are available from the literature; these also are compiled in Table 1. The two line ratios are plotted against each other on Figure 1, where they are compared to the theoretical predictions of shock and photoionisation as discussed in the following subsections.
| Source | z | Radio | CIII] / CII] | [NeIII] / [NeV]a | [OII] flux | Eq. | Emis. | Max. | Vel. | No. | Opt. | ||
|---|---|---|---|---|---|---|---|---|---|---|---|---|---|
| Size | Ratio | Error | Ratio | Error | () | width | Size | FWHM | Range | Comps | Size | ||
| [kpc] | [erg/s/cm2] | [Å] | [kpc] | [km/s] | [km/s] | [kpc] | |||||||
| (1) | (2) | (3) | (4) | (5) | (6) | (7) | (8) | (9) | (10) | (11) | (12) | (13) | (14) |
| 3C22 | 0.935 | 208 | 4.8 | 0.9 | 1.4 | 0.4 | 2.02 | 80 | 41 | 875 | 75 | 1 | 16 |
| 3C217 | 0.898 | 110 | 1.3 | 0.2 | 5.0 | 2.2 | 4.85 | 544 | 57 | 1000 | 175 | 3 | 21 |
| 3C226 | 0.818 | 263 | 1.9 | 0.3 | — | — | 1.21 | 159 | 50 | 725 | 425 | 1 | 19 |
| 3C247 | 0.749 | 113 | 2.3 | 0.9 | — | — | 1.24 | 129 | 77 | 850 | 250 | 3 | 43 |
| 3C252 | 1.104 | 488 | 2.6 | 0.4 | — | — | 0.81 | 125 | 56 | 450 | 250 | 1 | 22 |
| 3C265 | 0.810 | 646 | 6.4 | 0.9 | 1.2 | 0.5 | 3.56 | 191 | 111 | 700 | 725 | 4 | 76 |
| 3C280 | 0.997 | 117 | 4.8 | 0.8 | 0.7 | 0.3 | 2.11 | 173 | 102 | 800 | 650 | 22 | |
| 3C289 | 0.967 | 89 | 2.8 | 0.5 | — | — | 0.78 | 149 | 46 | 675 | 75 | 1 | 16 |
| 3C324 | 1.208 | 96 | 2.4 | 0.7 | 6.2 | 1.0 | 1.93 | 219 | 60 | 1025 | 800 | 2b | 25 |
| 3C340 | 0.775 | 371 | 10.1 | 1.9 | 0.8 | 0.3 | 0.58 | 84 | 47 | 600 | 200 | 1 | 24 |
| 3C352 | 0.806 | 102 | 1.7 | 0.3 | 4.0 | 1.5 | 2.57 | 295 | 78 | 1050 | 800 | 3 | 24 |
| 3C356c | 1.079 | 624 | 8.4 | 1.5 | 0.9 | 0.2 | 0.76 | 111 | 32 | 725 | 50 | 1 | 12 |
| 3C368 | 1.132 | 73 | 1.1 | 0.2 | 3.9 | 0.5 | 5.87 | 202d | 86 | 1350 | 600 | 58 | |
| 3C441 | 0.708 | 211 | — | — | 1.0 | 0.3 | 0.47 | 58 | 33 | 900 | 375 | 1 | 18 |
Notes:
[a] Values of the [NeIII] 3869 / [NeV] 3426 ratio are taken
from: 3C22 — Rawlings et al. (1995); 3C217 & 3C340 — Spinrad, private
communication; 3C265 & 3C352 — Smith et al. (1979); 3C280 — Spinrad
(1982); 3C324 — Paper 1; 3C356 — Lacy & Rawlings (1994); 3C368 —
Stockton et al. (1996); 3C441 — Lacy et al. (1998).
[b] For 3C324 this corresponds to the two kinematically
distinct components at +400 and 400 km s -1.
[c] The data for 3C356 are for more northerly galaxy.
[d] For 3C368 the determined equivalent width is a lower
limit due to the contribution of the M-star (Hammer et al 1991) to the
continuum level.
2.2 Photoionisation models
The theoretical line ratios of CIII] 2326 / CII] 1909 and [NeIII] 3869 / [NeV] 3426 for photoionised gas were taken from the work of Allen et al. [Allen et al. 1998] who calculated the predicted line ratios for a number of emission lines using the MAPPINGS II code [Sutherland et al. 1993]. Allen et al. considered a planar slab of gas illuminated by a power-law spectrum of ionising radiation, and calculated the emission line ratios for a wide range of conditions: for two different spectral indices of the input spectrum ( with and ), and two different densities of cloud ( and 1000 cm-3), the ionisation parameter 111The ionisation parameter is defined as the ratio of the number density of ionising photons striking the cloud to the gas density () at the front face of the cloud , where c is the speed of light and is the ionisation potential of hydrogen. was allowed to vary in the range . A high energy cutoff was applied to the ionising spectrum at 1.36 keV to avoid over-producing the intensity of the soft X-rays. The models are ionisation bounded and correspond to a range in cloud sizes from 0.003 to 32 parsec. The resultant line ratio sequences are shown on Figure 1.
It is beyond the scope of this paper to provide a more detailed description of the photoionisation models, or of the other theoretical models considered next. For more complete discussions of these modelling techniques the reader is referred to the papers from which the theoretical line ratios have been drawn, in this case the work of Allen et al. [Allen et al. 1998].
2.3 Photoionisation including matter bounded clouds
To avoid the shortcomings of simple photoionisation models discussed at the beginning of Section 2, Binette et al. [Binette et al. 1996] considered photoionisation of a composite population containing both optically thin (matter bounded; MB) and optically thick (ionisation bounded; IB) clouds (cf. Viegas and Prieto 1992). In their models, all of the photoionising radiation passes initially through the MB clouds which absorb a fraction (%) of the impinging ionising photons and produce the majority of the high ionisation lines in the spectrum. The radiation which isn’t absorbed then strikes the population of IB clouds; this radiation has already been filtered by the MB clouds as a result of which the IB clouds give rise to predominantly low and intermediate excitation lines. According to these models, the variation in the emission line ratios from galaxy to galaxy has its origin in the variation of the ratio (hereafter ) of the solid angle from the photoionising source subtended by MB clouds relative to that of IB clouds. A larger value of corresponds to a larger weight given to the MB clouds and hence a higher excitation spectrum. Since the model states that all of the ionising radiation striking the IB clouds must first have passed through the MB clouds, the ratio strictly cannot be below unity.
Binette et al. consider two physical situations which might produce such a composite cloud population (some combination of the two would also be possible): (i) the MB ‘clouds’ may be optically thin shells surrounding a denser IB core of a cloud; (ii) the MB clouds could be a separate population of clouds which lie close to the ionising source. In the second case, the MB clouds would have to have a covering factor of unity in order that all lines of sight to the IB clouds pass through a MB cloud; this is possible for very small clouds, consistent with the fact that they would be optically thin. Note that in the case of the MB clouds forming a separate cloud population, if some fraction of them are obscured from the observer, for example by the same material that obscures the active nucleus itself, this may give rise to an apparent .
Binette et al. tabulated the line ratios in the two cloud populations for a single set of parameters, chosen to give a good match to Seyfert spectra. They adopted a power-law spectrum with a spectral index of (), ionisation parameters of and , a density in the MB clouds of 50 cm-3, and absorbed ionising photon fractions of and (see their paper for a more detailed discussion of these quantities). From these data, a sequence of line ratios of CIII] 2326 / CII] 1909 and [NeIII] 3869 / [NeV] 3426 have been calculated allowing the quantity to vary in the range ; this sequence is shown on Figure 1.
2.4 Shock ionisation models
Fast radiative shocks are a powerful source of ionising photons which can have a profound influence upon the temperature and ionisation properties of the gas in the post–shock region. An overview of shock ionisation models is provided by Dopita & Sutherland [Dopita & Sutherland 1996]. The two most important parameters for controlling the post–shock emission line spectrum are the velocity of the shock and the ratio , where is the pre–shock transverse magnetic field and is the pre–shock number density of the emission line clouds. The latter ratio controls the density, and hence the effective ionisation parameter, of the post–shock gas since at high shock velocities the transverse magnetic field limits the compression caused by the shock through a balance between the magnetic pressure of the cloud () and the ram pressure of the shock ().
Dopita and Sutherland [Dopita & Sutherland 1996] calculated the emission line ratios expected from gas ionised by the photons produced in shocks for a range of physical conditions: the velocity of the shock through the emission line clouds was allowed to vary from 150 to 500 km s -1, and the ‘magnetic parameter’ was varied in the range G cm-1.5, which spans the expected range of values (see their paper for more details). These authors also emphasised the importance of photons produced by the shock diffusing upstream and ionising the pre–shock gas. This may give rise to extensive precursor emission line regions, with different spectral characteristics to the compressed shocked gas. They therefore calculated the emission line spectra predicted for these precursor regions for a range of shock velocities from 200 to 500 km s -1. In distant radio galaxies such as the ones studied in this paper, the spatial resolution is insufficient to distinguish between the precursor and post-shock emission regions, and a combined spectrum of the two would be observed.
Using the data tables provided by Dopita & Sutherland, the emission line ratios of CIII] 2326 / CII] 1909 and [NeIII] 3869 / [NeV] 3426 were calculated both for simple shock models and for shock models including a precursor region. These theoretical ratios are shown on Figure 1.
2.5 Interpreting the line diagnostic diagram
Figure 1 clearly demonstrates that the ionisation states of radio galaxies, even within a tightly defined sample such as the one studied here, show considerable variations: the CIII] 2326 / CII] 1909 ratio differs by nearly a factor of ten between 3C368 and 3C340. The nine sources for which ratios are available for both lines clump into two groups of sources; 3C217, 3C324, 3C352 and 3C368 are grouped together in the region corresponding to the shock ionisation models, while 3C22, 3C265, 3C280, 3C340 and 3C356 are all close to the photoionisation predictions. Interestingly, the four sources in the first region all have projected radio linear sizes smaller than 115 kpc and the five sources in the second group all have sizes larger than this value. This result is more apparent in Figure 2 where the ratio of CIII] 2326 / CII] 1909222This ratio is preferred to the [NeIII] 3869 / [NeV] 3426 ratio here, and in later figures, because data are available for more of the galaxies and because the ratios are all drawn from the homogeneous data set presented in Paper 1. The Neon ratio provides similar results, as is apparent from the strong inverse correlation between the two ratios seen on Figure 1. is plotted against the linear size of the radio source; the two parameters are correlated at the 98.5% significance level in a Spearmann–Rank test.
For all nine sources, the photoionisation models of Binette et al. [Binette et al. 1996] including matter–bounded clouds provide an acceptable fit to the data. There is, however, a problem with this model. As discussed in Section 2.3, a value of is only possible if the MB clouds form a separate population of clouds, some of which are obscured from the observer. The four small radio sources would have to have a value , implying that over 90% of their MB clouds are obscured, while there is no requirement for obscuration of the larger radio sources (). The amount of obscuration would therefore have to depend upon the size of the radio source.
Three factors determine the projected linear size of a radio source: the orientation of the source with respect to the line of sight, the age of the radio source and the advance rate of the hotspots. The first of these cannot be responsible since sources orientated more towards the line of sight, hence appearing smaller, will have less, not more, obscuration towards their central regions (cf. orientation–based schemes of radio galaxies and radio loud quasars). Although the second option cannot be excluded, it seems improbable that the obscuration of MB clouds in the central regions will decrease by an order of magnitude during the short timescale of a radio source lifetime (a few years) without the same process either destroying the clouds themselves or having other consequences, for example for the visibility of the broad–line regions. The third possibility, that there may be a connection between a higher obscuration of the central regions of small radio sources and a slower advance rate of their hotspots, has parallels with the suggestion that compact symmetric radio sources are small because they are confined by a dense (obscuring) surrounding medium (e.g. van Breugel et al 1984). However, recent investigations of compact radio sources using VLBI techniques have derived hotspot advance velocities of significant fractions of the speed of light (, e.g. Owsianik & Conway 1998, Owsianik et al 1998), supporting a youth rather than confinement scenario for these sources. This indicates that there is no strong connection between hotspot advance speed and obscuration (density) of the central regions of radio sources.
It seems unlikely, therefore, that the value of should be strongly dependent upon the radio source size. Although this possibility cannot categorically be excluded, our preferred interpretation of the line diagnostic diagram is that for four sources, for which the extent of the emission line region is within a factor of two of the radio source size, the ionisation is dominated by shocks, whilst for the other five sources photoionisation dominates. This interpretation will be supported by the discussion of the kinematics in the following section; the matter–bounded cloud photoionisation model would provide no clear explanation of the variations seen in the kinematical properties.
The uncertainties in the emission line ratios for each individual galaxy are too large to pin down any parameters of the ionisation accurately, but one feature is readily apparent. The five sources in the photoionisation region of the diagram are significantly more consistent with a flatter spectral index () for the power–law ionising continuum than with the steeper one () typically adopted for low redshift sources. Villar–Martín et al. [Villar–Martín et al. 1997] found a similar result analysing the rest–frame UV emission lines of radio galaxies with redshifts , suggesting that this may be a general feature of high redshift AGN.
3 Morphological and kinematical properties of the emission line gas
The emission line gas surrounding low redshift radio galaxies shows velocity shears within the galaxies of between 50 and 500 km s -1, and (deconvolved) full width at half maxima (FWHM) of the emission lines typically in the range 200 to 600 km s -1[Tadhunter et al. 1989b, Baum et al. 1992]. In many cases the kinematics are consistent with a gravitational origin. At high redshifts the kinematics can be much more extreme, with velocity dispersions often in excess of 1000 km s -1 (McCarthy et al. 1996, Paper 1) and components offset by several hundreds of km s -1 with respect to bulk of the gas (Tadhunter 1991, Paper 1). These remarkable kinematics are inconsistent with gravitational origins (cf. Tadhunter 1991). In this section the variation in the kinematics is compared with other properties of the radio source to investigate their origin.
In Table 1 a number of the parameters of the emission line properties of the gas are provided. The integrated [OII] 3727 emission line intensity and the rest–frame equivalent width of this emission line are as calculated in Paper 1. The projected linear size of the emission line region along the slit direction was determined from the extent of the locations at which fits to the [OII] 3727 emission line profile were obtained in Figures 2 to 15(d) of Paper 1 (excluding the detached emission line systems for 3C356 and 3C441). The range in relative velocities was calculated, to the nearest 25 km s -1, from Figures 2 to 15(e) of Paper 1, considering the velocity separation between the most positive and most negative velocity components of the [OII] 3727 emission line, excluding any data points with uncertainties greater than 100 km s -1. The maximum value of the FWHM of the emission line gas was determined from Figures 2 to 15(f) in Paper 1, again excluding any locations with uncertainties greater than 100 km s -1.
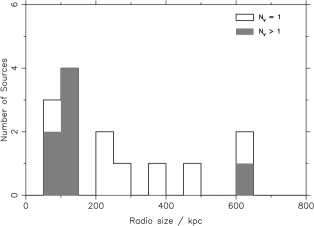
One further parameter was calculated, hereafter referred to as the ‘number of velocity components’, , to provide an indication of the smoothness of the velocity profile. was defined as the number of single velocity gradient components (ie. straight lines) necessary to fit, within the errors, the velocity profiles along the slit direction (Figures 2 to 15e of Paper 1; cf van Ojik et al. 1997). A galaxy whose mean motion is consistent with simple rotation will provide a single component fit; higher values of correspond to irregular motions. This analysis, being by its very nature somewhat subjective, was carried out separately by two of the authors and by a third independent scientist. For 11 of the 14 galaxies a unanimous value of was obtained. The remaining three galaxies show more complicated profiles and their classification is ambiguous: for 3C280, values of 3, 4 and 5 were obtained, and so a value of is adopted; for 3C324 the profile is very different from the other galaxies, being composed of two kinematically distinct systems as discussed in Paper 1 — a value of 2 is used; values of 2, 3 and 4 were assigned to 3C368, and so is adopted. The precise values of for these galaxies are of less importance than the fact they they are clearly inconsistent with a value of 1. The values of are compiled in Table 1.
A number of features are immediately apparent from Table 1. It is noteworthy that of the seven galaxies with projected radio sizes smaller than 150 kpc, six have values with only one having , while six of the seven sources larger than this size have (see Figure 3). A chi–squared test shows that the probability of this occurring by chance is below 1%. Small radio sources predominantly have emission line gas with distorted velocity profiles and the emission line gas of large radio sources has a velocity profile generally consistent with rotation.
A similar result is found with the variation of the maximum FWHM with radio size, shown in Figure 4. These two parameters are anti-correlated at greater than the 99% significance level (Spearmann Rank test), with the four sources lying in the ‘shock’ region of the line diagnostic diagram (Figure 1) having clearly the highest values. This latter point is made more clearly in Figure 5 where the FWHM of the [OII] 3727 emission can be seen to be inversely correlated with the CIII] 2326 / CII] 1909 emission line ratio, at the 98.5% significance level using a Spearmann Rank correlation test. The kinematical and ionisation properties of these galaxies are fundamentally connected.
It is not only the kinematics of the gas that evolve with the radio source size, but also the physical extent and the luminosity of the line emission. Figure 6 shows the variation of the equivalent width of the [OII] 3727 emission line with increasing size of the radio source. Although this correlation is less strong (96% significance in a Spearmann Rank test), it is apparent that the small sources in the ‘shock–dominated’ region of Figure 1 show enhanced [OII] 3727 equivalent widths. A more accurate description of Figure 6 is not that there is an inverse correlation between the equivalent width of the [OII] emission and radio size, but rather that at large ( kpc) radio sizes the distribution of equivalent widths is fairly flat, and at small sizes there is often a factor of 2 to 3 excess emission relative to this level.


This enhancement of the line equivalent widths of small radio sources with respect to large sources implies an even greater boosting of their line luminosities, for two reasons. First, the optical continuum emission of small radio sources is more luminous than that of large sources, as indicated by Best et al. [Best et al. 1996], decreasing the apparent increase in the emission line equivalent width. Second, the equivalent width is determined from the extracted 1–dimensional spectrum from a spatial region along the slit of about 35 kpc (see Paper 1); the physical extent of the emission line regions of small radio sources is greater than that of large radio sources, as shown in Figure 7. Excluding 3C265, which is an exceptional source in many ways (e.g. see discussion in Best et al. 1997), the emission line regions of radio sources with sizes kpc have total extents of up to about 50 kpc (25 kpc radius, if symmetrical). Smaller radio sources, however, have emission line regions ranging from this size up to about 100 kpc, a size comparable to the extent of the radio source. In other words, line emission at distances from the AGN of 30 to 50 kpc generally is only seen at the stage of radio source evolution when the hotspots are passing, or have just passed, through this region.
4 Discussion
A number of results have been derived in the previous sections and these are summarised here for clarity.
-
•
Radio sources with small linear sizes ( kpc) have lower ionisation states than larger radio sources. Their emission line ratios are in agreement with the theoretical predictions of shock ionisation models, whilst those of large radio sources are consistent with photoionisation.
-
•
There is a strong inverse correlation between the FWHM of the [OII] 3727 emission and the size of the radio source. The four sources with ‘shock–dominated’ ionisation states have the highest FWHM.
-
•
Large radio sources often have smooth velocity profiles consistent with rotation, whilst those of small sources are more distorted.
-
•
The [OII] 3727 emission line strength correlates inversely with the radio source size. The four ‘shock–dominated’ sources have the highest integrated [OII] 3727 equivalent widths.
-
•
The physical extent of the line emitting regions is larger in smaller radio sources.
Before discussing the interpretation of these correlations, first a comparison is made to see if such results also hold for low redshift radio galaxies.
4.1 Comparison with low redshift radio galaxies
Baum et al. [Baum et al. 1992] studied the ionisation and kinematics of a sample of 40 radio galaxies with redshifts . Their sample contained a large mixture of radio source types, including both Fanaroff & Riley (1974; hereafter FR) class I and II objects333FR I radio sources are edge–darkened sources of generally lower radio luminosity that the FR II sources; FR II’s are characterised by bright hotspots towards the extremities of each lobe. as well as sources with intermediate structures. Many differences are now known to exist between the FR I and FR II sources besides the large differences at radio wavelengths, such as the luminosity and environments of their host galaxies [Hill & Lilly 1991, Baum et al. 1995, Ledlow & Owen 1996], the luminosity of their emission line gas [Zirbel & Baum 1995], differences in the dust properties [de Koff et al. 1999], and possibly a different mode of accretion on to the central black hole [Reynolds et al. 1996].
Baum et al. also found a significant difference in the host galaxy kinematics between the two radio source types. They classified the kinematics of the radio galaxies into three classes, ‘rotators’, ‘calm non–rotators’ and ‘violent non–rotators’. They found that almost all of the FR II sources fell into the rotator or violent non-rotator classes; most of the FR I and intermediate type sources were calm non-rotators. All of the FR II’s had strong emission lines with a relatively high ionisation parameter, whilst the FR I and intermediate class sources had much weaker emission lines of lower ionisation, with the surrounding hot interstellar and intracluster medium likely to play an important role in the ionisation, both through heat conduction and through ionisation by its ultraviolet and soft X–ray emission (see also Baum et al. 1995, Zirbel et al. 1995). Given the large differences between FR I and FR II sources, to allow a direct comparison with the high redshift sample, attention here is restricted to only the FR II sources in their sample. Four FRII’s in the sample lie more southerly than declination and for two of these accurate determinations of the radio size could not be found in the literature; to avoid introducing any biases by selecting only the well-studied sources, all four of these sources have been excluded from further consideration.
| Source | Radio size | Kinematic | [OI] 6300.3 / H | |
|---|---|---|---|---|
| [kpc] | Classa | Ratio | Error | |
| 3C33 | 397 | R | 0.20 | 0.08 |
| 3C63 | 84 | VNR | 0.28 | —b |
| 3C98 | 264 | R | 0.12 | 0.01 |
| PKS 0634-206 | 1200 | R | 0.06 | 0.01 |
| 3C192 | 308 | R | 0.10 | —b |
| 3C227 | 499 | R | — | — |
| 3C285 | 268 | R | 0.15 | 0.09 |
| 3C403 | 357 | R | 0.21 | 0.16 |
| 3C405 | 194 | CNR | 0.32 | 0.08 |
| 3C433 | 169 | VNR | 0.23 | 0.03 |
| PKS 0349-278 | 635 | R | — | — |
| 3C171 | 171 | VNR | — | — |
| 3C184.1 | 473 | R | — | — |
| 3C277.3 | 106 | VNR | — | — |
| 4C29.30 | 85 | VNR | — | — |
| 3C293 | 261 | R | — | — |
| 3C305 | 15 | R | — | — |
| 3C382 | 287 | R | — | — |
Notes:
[a] R — rotator; CNR — calm non–rotator; VNR — violent
non–rotator.
[b] No error quoted as the mean value is taken from data at
only one position.
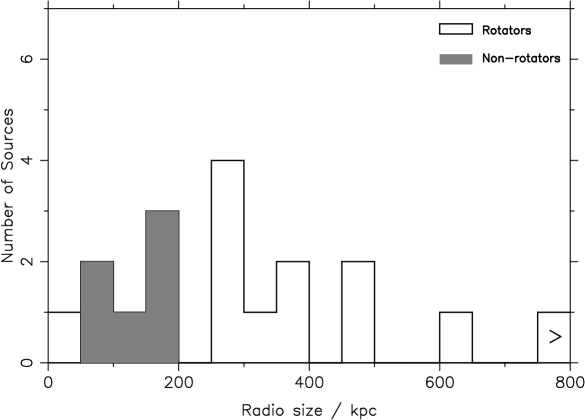
The remaining sample of low redshift FR II radio galaxies is listed in Table 2, along with the linear size of the radio source taken from the literature and the kinematic classification given by Baum et al. [Baum et al. 1992]. In Figure 8 a histogram of the linear sizes is presented, separating the rotator and non-rotator classes. It is clear that the non-rotator classes are associated with small radio sources, and the rotator class with larger sources, exactly as is found for the high redshift sample. The only exception to this rule is 3C305, which is a rotator with a small radio size: indeed, this is the smallest radio source in the sample (15 kpc), and it could be argued that any shocks associated with the radio source have not yet passed through a significant proportion of the host galaxy, accounting for the lack of clear non-rotational kinematics. Even including 3C305, the probability of the radio sizes of the rotator and non-rotator classes being drawn from the same parent samples is less than 0.5% (using a Mann–Whitney U–test).

All of the FR II’s in the sample have relatively high ionisation states, but differences are seen from galaxy to galaxy. Baum et al. [Baum et al. 1990] present the line strengths of the [OI] 6300.3, [NII] 6548.1,6583.4, H and [SII] 6716.4,6730.8 emission lines as a function of position for half of the sample considered in their 1992 paper. Although these are all relatively low ionisation lines and therefore not the most sensitive to differences between shock and photoionisation, the [OI] / H ratio should be somewhat higher for shock ionised gas than for photoionised gas. An ‘average’ value of this emission line ratio has been calculated for each galaxy as the mean of the ratios at the various positions tabulated by Baum et al. [Baum et al. 1990]; these are given in Table 2, the errors quoted representing the scatter in the ratio with location in the galaxy. In Figure 9 these ratios are plotted against radio size: a Spearmann rank test shows that this emission line ratio is anticorrelated with radio size at the 96% confidence level.
The low redshift sample therefore provides similar results to the high redshift sample. Large FR II radio sources have kinematics consistent with rotation and higher ionisation states than small radio sources, whose ionisation and kinematics show more evidence for the role of shocks. It is of note that the low and intermediate redshift sources for which individual studies have shown unambiguously that the kinematics and ionisation are dominated by shocks are almost invariably cases in which the radio source is of comparable size to the extended emission line regions (e.g. Clark et al. 1997,1998), naturally agreeing with this picture.
One significant difference that remains between the low and high redshift samples is that the high redshift sources are more extreme in their emission line properties (luminosities, line widths, etc) than those at low redshifts. The most important factor influencing this is the sharp increase of the radio power with redshift in the flux–limited samples, with corresponding increases in both the flux of ionising photons from the AGN and the energy of the jet shocks. However, Tadhunter et al. [Tadhunter et al. 1998] investigated the correlations of different emission line strengths with redshift and showed that this cannot be the only reason: the ionisation–sensitive [OII] 3727 / [OIII] 5007 ratio does not decrease strongly with redshift as it should if the only difference between the low power, low redshift and the high power, high redshift objects was that the latter contained a more luminous photoionising source. They concluded that a secondary effect such as an increase in the density of the intergalactic medium or an increase in the importance of jet-cloud interactions with redshift is also required.
4.2 The role of shocks in small sources
The results presented in the previous sections, coupled with the evidence that a similar situation is seen at low redshifts, lead naturally to a single scenario to explain all of the emission line properties.
For small radio sources the morphology, kinematics and ionisation properties of the emission line gas are dominated by the effects of the bow shock associated with the expansion of the radio source. As this bow shock passes through the interstellar and intergalactic medium (ISM & IGM), the inter–cloud gas is quickly accelerated to the velocity of the bow shock, but the warm emission line clouds are essentially bypassed by the shock front (e.g. Rees 1989, Begelman & Cioffi 1989). The clouds are accelerated during the short time it takes the shock to pass the cloud by, due to the imbalance in the pressures between the pre–shock and post–shock gas on the front and back of the cloud. The velocity to which the clouds are accelerated in this way is easily shown to be independent of cloud size and to be well below 100 kms (e.g. Rees 1989).
Much larger velocities are induced, however, if the effect of ram–pressure acceleration by the shocked IGM gas (often referred to as entrainment) is considered. Behind the initial bow shock, the clouds find themselves in a shocked layer of IGM, moving outwards at speeds approaching that of the bow shock. The clouds will be accelerated within this medium until they pass across the contact discontinuity into the radio cocoon, where the pressure is the same as in the shocked layer of gas but the density is much lower, and they are no longer accelerated; there is essentially no mixing of the hot inter–cloud gas across this contact discontinuity (e.g. Norman et al. 1982).
During the time for which a cloud is between the bow shock and the contact discontinuity, the momentum imparted to the cloud by the shocked IGM can be approximated to first order as , where is the cloud size, is the bow shock velocity, is the post–shock number density of the inter–cloud gas and is the proton mass. The mass of the cloud is of order , where is the cloud number density, and the timescale is of order , where is the distance between the bow–shock and the contact discontinuity; therefore, the velocity to which the cloud is accelerated is
| (1) |
In the radio source evolution models of Kaiser & Alexander [Kaiser & Alexander 1997], radio sources grow self–similarly and is found to be about 3% of the distance between the AGN and the bow shock [Kaiser & Alexander 1999]; for the radio source passing through the emission line region at radius kpc then, kpc. Assuming a density ratio of for pressure equilibrium between the clouds ( K) and the surrounding IGM ( K), and a shock velocity of from typical hot-spot advance velocities (e.g. Liu, Pooley & Riley 1992), then a cloud of size pc will be accelerated to 750 km s -1, comparable to the velocities observed in the small radio sources (the actual velocities may need to be slightly higher since the radio galaxies are believed to lie close to the plane of the sky). The spread in projected cloud velocities from clouds of different sizes and from clouds accelerated through different regions of the bow shock will lead to the broad velocity dispersions. The acceleration of the emission line gas clouds by the radio bow shocks therefore explains the distorted velocity profiles and large line widths observed in small radio sources.
It is interesting to note that the acquired cloud velocities are proportional to the bow–shock velocity . If the bow–shock velocity increases with radio power (redshift), as has been suggested from spectral ageing measurements of hotspot advance velocities (e.g. Liu, Pooley & Riley 1992), this would explain why greater velocity widths are seen in high redshift sources than low redshift sources.
The ionisation state of the large radio sources indicates that the dominant source of ionising photons in these sources is the AGN. Since the properties of the AGN are not expected to change dramatically between small and large radio sources, the gas surrounding the small sources should receive a similar flux of photoionising radiation. The lower ionisation state seen in the spectra of these galaxies arises in part due to compression of emission line gas clouds by the radio source shocks, decreasing the ionisation parameter. The presence of extra (softer) ionising photons associated with the shocks further influences the ionisation state. Bicknell et al. (1997; see also Dopita and Sutherland 1996) have investigated the emission line luminosity that can be generated by radio source shocks expanding through a single–phase ISM with a power–law density gradient, . For , they show that the work done on the ISM by the expanding radio cocoon () is approximately half of the energy supplied by the radio jet; if the shock is fully radiative then a significant proportion of this energy is fed into emission line luminosity. The luminosity of the [OIII] 5007 emission line can be estimated as
where is the monochromatic power of the radio source at 1.4 GHz, and is the conversion factor from the energy flux of the jet to the monochromatic radio power at 1.4 GHz, which Bicknell et al. [Bicknell et al. 1997] estimate to be of order . Adopting this value, taking the flux density of a typical 3CR source at an observed frequency of 1.4 GHz to be 2 Jy, and assuming that the [OII] 3727 / [OIII] 5007 emission line flux ratio is [McCarthy 1993], then for the observed [OII] 3727 emission line flux produced by the shocks is calculated to be ergs s-1 cm-2. Of this, probably between a third and a half (that is, 1 to ergs s-1 cm-2) will fall within the projected sky area from which the spectrum was extracted. This predicted emission line flux can be compared to the [OII] 3727 emission line fluxes observed in the data (Table 1), which lie in the range to ergs s-1 cm-2 with the smaller radio sources typically having the higher values (see also Figure 6). These results are completely consistent with a small (factors of 2 to 5) boosting of the emission line luminosities of small sources due to the extra energy input from the shocks.
Once the radio source shocks have passed beyond the emission line clouds, the shock–induced emission line luminosity will fall. Under the simplest assumptions, once the jets pass beyond the confining ISM the pressure inside the cocoon will drain away, and the cocoon wall shocks will no longer be pressure driven (e.g. Dopita 1999). These shocks will pass into a momentum conserving phase; their velocity will decrease roughly as , and so since the shock luminosity per unit area scales as , the shock–induced emission line luminosity will fall as . Although these assumptions are oversimplified, taking no account of confinement by an intracluster medium for example, it is clear that once the shock fronts have now passed well beyond the emission line regions, the contribution of ionising photons produced by the shocks will decrease rapidly; this is in complete accord with the larger sources having photoionisation dominated emission line regions.
4.3 The physical extent of the emission line gas
The physical extent of the emission line region of each galaxy along the slit direction was provided in Table 1. For comparison, the extent of the aligned optical (rest–frame ultraviolet) emission has also been determined from the HST observations of Best et al. [Best et al. 1997]; using the HST image taken through the filter at a rest–frame wavelength of about 4000Å, the angular distance over which optical emission was observed at greater than three times the rms sky noise level of the image was measured for each galaxy, and the corresponding ‘optical sizes’ are given in Table 1. These values can further be compared with these results of Best et al. [Best et al. 1998], who showed from near–infrared imaging that, underlying the aligned emission, the radio sources are hosted by giant elliptical galaxies with characteristic radii of typically 10 to 15 kpc.
The extent of the optical aligned emission does not exceed 25 kpc except in three cases: 3C247, 3C265 and 3C368. For 3C368, the HST ‘continuum’ image is actually dominated by a combination of line emission and the correspondingly luminous nebular continuum emission (see discussion in Section 4.5). The large extent of 3C247 is also likely to be predominantly line emission, since it arises from a diffuse halo of emission exactly tracking that seen in a narrow–band [OII] 3727 image by McCarthy et al. [McCarthy et al. 1995].
With the exception of 3C265 (which, as discussed in Paper 1, is an unusual source in many ways), it is therefore reasonable to say that the aligned continuum emission has an extent of only a couple of characteristic radii, and so lies within the body of the host galaxy. The situation with the emission line gas is very different: this has a physical extent which can exceed 100 kpc, with a mean extent of over 60 kpc. The emission line gas clearly extends well beyond the confines of the host galaxy. As was shown in Figure 7, there is also a difference in the physical extent of the line emitting regions between large and small radio sources, with line emission at radii of 30 to 50 kpc generally only seen in small radio sources. Unless there is an intrinsic difference between the environments of the small and large radio sources, which seems unlikely given all of the correlations found, the emission line gas clouds must also be present out to radii kpc in large radio sources, but is not visible.
Again, the role of shocks can be considered to explain this. At these radii, the flux of ionising photons from the active nucleus may be insufficient to produce an observable emission line luminosity. As the radio source shocks pass through these regions, however, the gas density will be increased and, as discussed above, a large source of local ionising photons will become available, pushing up the emission line luminosity. Following the passage of the radio shocks and the consequent removal of the associated ionising photons, this enhanced line emission will fade over timescales much shorter than the radio source lifetime. Thus, luminous line emission is only seen from the clouds at radii 30 to 50 kpc at the time that the radio source shocks are passing through these regions. A direct consequence of this model is that for radio sources smaller than about 100 kpc a positive correlation between radio source size and emission line region size should be observed, since line emission from the clouds at radii 30 to 50 kpc will not be seen until the radio source has advanced that far. Such a correlation has indeed been observed in the Ly- emission of radio galaxies with [van Ojik et al. 1997].
An interesting test of the model presented here could be carried out by taking high spatial resolution long–slit spectra of a sample of radio galaxies with radio sizes smaller than the size of the emission line regions. The prediction is that within the region of the host galaxy occupied by the radio source, the radio source shocks will be important; the emission line ratios will be consistent with shock ionisation, and the gas kinematics will be distorted with broad velocity dispersions. Outside of this region, however, the gas clouds will not yet have been influenced by the radio source shocks and photoionisation should dominate. A study with a similar principle has been carried out on the radio source 1243+036, a radio galaxy of radio size about 50 kpc at a redshift . Distorted Ly- velocity structures with large velocity FWHM are seen within the radio source structure, but Ly- emission also extends beyond that to at least 75 kpc radius in an apparently rotating halo [van Ojik et al. 1996]. Villar–Martín et al. [Villar–Martín et al. 1999] have also found that the line emission of PKS 225041 () is composed of distinct kinematic components: a low ionisation component with broad velocity width in the region of the radio source structure, and a narrower high ionisation component which extends beyond the radio lobe. Carrying out studies such as these for a large sample of radio sources is important because the velocity structures of the line emission in regions outside the radio shocks will directly show the initial motions of the emission line clouds and can be used to determine whether these clouds are simply material associated with the formation of the galaxy which has been expelled into the IGM, or whether they have an external origin, brought in either by a galaxy merger or a cooling flow. It is difficult to distinguish between such scenarios in larger radio sources since information on the initial cloud velocities has been destroyed by the bow shock acceleration.
4.4 Evolution of the velocity structures
One significant issue remains to be explained in this picture, and that is how the velocity structures of the large radio sources are produced. The high gas velocities and velocity dispersions induced by the shocks in small radio sources are seen to evolve within the timescale of a radio source lifetime, a few years, such that the emission line clouds obtain an underlying velocity profile consistent with a rotating halo, albeit with a still high velocity dispersion. Questions that need to be considered are whether this truly is rotation that is being seen, over what timescale can the extreme shock–induced kinematics be damped down, and can a mean rotation profile be produced whilst the velocity dispersion remains so high?
Regarding the first question, given the single slit position and relatively low spatial resolution for the high redshift radio galaxies, it cannot categorically be stated that the emission line profiles of large radio sources are rotation profiles. The data are consistent, for example, with outflow along the radio axes, although in this case it is not clear why the velocity increases with radius (a structure more like that of 3C324 – see Paper 1 – might be expected) while the velocity dispersion decreases with increasing source size. At low redshifts, however, much higher spatial resolution studies using multiple slit positions show clearly that the gas is in rotating structures (e.g. Baum et al. 1990). It therefore seems reasonable to assume that this may also be true at higher redshifts, and even if this is not the case, the questions noted above still need to be addressed for the low redshift radio sources.
Three plausible mechanisms can be considered for the evolution in the velocities of the emission line clouds over the radio source lifetime. The first is that the emission line clouds settle back into stable orbits within the host galaxy through gravitational dynamics alone. The timescale for this process is of order a few crossing times of the clouds, where for clouds moving with velocity km s -1 at a radius kpc in the galaxy, the crossing time is years. This timescale is longer than the radio source lifetime, and so gravity alone cannot give rise to the observed evolution in the emission line structures.
A second possibility concerns the deceleration of emission line clouds moving with respect to the interstellar medium, due to ram–pressure arguments. This works through the same process as the acceleration argument discussed in Section 4.2. As the emission line clouds move through the inter–cloud gas, those clouds moving with the largest velocities sweep up the greatest mass of inter–cloud gas, and so are decelerated most strongly. This process will decrease the width of the cloud velocity distribution.
Simulations have been carried out, as detailed in Appendix A, to investigate the timescale over which the mean velocity of an ensemble of emission line clouds (with an initial velocity distribution similar to that seen in small radio sources) evolves to that of the IGM in which the clouds are moving, and the timescale over which the dispersion of the velocity distribution is decreased. It is found that the peak of the velocity distribution evolves to that of the gas in which it is moving considerably more quickly than the velocity width decreases. Both timescales depends upon the typical cloud size and the ratio of the cloud density to that of the inter–cloud medium within the radio cocoon, and for reasonable assumptions the timescale for decrease of the velocity widths is comparable to the radio source lifetime (see Appendix A for details).
Therefore, if a population of emission line clouds were placed within the rotating ISM of a galaxy, a mean rotation profile for the emission line clouds could be recovered whilst the FWHM of the emission lines remained large, as is observed in the radio galaxies. The problem with this model, however, is that the radio bow shock sweeps up essentially all of the inter–cloud gas, with little mixing through the contact discontinuity (e.g. Norman et al. 1982). The radio cocoon is filled primarily with material supplied by the radio jets, and so there is essentially no gas left following a rotation profile. Such gas would have to be resupplied to the ISM, for example by supernovae and stellar winds from stars in rotational orbits, but it is very unlikely that enough gas can be supplied in this manner. Alternatively, the cocoon material supplied by the radio jets would itself have to be in rotational motion, perhaps through angular momentum transfer from the rotating IGM to the radio source as the bow shocks advance. To summarise, although this mechanism can decrease the velocity widths of the gas, it is not clear whether a rotation profile can be re-established quickly enough.
The third possibility considers the evolution of the population of radiating clouds through a combination of galaxy rotation and cloud shredding. Klein et al. [Klein et al. 1994] showed that in the aftermath of a bow shock, emission line clouds may be susceptible to shredding due to growing Kelvin–Helmholtz and Rayleigh–Taylor instabilities on their surface. The clouds could be shredded over a timescale of a few ‘cloud crushing times’, , where is the density ratio of the cloud to the surrounding medium inside the cocoon, is the post–shock cloud radius, and is the velocity of the bow shock through the IGM. Kaiser et al. [Kaiser et al. 1999] considered such cloud disruption as a way to resupply material to the radio cocoon in order to explain how a secondary hotspot can be formed in the newly discovered class of double–double radio galaxies (e.g. Schoenmakers et al. 1999); they derived a value of yrs.
The cloud shredding time is shortest for the smallest emission line clouds; clouds smaller than about a parsec will be shredded on timescales shorter than the radio source lifetime. These small clouds were the most rapidly accelerated (see Equation 1) and so are responsible for producing much of the high velocity dispersions and distorted velocity structures. If these high velocity small clouds are destroyed then the line emission will become dominated by the remaining more massive clouds, which were less accelerated by the radio source shocks, have a lower velocity dispersion, and may still maintain the vestiges of a rotation profile.
Equation 1 further shows that the velocity acquired by the warm clouds is proportional to the velocity of the bow shock. In directions perpendicular to the radio axis the bow shock velocity is lower by a factor of the aspect ratio of the cocoon (typically between about 1.5 and 6, e.g. Leahy et al. 1989), and so the warm clouds in these directions will be less accelerated. In small radio sources these clouds will not be very luminous since they lie away from the strongest radio source shocks and outside of the cone of photoionising radiation from the partially obscured AGN; the emission will be dominated by the higher velocity clouds along the radio jet direction. Over a rotation timescale ( years), however, these low velocity clouds may be brought within the ionisation cone of the AGN, become ionised, and contribute significantly to the emission line luminosity. Likewise, clouds in small radius orbits around the AGN will acquire lower velocities, since the distance between the bow shock and the contact discontinuity is less and so the period of acceleration is shorter. Thus the rotation profile may re-establish itself from the central regions of the galaxy outwards.
By these two mechanisms of shredding and mixing of the cloud populations, the observed population of emission line clouds will evolve such that, in large radio sources, an increasing percentage of the emission will arise from clouds which were less accelerated by the bow shock and so the rotation profile will be gradually recovered. The cloud shredding model has a further advantage that if some fraction of the clouds are destroyed in large radio sources then the emission line luminosity will decrease with increasing radio size, as is observed. The one drawback of this model is that it is surprising that the distinction between radio sources showing rotation profiles and those with distorted profiles is so sharp. Note also that if this scenario is the correct one then the emission line clouds must lie in rotating orbits prior to the radio source activity, providing some information as to their origin.
In conclusion, the observation of emission line clouds in rotating halos around large radio galaxies is not trivial to explain, given the large influence of the radio source bow shocks passing through the medium. Gravitational effects alone cannot be responsible for re–establishing rotation profiles, but a combination of cloud shredding and cloud mixing, maybe with some help from ram–pressure deceleration, could reproduce the effect.
4.5 Implications for the alignment effect
In 1987, McCarthy et al. and Chambers et al. demonstrated that the optical–UV emission of radio galaxies with redshifts has a strong tendency to be elongated and aligned along the direction of the radio source. HST images of a sample of 28 of these radio galaxies [Best et al. 1997] have demonstrated that the form of this so–called ‘alignment effect’ varies strongly from galaxy to galaxy, and in particular appears to evolve with increasing size of the radio source [Best et al. 1996]. Small radio sources show a number of intense blue knots tightly aligned along the direction of the radio jet, whilst larger sources generally have more diffuse optical–UV morphologies. Given the strong similarity between this radio size evolution of the continuum alignment effect and the evolution of the emission line gas properties, it is instructive to examine the role of the radio source shocks and the emission line clouds in giving rise to continuum emission.
One direct connection is the nebular continuum emission from the warm emission line gas clouds [Dickson et al. 1995], that is, free–free emission, free–bound recombination, two–photon continuum and the Balmer forest lines. The flux density of this emission is directly connected to the flux of the H emission line. The very luminous line emission seen in the spectra of these powerful radio galaxies (e.g. Paper 1) thus implies that nebular continuum emission is likely to make a significant contribution to their UV flux density. Indeed, 3C368 was one of the original three radio galaxies studied by Dickson et al. [Dickson et al. 1995], and they found a nebular continuum contribution in the northern knots as high as 60% of the total continuum emission at rest–frame wavelengths just below the 3646Å Balmer break (see also Stockton et al. 1996). As can be seen from Table 1, 3C368 is a somewhat extreme case and the contribution for more typical galaxies will be somewhat lower, but still of great significance. In Section 3 it was shown that the luminosity of the emission lines correlated inversely with the size of the radio source (Figure 6); therefore, the strength of nebular continuum emission will decrease with increasing radio source size, and in small sources will be found predominantly along the radio jet tracing the strongest radio source shocks. This reflects exactly the observed evolution of the continuum alignment effect.
A second alignment effect hypothesis involving the emission line clouds is that star formation is induced by the passage of the radio jet, due to the radio source shocks compressing gas clouds and pushing them over the Jean’s limit (e.g. Rees 1989, Begelman and Cioffi 1989, De Young 1989). It should be noted that it is the most massive clouds which would collapse to form the stars, and these are distinct from the smallest clouds which are the most likely to be destroyed by the bow shock. In regions which might be star–forming, years behind the bow shock, the only clouds which will already have been destroyed by instabilities on their surface are those of size pc (see Section 4.3); for a mean cloud density of 100 cm-3 this corresponds to a total cloud mass of less than 10, not massive enough to have formed a star anyway.
As discussed by Best et al. [Best et al. 1996], the jet–induced star formation mechanism can also account directly for the evolution of the optical–UV morphology with radio size: the mass of stars required to produce the excess optical–UV emission is only a few [Lilly & Longair 1984, Dunlop et al. 1989], well below 1% of the stellar mass of the galaxy, and since the starburst luminosity drops rapidly with age they become indistinguishable from the evolved star population over a timescale of a few years. On the negative side, no direct evidence for young stars in these radio galaxies was found in our spectra (cf. 4C41.17 at higher redshift, ; Dey et al. 1997), although the clearest features of young stellar populations fall outside the observed wavelength ranges.
Another important continuum alignment model is scattering of light from a hidden quasar nucleus by electrons [Fabian 1989] or dust (e.g Tadhunter et al. 1989a, di Serego Alighieri et al. 1989). Strong support for this model comes from the observation that the optical emission of some distant radio galaxies is polarised at the % level with the electric vector oriented perpendicular to the radio axis (e.g. Cimatti et al. 1996 and references therein), and the detection of broad permitted lines in polarised light [Dey & Spinrad 1996, Cimatti et al. 1996, Tran et al. 1998]: clearly some fraction of the excess optical–UV emission must be associated with this mechanism. However, the lack of polarised emission from some sources (e.g. 3C368, van Breugel et al. 1996; see also Tadhunter et al. 1997) dictates that this is not universal; even for 3C324 where the polarisation percentage is high, only a fraction % of the optical–UV emission is associated with the scattered component [Cimatti et al. 1996]. A problem for scattering models is that, in the simplest picture, a biconical emission region is expected for the scattered light, rather than the knotty strings of emission observed to lie along the radio jet. However, in light of jet–shock models, this could be explained by extra scattering particles being made available along the radio jet axis, either as dust grains being produced in jet–induced star forming regions, or by radio source shocks disrupting optically thick clouds along the radio jet direction and exposing previously hidden dust grains [Bremer et al. 1997].
In conclusion, radio source shocks will play a key role in producing the observed morphology and radio size evolution of the continuum alignment effect. Nebular continuum emission will be enhanced in small radio sources, some gas clouds may be induced to collapse and form stars, and extra scattering particles associated either with any star formation or the disruption of gas clouds could enhance the scattered component.
5 Conclusions
The main conclusions of this work can be summarised as follows:
-
•
Small radio sources show a lower ionisation state than large radio sources. The emission line ratios of radio sources with linear sizes kpc are consistent with the gas being ionised by photons produced by the shocks associated with the radio source. The emission line luminosities of the small sources are boosted by a small factor () relative to large sources, in accord with them receiving an extra source of ionising photons from the shock.
-
•
Small radio sources have very distorted velocity profiles, large velocity widths, and emission line regions covering a larger spatial extent than those of large sources; the latter have much smoother velocity profiles which appear to be dominated by gravitation. These properties are fully explained in terms of the passage of the shocks associated with the radio source.
-
•
A strong correlation is found between the ionisation state of the gas and its kinematical properties, indicating that the two are fundamentally connected.
-
•
These correlations, originally derived for the sample of redshift one radio galaxies studied in Paper 1, are shown also to hold for a sample of FR II radio galaxies with redshifts .
-
•
The similarity of the evolution of the emission line gas properties with radio size to that of the continuum alignment effect makes a strong case for the continuum alignment effect also having a large dependence upon radio source shocks.
-
•
The continuum alignment effect is generally confined to within the extent of the host galaxy, but line emission is observed over a considerably larger spatial extent.
Acknowledgements
The William Herschel Telescope is operated on the island of La Palma by the Isaac Newton Group in the Spanish Observatorio del Roches de los Muchachos of the Instituto de Astrofisica de Canarias. This work was supported in part by the Formation and Evolution of Galaxies network set up by the European Commission under contract ERB FMRX– CT96–086 of its TMR programme. We are grateful to Mark Allen for supplying the output of the MAPPINGS II photoionisation models in digitised form, and Hy Spinrad for providing the Neon line ratios for 3C217 and 3C340. We thank Matt Lehnert, Arno Schoenmakers and Christian Kaiser for useful discussions, and the referee, Mike Dopita, for his careful consideration of the original manuscript and a number of useful suggestions.
References
- [Allen et al. 1998] Allen M. G., Dopita M. A., Tsvetanov Z. I., 1998, ApJ, 493, 571
- [Antonucci 1993] Antonucci R., 1993, ARA&A, 31, 473
- [Baldwin et al. 1981] Baldwin J. A., Phillips M. M., Terlevich R., 1981, PASP, 93, 5
- [Barthel 1989] Barthel P. D., 1989, ApJ, 336, 606
- [Baum et al. 1990] Baum S. A., Heckman T. M., van Breugel W. J. M., 1990, ApJ Supp., 74, 389
- [Baum et al. 1992] Baum S. A., Heckman T. M., van Breugel W. J. M., 1992, ApJ, 389, 208
- [Baum et al. 1995] Baum S. A., Zirbel E. L., O’Dea C. P., 1995, ApJ, 451, 88
- [Begelman & Cioffi 1989] Begelman M. C., Cioffi D. F., 1989, ApJ, 345, L21
- [Best et al. 1996] Best P. N., Longair M. S., Röttgering H. J. A., 1996, MNRAS, 280, L9
- [Best et al. 1997] Best P. N., Longair M. S., Röttgering H. J. A., 1997, MNRAS, 292, 758
- [Best et al. 1998] Best P. N., Longair M. S., Röttgering H. J. A., 1998, MNRAS, 295, 549
- [Best et al. 1999] Best P. N., Röttgering H. J. A., Longair M. S., 1999, MNRAS: submitted.
- [Bicknell et al. 1997] Bicknell G. V., Dopita M. A., O’Dea C. P., 1997, ApJ, 485, 112
- [Binette et al. 1996] Binette L., Wilson A. S., Storchi–Bergmann T., 1996, A&A, 312, 365
- [Bremer et al. 1997] Bremer M. N., Fabian A. C., Crawford C. S., 1997, MNRAS, 284, 213
- [Chambers et al. 1987] Chambers K. C., Miley G. K., van Breugel W. J. M., 1987, Nat, 329, 604
- [Cimatti et al. 1996] Cimatti A., Dey A., van Breugel W., Antonucci R., Spinrad H., 1996, ApJ, 465, 145
- [Clark et al. 1998] Clark N. E., Axon D. J., Tadhunter C. N., Robinson A., O’Brien P., 1998, ApJ, 494, 546
- [Clark et al. 1997] Clark N. E., Tadhunter C. N., Morganti R., Killeen N. E. B., Fosbury R. A. E., Hook R. N., Siebert J., Shaw M. A., 1997, MNRAS, 286, 558
- [Clarke & Burns 1991] Clarke D. A., Burns J. O., 1991, ApJ, 369, 308
- [de Koff et al. 1999] de Koff S., Best P. N., Baum S. A., Sparks W. B., Röttgering H. J. A., Miley G. K., Golombek D., Macchetto F., Martel A., 1999, ApJS, accepted for publication
- [De Young 1989] De Young D. S., 1989, ApJ, 342, L59
- [Dey & Spinrad 1996] Dey A., Spinrad H., 1996, ApJ, 459, 133
- [Dey et al. 1997] Dey A., van Breugel W. J. M., Vacca W. D., Antonucci R., 1997, ApJ, 490, 698
- [di Serego Alighieri et al. 1989] di Serego Alighieri S., Fosbury R. A. E., Quinn P. J., Tadhunter C. N., 1989, Nat, 341, 307
- [Dickson et al. 1995] Dickson R., Tadhunter C., Shaw M., Clark N., Morganti R., 1995, MNRAS, 273, L29
- [Dopita 1999] Dopita M. A., 1999, in Berry D., da Costa A., Dyson J., eds, Astrophysical Dynamics. Astrophysics and Space Science, in press
- [Dopita & Sutherland 1996] Dopita M. A., Sutherland R. S., 1996, ApJ Supp., 102, 161
- [Dunlop et al. 1989] Dunlop J. S., Guiderdoni B., Rocca-Volmerange B., Peacock J., Longair M., 1989, MNRAS, 240, 257
- [Fabian 1989] Fabian A. C., 1989, MNRAS, 238, 41P
- [Fanaroff & Riley 1974] Fanaroff B. L., Riley J. M., 1974, MNRAS, 167, 31P
- [Hammer et al. 1991] Hammer F., Le Fèvre O., Proust D., 1991, ApJ, 374, 91
- [Heckman et al. 1989] Heckman T. M., Baum S. A., van Breugel W. J. M., McCarthy P. J., 1989, ApJ, 338, 48
- [Hill & Lilly 1991] Hill G. J., Lilly S. J., 1991, ApJ, 367, 1
- [Kaiser & Alexander 1997] Kaiser C. R., Alexander P., 1997, MNRAS, 286, 215
- [Kaiser & Alexander 1999] Kaiser C. R., Alexander P., 1999, MNRAS: submitted.
- [Kaiser et al. 1999] Kaiser C. R., Schoenmakers A. P., Röttgering H. J. A., 1999, MNRAS: submitted.
- [Klein et al. 1994] Klein R. I., McKee C. F., Colella P., 1994, ApJ, 420, 213
- [Lacy & Rawlings 1994] Lacy M., Rawlings S., 1994, MNRAS, 270, 431
- [Lacy et al. 1998] Lacy M., Rawlings S., Blundell K. M., Ridgway S. E., 1998, MNRAS, 298, 966
- [Laing et al. 1983] Laing R. A., Riley J. M., Longair M. S., 1983, MNRAS, 204, 151
- [Leahy et al. 1989] Leahy J. P., Muxlow T. W. B., Stephens P. W., 1989, MNRAS, 239, 401
- [Ledlow & Owen 1996] Ledlow M. J., Owen F. N., 1996, AJ, 112, 9
- [Lilly & Longair 1984] Lilly S. J., Longair M. S., 1984, MNRAS, 211, 833
- [Liu et al. 1992] Liu R., Pooley G., Riley J. M., 1992, MNRAS, 257, 545
- [Longair et al. 1995] Longair M. S., Best P. N., Röttgering H. J. A., 1995, MNRAS, 275, L47
- [McCarthy 1993] McCarthy P. J., 1993, ARA&A, 31, 639
- [McCarthy et al. 1996] McCarthy P. J., Baum S. A., Spinrad H., 1996, ApJ Supp., 106, 281
- [McCarthy et al. 1995] McCarthy P. J., Spinrad H., van Breugel W. J. M., 1995, ApJ Supp., 99, 27
- [McCarthy et al. 1987] McCarthy P. J., van Breugel W. J. M., Spinrad H., Djorgovski S., 1987, ApJ, 321, L29
- [Norman et al. 1982] Norman M. L., Smarr L., Winkler K.-H. A., Smith M. D., 1982, A&A, 113, 285
- [Owsianik & Conway 1998] Owsianik I., Conway J. E., 1998, A&A, 69, 337
- [Owsianik et al. 1998] Owsianik I., Conway J. E., Polatidis A. G., 1998, A&A, 336, L370
- [Rawlings et al. 1995] Rawlings S., Lacy M., Sivia D. S., Eales S. A., 1995, MNRAS, 274, 428
- [Rees 1989] Rees M. J., 1989, MNRAS, 239, 1P
- [Reynolds et al. 1996] Reynolds C. S., Di Matteo T., Fabian A. C., Hwang U., Canizares C. R., 1996, MNRAS, 283, L111
- [Robinson et al. 1987] Robinson A., Binette L., Fosbury R. A. E., Tadhunter C. N., 1987, MNRAS, 227, 97
- [Schoenmakers et al. 1999] Schoenmakers A. P., de Bruyn A. G., Röttgering H. J. A., van der Laan H., Kaiser C. R., 1999, MNRAS: submitted.
- [Smith et al. 1979] Smith H. E., Junkkarinen V. T., Spinrad H., Grueff G., Vigotti M., 1979, ApJ, 231, 307
- [Spinrad 1982] Spinrad H., 1982, PASP, 94, 397
- [Stockton et al. 1996] Stockton A., Ridgway S. E., Kellogg M., 1996, AJ, 112, 902
- [Sutherland et al. 1993] Sutherland R. S., Bicknell G. V., Dopita M. A., 1993, ApJ, 414, 510
- [Tadhunter 1991] Tadhunter C. N., 1991, MNRAS, 251, 46P
- [Tadhunter et al. 1997] Tadhunter C. N., Dickson R., Morganti R., Villar-Martin M., 1997, in D.L. C., I P., eds, Quasar Hosts. Springer–Verlag, p. 311
- [Tadhunter et al. 1989a] Tadhunter C. N., Fosbury R. A. E., di Serego Alighieri S., 1989a, in Maraschi L., Maccacaro T., Ulrich M.-H., eds, BL Lac Objects. Springer Verlag, p. 79
- [Tadhunter et al. 1989b] Tadhunter C. N., Fosbury R. A. E., Quinn P. J., 1989b, MNRAS, 240, 225
- [Tadhunter et al. 1998] Tadhunter C. N., Morganti R., Robinson A., Dickson R. D., Villar–Martín M., Fosbury R. A. E., 1998, MNRAS, 298, 1035
- [Tran et al. 1998] Tran H. D., Cohen M. H., Ogle P. M., Goodrich R. W., di Serego Alighieri S., 1998, ApJ, 500, 660
- [van Breugel 1996] van Breugel W. J. M., 1996, in Ekers R., Fanti C., Padrielli L., eds, IAU Symposium 175: Extragalactic radio sources. Kluwer Academic Publishers, p. 577
- [van Breugel et al. 1984] van Breugel W. J. M., Miley G. K., Heckman T. M., 1984, AJ, 89, 5
- [van Ojik et al. 1996] van Ojik R., Röttgering H. J. A., Carilli C., Miley G. K., Bremer M. N., Macchetto F., 1996, A&A, 313, 25
- [van Ojik et al. 1997] van Ojik R., Röttgering H. J. A., Miley G. K., Hunstead R., 1997, A&A, 317, 358
- [Viegas & Prieto 1992] Viegas S. M., Prieto A., 1992, MNRAS, 258, 483
- [Villar–Martín et al. 1997] Villar–Martín M., Tadhunter C., Clark N., 1997, A&A, 323, 21
- [Villar–Martín et al. 1999] Villar–Martín M., Tadhunter C., Morganti R., Axon D., Koekemoer A., 1999, MNRAS, 307, 24
- [Zirbel & Baum 1995] Zirbel E. L., Baum S. A., 1995, ApJ, 448, 521
Appendix A Deceleration of emission line clouds moving through the IGM
Consider a spherical cloud of emission line gas with number density and radius travelling at velocity through gas of number density and velocity . In a time a mass of gas of approximately , where is the proton mass, is displaced by the cloud and accelerated from velocity to velocity . The momentum of the cloud is correspondingly decreased:
Defining as , where is a typical cloud radius, then
Using this equation it is possible to follow the evolution of an ensemble of such emission line clouds. For simplicity the distribution of emission line cloud radii was chosen to be flat in logarithm space over a factor of 1000 range centred on , that is, is constant in the range , and 0 outside that range. The initial velocity distribution of the clouds was set to follow a Gaussian distribution with a mean velocity of zero and a FWHM of 1000 km s -1, chosen to represent the velocity dispersion observed in small radio sources. A Monte Carlo simulation was then used to follow the evolution of the velocity distribution of the cloud population in gas moving with velocity +200 km s -1, typical of the relative velocity offsets seen in the galaxy profiles; the results are shown in Figure 10.

It can be seen that the peak of the velocity distribution of the cloud population evolves rapidly to that of the gas in which it is moving; the width of the velocity distribution becomes progressively narrower but over a much longer timescale. The resulting velocity distribution is no longer Gaussian, but can be approximated as a Gaussian distribution plus extended broad wings (the slight dip at 200 km s -1 for the first plotted time interval should be ignored; it arises only due to the simplicity of the model in which a cloud whose initial velocity is close to 200 km s -1 will decelerate very slowly).
The timescale over which the FWHM of the emission line clouds decreases to that observed in large radio sources (a few hundred km s -1) can be used to test the plausibility of this model. This time interval is (the solid line on Figure 10), where . Taking yr as an appropriate age for radio sources a few hundred kpc in size, and assuming pre–shock density ratio with the IGM density decreased a further factor by the bow shock, this gives . For (e.g. Clarke & Burns 1991) the median cloud size would be about about 0.15 parsec; although small, this is certainly plausible given the simplicity of the assumptions.