Wolf-Rayet nebulae as tracers of stellar ionizing fluxes: I. M1-67
Abstract
We use WR124 (WN8h) and its associated nebula M1–67, to test theoretical non-LTE models for Wolf-Rayet (WR) stars. Lyman continuum ionizing flux distributions derived from a stellar analysis of WR124, are compared with nebular properties via photo-ionization modelling. Our study demonstrates the significant role that line blanketing plays in affecting the Lyman ionizing energy distribution of WR stars, of particular relevance to the study of H ii regions containing young stellar populations.
We confirm previous results that non-line blanketed WR energy distributions fail to explain the observed nebular properties of M1–67, such that the predicted ionizing spectrum is too hard. A line blanketed analysis of WR124 is carried out using the method of Hillier & Miller (1998), with stellar properties in accord with previous results, except that the inclusion of clumping in the stellar wind reduces its wind performance factor to only 2. The ionizing spectrum of the line blanketed model is much softer than for a comparable temperature unblanketed case, such that negligible flux is emitted with energy above the He i 504 edge. Photo-ionization modelling, incorporating the observed radial density distribution for M1–67 reveals excellent agreement with the observed nebular electron temperature, ionization balance and line strengths. An alternative stellar model of WR124 is calculated, following the technique of de Koter et al. (1997), augmented to include line blanketing following Schmutz et al. (1991). Good consistency is reached regarding the stellar properties of WR124, but agreement with the nebular properties of M1–67 is somewhat poorer than for the Hillier & Miller code.
Key Words.:
stars: Wolf-Rayet – stars:fundamental parameters – stars:individual:WR124 – ISM: HII regions – ISM:individual objects:M1–671 Introduction
The Lyman ionizing energy distributions of hot, massive stars are important in the study of young starburst regions and galaxies, via population synthesis codes (e.g. Leitherer et al. 1999). However, the interstellar medium (ISM) conspires to prevent this energy from reaching the Earth’s atmosphere. Interstellar dust severely degrades transmitted fluxes at ultraviolet and optical wavelengths, while the Lyman continuum of hot stars is completely absorbed by intervening hydrogen atoms for all but a few nearby B stars (e.g. Cassinelli et al. 1995). Therefore, indirect measurements of the extreme UV flux are necessary.
Until recently, the standard method of obtaining the ionizing distributions of hot stars was to rely on line blanketed, plane parallel, LTE model predictions from Kurucz (1991). However, the need to consider non-LTE effects, spherical geometry and line blanketing effects has recently led to the development of complex model atmospheres (e.g. Hubeny & Lanz 1995; de Koter et al. 1997; Pauldrach et al. 1998), with Lyman continuum ionizing flux distributions obtained via synthesis of the accessible UV and optical stellar spectrum. However, these different codes predict quite different ionizing spectra for early-type stars of identical temperatures. While attempts at testing theoretical stellar O-type models via observations of stellar clusters have been made (Stasińska & Schaerer 1998; Oey & Kennicutt 1998), definitive results require studies of individual stars and their associated H ii regions.
In the case of Wolf-Rayet (WR) stars, evolutionary synthesis models for young starbursts known to contain these stars, known as ‘WR galaxies’, still rely on unblanketed, non-LTE model atmospheres of Schmutz et al. (1992). What effect does line blanketing have on the predicted Lyman continua of WR stars? Recent theoretical calculations by Crowther (1999) suggest that the effect can be substantial, such that unblanketed WR models overestimate the hardness of their ionizing spectra, which is supported by observations of extra-galactic giant H ii regions by Bresolin et al. (1999).
| Quantity | Measurement | Reference |
|---|---|---|
| 11.58 mag | Massey (1984) | |
| 0.81 mag | Massey (1984) | |
| 7.71 mag | van der Hucht et al. (1985) | |
| 1.18 mag | Crowther et al. (1995b) | |
| Distance | 4–5 kpc | Crawford & Barlow (1991) |
| Sp. Type | WN8h | Smith et al. (1996) |
| R | 55–60 arcsec | Grosdidier et al. (1998) |
| , | 1050 cm-3, 6200K | Esteban et al. (1991) |
| 2.8410-11 erg cm-2s-1 | Grosdidier et al. (1998) |
In principle, H ii regions associated with their central star are ideal tracers of the Lyman ionizing flux distributions. However, suitable nebulae are rare, since their properties are often poorly known. The principal studies for WR stars are those of Rosa & Mathis (1990) and Esteban et al. (1993) who combined WR model fluxes from Schmutz et al. (1989, 1992) with observed properties of WR ring nebulae, to investigate the properties of the central stars. Esteban et al. varied the temperatures of unblanketed WR models until agreement was reached between the observed nebular properties and those predicted by photo-ionization modelling. In general, comparisons with (independent) stellar analyses of the central stars was found to be reasonable, except that lower temperatures were required from the photo-ionization models for late-type WN (WNL) stars, especially the Galactic WN8 star WR124 and its associated H ii region, M1–67, for which no agreement was achieved.
In this work, we shall depart from the technique of Esteban et al. in that stellar properties of WR124 are fixed from a spectroscopic study, which are then tested against the nebular properties of M1–67 via photo-ionization modelling using cloudy (Ferland 1996). Sirianni et al. (1998) showed M1–67 to be very clumpy. Hubble Space Telescope (HST) imaging of M1–67 by Grosdidier et al. (1998) revealed an astonishingly complex nebula, allowing measurements of the nebular radial density distribution and integrated H flux. Our work therefore represents the first attempt to test the reliability of predicted WR Lyman continuum distributions using both unblanketed (Hillier 1987) and blanketed models (following Hillier & Miller 1998, 1999) plus robust nebular properties. In our study we compare these predictions with the code of de Koter et al. (1997), augmented to allow for line blanketing following Schmutz (1994, 1997). In this way, we will be able to quantitatively assess the effects of different codes and line blanketing techniques on the ionizing energy produced by WR stars.
In Sect. 2 we will discuss observations of WR124 and M1–67. In Sect. 3 the model atmospheres codes are introduced and discussed, with stellar results compared in Sect. 4. The photo-ionization modelling technique is discussed and results are presented in Sect. 5. Finally, conclusions are drawn in Sect. 6.
2 Observations of WR124 and its associated nebula, M1–67
We discuss the observed properties of WR124 and M1–67 in this section, and provide a summary in Table 1. Unlike most massive WR nebulae, which are difficult to identify, M1–67 was so striking that it was included in the Bertola (1964) Planetary Nebula catalogue (PK 50+3∘ 1) with WR124 as its central star. Cohen & Barlow (1975) instead proposed a massive WN origin, which was supported by Solf & Carsenty (1982) and Esteban et al. (1991), who found nebular abundances to be consistent with processed stellar ejecta, indicative of a massive central star. Confirmation of a non-PN origin was made by Crawford & Barlow (1991) who estimated a distance of 4–5 kpc from interstellar Na i D2 observations. (In order for M1-67 to be a PN, its distance should be 460 pc according to van der Hucht et al. 1985).

2.1 WR124
WR124 (alias 209 BAC, He 2–427) is a Galactic, heavily reddened WN8h star that is well known as the ionizing star of M1–67, with a high heliocentric recession velocity of 200 km s-1 (Merrill 1936). Crowther et al. (1995b) presented optical spectroscopy of WR124, including comparisons with other late-type WN (WNL) stars.
For the current analysis, spectrophotometry obtained in 1991 September at the 2.5m Isaac Newton Telescope (INT), covering 4400–7300 (resolution 2–3Å) are used, taken from Crowther et al. (1995b). Observations obtained at the Deutsch–Spanisches Astronomisches Zentrum (DSAZ) 2.2m observatory in June 1991 provide an additional blue dataset covering 3400–4400 (2Å resolution), details about which can be obtained from Hamann et al. (1995).
New near-IR spectroscopy of WR124 was obtained in 1998 July at the 3.8m U.K. Infrared Telescope (UKIRT) with the cooled grating spectrograph CGS4, the long (300mm) camera, a 256256 InSb array and a 40 l/mm grating. First order observations provided data covering 1.66–2.30m (R800) and 2.98–3.62m (R1300) with a slit width of 0.6′′ (1 pixel). This data set was bias-corrected, flat-fielded, extracted and sky-subtracted using cgs4dr (Daly & Beard 1992). Subsequent reductions and analysis were carried out using figaro (Meyerdierks 1993) and dipso (Howarth et al. 1995). In order to remove atmospheric features, the observations were divided by a standard star (whose spectral features were artificially removed) observed at around the same time and similar air mass. In regions of low atmospheric transmission at UKIRT the reliability of line shape and strength must be treated with caution (e.g. Paschen ).
The reddening to M1–67 is extremely high, with previous estimates of in the range 0.90 (Esteban et al. 1991) to 1.50 (Solf & Carsenty 1982). Analysis of the stellar spectrum by Crowther et al. (1995b) indicated =1.18 mag, which implied a distance of 6kpc, assuming a typical = mag for WN8 stars. Here we attempt an improved stellar reddening determination by including International Ultraviolet Explorer (IUE) newly extracted spectra (INES, Rodriguez-Pascual et al. 1998) of low resolution (LORES) datasets. The quality of LORES INES datasets are preferred to NEWSIPS (Schartel & Skillen 1998). Four large aperture IUE datasets of WR124 were obtained between 1978–1986, including 3 long wavelength (LWR) datasets, totalling 270 minutes exposure time, plus 1 short wavelength (SWP) dataset of 212 minutes.
Pre-empting the results from the next section, we compare spectrophotometry with reddened, line-blanketed model atmosphere distributions obtained with the cmfgen code (see Sect. 3.1) in Fig. 1, indicating 1.3 mag (=4.0), 0.1–0.2 mag higher than previous results based solely on optical stellar datasets. A comparison with alternative isa-wind (see Sect. 3.2) model fluxes indicates an equivalent reddening.
Our measurement is in reasonable agreement with the nebular study of M1–67 by Chu & Treffers (1981) who obtained =1.23 from a comparison of its 1.4 GHz and H flux. In contrast, Esteban et al. (1991) obtained an significantly lower value of =0.90 mag from nebular Balmer line strengths.
Since the reddening towards WR124 is so high, we prefer to select the distance from the K-band absolute magnitude, , where the interstellar reddening is much lower. Using WN8–9 stars at known distance in our Galaxy or the Large Magellanic Cloud (LMC) as calibrators (see Morris et al. 1999 and references therein) we obtain =6.20.3 mag. Using the observed K-band magnitude of WR124 from van der Hucht et al. (1985) plus = 0.12 = 0.49 (Cardelli et al. 1989) we find a distance modulus of 13.44 (i.e. 4.9 kpc), in accord with Crawford & Barlow (1991). Consequently, we adopt a distance of 5 kpc to WR124, i.e. =6.25 mag. Note that the resulting V-band absolute magnitude of =6.1 mag is in excellent agreement with LMC WN8–9 stars (Crowther & Smith 1997).
2.2 M1–67
M1–67, discovered by Minkowski (1946), has a clumpy, ejecta-type, morphology (Chu 1981), with an angular diameter of 90–120 arcsec (Solf & Carsenty 1982; Grosdidier et al. 1998). High spatial resolution spectroscopy of M1–67 was obtained by Esteban et al. (1991), revealing nebular conditions of 103 and 6,200K. Relative to normal H ii regions, oxygen is deficient, with nitrogen enhanced, such that N/O (3). Their results suggest that O has been processed into N mainly through the ON cycle, and confirm that the M1–67 nebula is composed of stellar ejectra. Esteban et al. estimated an upper limit of 0.2 for the ratio between the ISM mass swept-up by M1–67 and the nebular mass, suggesting that relatively little mixing with the local interstellar gas has occurred.
Fabry-Perot interferometry (Chu & Treffers 1981) and long-slit spectroscopy (Sirianni et al. 1998) indicate a complicated velocity field, with two different motions: a spherical, hollow shell, expanding at 46 km s-1, plus a ‘bipolar’ outflow with a larger velocity of 88 km s-1. Sirianni et al. (1998) interpreted this structure as the result of two subsequent outbursts. Grosdidier et al. (1998) used the very high spatial quality of the Wide Field and Planetary Camera 2 (WFPC2) aboard HST to reveal filamentary, chaotic substructures, with a number of ‘bullets’ in the nebula, which seem to concentrate within two conical regions in agreement with the previous results of Sirianni et al. (1998). Globally, Grosdidier et al. (1998) found that the de-projected radial density distribution of M1–67 is well described by a power law, , with a cutoff at 50′′.
3 Stellar atmosphere codes
In this section we introduce and utilise the codes that are used to carry out spectral synthesis of WR124. cmfgen (Hillier 1987, 1990; Hillier & Miller 1998, 1999) solves the transfer equation in the co-moving frame, subject to statistical and radiative equilibrium, assuming an expanding, spherically-symmetric, homogeneous or clumped, atmosphere. Populations and ionization structure are consistent with the radiation field.
To take into account the (microscopic and macroscopic) velocity structure expected in a real WR star, a uniform Doppler line width of =50 km s-1 is assumed. Since this is substantially greater than the (species dependent) thermal Doppler width, we refer to it as a ‘broad-line’ approximation. All lines within some multiple of can interact within the Sobolev resonance zone. Because of the large line width used, the interaction between two lines may be overestimated in the broad-line approximation.
A simplifying ‘super level’ approach is used for individual levels (Anderson 1989), particularly for iron-group elements. In this approach, several levels of similar energies and properties are treated as a single ‘super level’, with only the populations of the super level included in the solution of the rate equations. The population of an individual atomic level in the full model atom is determined by assuming that it has the same departure coefficient as the corresponding super level to which it belongs.
Unfortunately, individual line blanketed co-moving frame calculations are generally computationally demanding, despite the use of super levels, so we first need to confirm that individual case studies, such as this, are in accord with observation. A computationally quick method is to (i) solve the transfer problem in the Sobolev approximation rather than the co-moving frame, which the code isa-wind does (de Koter et al. 1993, 1997), and (ii) consider line blanketing via Monte Carlo sampling following Schmutz (1994, 1997) allowing the opacity of a huge number of lines to be considered. How consistent are results obtained with these different methods?
| Ion | Details | ||||||
|---|---|---|---|---|---|---|---|
| cmfgen | cmfgen | isa-wind | cmfgen | isa-wind | cmfgen | isa-wind | |
| H i | 10 | 30 | 10 | 435 | 45 | 30. | 10 |
| H ii | 1 | 1 | 1 | ||||
| He i | 29 | 51 | 51 | 579 | 691 | 20. | 20 |
| He ii | 13 | 30 | 20 | 435 | 190 | 30. | 20 |
| He iii | 1 | 1 | 1 | ||||
| C iii | 21 | 38 | – | 147 | – | 2s4f1F∘ | – |
| C iv | 9 | 14 | 12 | 48 | 66 | . | 7 |
| C v | 1 | 1 | 1 | ||||
| N ii | 23 | 41 | 3 | 144 | 3 | 2p3d1P∘ | 2p2 1S |
| N iii | 33 | 48 | 40 | 407 | 561 | 2p4p2D | 2p4p2P |
| N iv | 22 | 38 | 34 | 144 | 561 | 2p3d1D∘ | 2s4f1F∘ |
| N v | 9 | 15 | 26 | 42 | 325 | ||
| N vi | 1 | 1 | 1 | ||||
| Al iii | 17 | 45 | – | 362 | – | – | |
| Al iv | 1 | 1 | – | ||||
| Si iii | 25 | 45 | – | 170 | – | 3s5f1F∘ | – |
| Si iv | 17 | 28 | – | 129 | – | – | |
| Si v | 1 | 1 | – | ||||
| Fe iii | 52 | 242 | – | 1840 | – | 3d5(4F)5s5F | – |
| Fe iv | 21 | 280 | – | 3538 | – | 3d4(1G)4p2P∘ | – |
| Fe v | 19 | 182 | – | 1803 | – | 3d3(2D)4p1P∘ | – |
| Fe vi | 10 | 80 | – | 722 | – | 3d2(1S)4p2P∘ | – |
| Fe vii | 1 | 1 | – | ||||
| 337 | 1214 | 181 | 10945 | 2442 | |||
3.1 CMFGEN
The model calculations are based on the iterative technique of Hillier (1987, 1990) named cmfgen. Allowance is made for line blanketing and clumping following the formulation of Hillier & Miller (1998) to which the reader is referred for specific details. The model atom contains hydrogen, helium, carbon, nitrogen, silicon and iron as shown in Table 2. Details of each ion are included, such that for hydrogen, =1 to 30 full levels are considered, which are grouped into 10 super levels. Test calculations indicated that 5000 iron transitions with have negligible influence on the emergent spectrum, but required considerable computational effort, so these have been excluded. Within a super-level, representing a group of full levels, populations are assumed to be in LTE. Elemental abundances other than hydrogen and helium are fixed at cosmic (Si=0.1% by mass, Fe=0.2% by mass) or approximately CNO-equilibrium (C=0.03%, N=1 to 2% by mass) values for a solar metallicity environment.
The stellar radius () is defined as the inner boundary of the model atmosphere and is located at Rosseland optical depth of 20 with the stellar temperature () defined by the usual Stefan-Boltzmann relation. Similarly, the effective temperature () relates to the radius () at which the Rosseland optical depth equals 2/3.
3.2 ISA-wind
The improved Sobolev approximation code (isa-wind) is described in detail by de Koter et al. (1993, 1997). The principal differences with cmfgen relate to: (a) the treatment of the line radiation transfer; (b) the wind electron temperature, which assumes a grey, LTE atmosphere rather than radiative equilibrium, where the temperature is fixed at a pre-assigned value in the outer regions, such that lines originating in the outer wind (e.g. He i 10830) may be incorrectly predicted; (c) the velocity structure deep in the atmosphere; (d) the specific atomic model treated, as listed in Table 2; (e) the neglect of clumping.


isa-wind solves the line radiation transfer using an improved version of the Sobolev approximation. In co-moving frame codes, line photons with a finite (given) width interact with the continuum over a range of depth and frequency points, while in the Sobolev approximation the continuum opacity and source function are considered constant within the line resonance volume. In the improved version of the Sobolev code, isa-wind, absorption of line radiation by the continuum is taken into account within the resonance volume. The Sobolev approximation should be ideal for the large velocity gradients of WR outflows. It introduces great simplification in the rate equations, and makes the overall iteration process about 10 times faster than a co-moving frame code, for the same number or ionic levels and grid points.
Turning to line blanketing, an iterative technique including the Monte Carlo method of Schmutz et al. (1991) and Schmutz (1994, 1997) is used. The method allows the computation of intensity-weighed effective opacity factors, which account for the presence of tens of thousands of spectral lines, dominated by Fe and Ni. Based on isa-wind atmosphere calculations, the Monte Carlo (MC) code determines the line blanketing factors. An iterative procedure is used, such that blanketing factors are used by the non-LTE code to calculate a new atmosphere, which in turn is used to calculate new blanketing factors. A few iterations are generally sufficient. This is due to the fact that the scattering and absorption factors are not very sensitive to the specific model parameters.
The MC method deals with the radiative transfer in the correct manner, except that the ionization and excitation equilibrium of metal species is approximate. This dictates which lines are efficient at capturing photons for each point in the atmosphere. The ionization structure of H and He in the MC code is derived from isa-wind. For other species, an representative ionization temperature is used, obtained from the principal ionization stages for each metal that is considered in isa-wind. The MC code calculated ionization stratification can therefore be compared with that of isa-wind for consistency.
Since line-line interactions are not accounted for in the MC calculation, explicit correction factors, named ‘photon loss’ factors, need to be considered to allow for interaction between important resonance lines (He ii 303, He i 584) and nearby metal lines (Schmutz 1997). We have calculated photon loss factors from the opacities of He ii 303 and lines at nearby wavelengths, and find that line-line interactions are negligible for the stellar temperatures of WNL stars. (Pasquali et al. (1997) previously adopted a factor of 10-4 at He ii 303 for WNL stars.) Additionally, we have determined that line-line interaction between He i 584 and adjacent metal lines would not affect the ionization balance or derived stellar parameters for WR124.
4 Stellar analysis
Unblanketed non-LTE spectroscopic analyses of WR124 by Hamann et al. (1993) and Crowther et al. (1995a) revealed 30–34kK, 5.3–5.4, 10-4.2yr-1, and 700 km s-1. The latter study included hydrogen, helium, carbon and nitrogen, deriving H/He0.6 by number. Hamann & Koesterke (1998a) assumed this hydrogen content, and derived equivalent stellar parameters based on an analysis of the nitrogen spectrum. In contrast, Esteban et al. (1993) used properties of M1–67 to conclude that 30kK, although a suitable unblanketed model was not found from the grid of Schmutz et al. (1992). The best agreement was obtained with the only line blanketed models available at that time, namely those for the WN9 star R84=Brey 18 (=28.5kK) from Schmutz et al. (1991). A spectral comparison of WN8 and WN9 stars is presented by Crowther & Smith (1997).
4.1 Analysis technique
Our approach follows that of Crowther et al. (1995a), such that diagnostic optical lines of He i (5876), He ii (4686) and H i (H+He ii 4859) are chosen to derive the stellar temperature, mass-loss rate, luminosity and hydrogen content. In the absence of high resolution UV observations, a wind velocity of 710 km s-1 is obtained from optical He i P Cygni line profiles. A =1 velocity law is adopted, since this reproduces the optical, near-IR and mid-IR spectra of a similar WN8 star, WR147 (Morris et al. 1999).
4.2 Results
In Fig. 2, we compare spectroscopic observations of WR124 with the synthetic spectrum obtained from cmfgen, allowing for both line blanketing and clumping. The level of agreement between optical observations and theory in Fig. 2 is excellent, except that the He i absorption components are often predicted to be too strong.
We also include comparisons with H and K band UKIRT observations of WR124 in Fig. 2. Again, excellent agreement is reached. Note that UKIRT observations of He ii 3.09m are also well reproduced. The case of He i 2.058m deserves special comment. Crowther et al. (1995a) discussed the difficulties in predicting emission at He i 2.058m for the WN8 star HD 86161, in that the predicted emission was far too weak. The strength of 2.058m (and He i 5016) is very sensitive to the optical depth of the He i 584 transition. Crowther et al. (1995a) attributed this failure to the neglect of line blanketing in the extreme-UV. Our results support this claim for the case of WR124, the predicted 2.058m emission now is in excellent agreement with observation.
Crowther et al. (1995a) obtained a similar level of consistency in their study, based on an identical optical data set, except that electron scattering wings were strongly overestimated because of their assumption of homogeneity (their Fig. 10). Allowing for clumping takes away this discrepancy, such that electron scattering wings are well reproduced with an assumed volume filling factor of =10%, with a corresponding decrease in the required mass-loss rate by a factor of 3. As discussed by Hillier & Miller (1999) and Hamann & Koesterke (1998b), a unique determination of the filling factor is not possible, such that an uncertainty of 50% remains on the precise mass-loss rate.
The stellar parameters for this model are compared with those from the unblanketed, homogeneous analysis of Crowther et al. (1995a) in Table 3. We find that the inclusion of line blanketing has only a minor effect on the derived parameters for WNL stars. Nevertheless, also considering the effects of clumping on the mass-loss rate, the wind performance factor, , is reduced from 10 to 2!
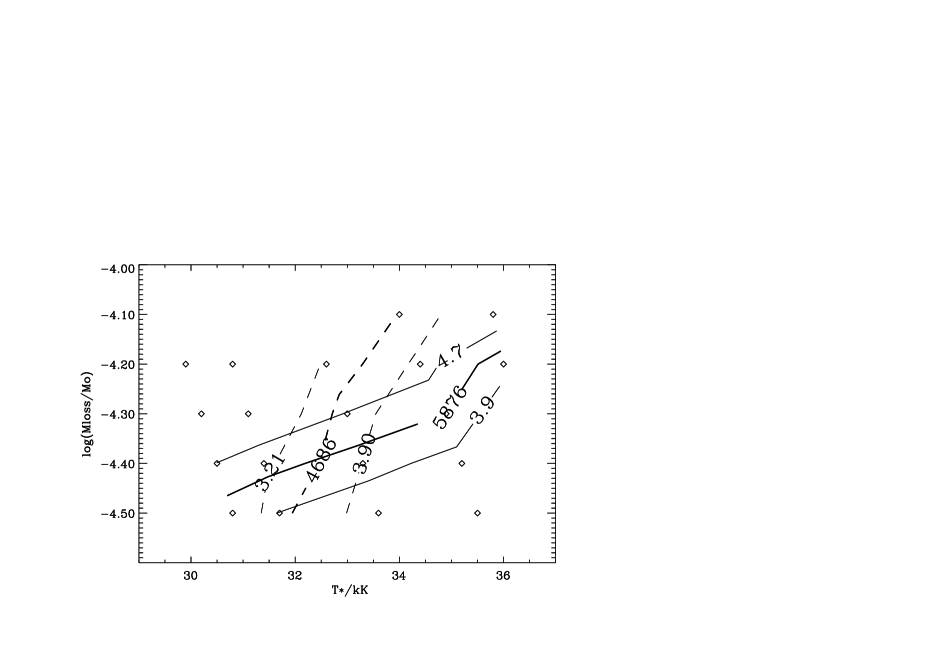
Turning to isa-wind, we present a contour plot for the dependence of our diagnostic He i–ii lines on temperature and mass-loss for WR124. We prefer to use a comparison in terms of peak intensity rather than line equivalent width since the former approach was followed for cmfgen. Our figure allows us to quantify uncertainties in parameters, namely 1000K in temperature and 0.1 dex in mass-loss rate. Since these represent formal uncertainties with isa-wind, how do the derived stellar parameters compare with results from cmfgen? Table 3 reveals that good agreement is obtained between the two codes in derived stellar parameters, including the hydrogen content. This comparison demonstrates the validity of the Sobolev approximation for WR analyses, and represents an important result from the present study.
In Fig. 3, we compare identical optical observations of WR124 with the synthetic spectrum obtained from the isa-wind contour plot, allowing for line blanketing. The quality of line fits is comparable to cmfgen, except that (i) the region around 4100 is more severely underestimated, due to the neglect of Si iv 4088-4116, (ii) He i 5015 is too weak; (iii) He ii 4200, 4542 and 5412 are in better agreement than cmfgen. In the near-IR, He i 2.058m emission is predicted to be somewhat too strong, as is He i 2.112m emission, with Br too weak.
| Parameters | cmfgen | isa-wind | |
| Filling factor, | 100% | 10% | 100% |
| Blanketed? | no | yes | yes |
| (kK) | 33.5 | 32.7 | 32.8 |
| () | 17.1 | 18.0 | 16.2 |
| log() | 5.52 | 5.53 | 5.44 |
| log() yr-1 | 4.1 | 4.2 | 4.4 |
| (km s-1) | 710 | 710 | 710 |
| H/He | 0.6 | 0.7 | 0.8 |
| N/He | 0.004 | 0.006 | 0.003 |
| log (s-1) | 49.05 | 49.05 | 49.00 |
| log (s-1) | 48.19 | 43.88 | 47.91 |

4.3 Comparison of ionizing flux distributions
Our three solutions indicate very similar stellar properties for WR124 and are equally successful at reproducing its optical spectrum. How do the Lyman ionizing flux distributions of these models compare?
The unblanketed cmfgen ionizing energy distribution is shown in Fig. 5. It is relatively flat, with a small jump beyond the He i edge at 1.81 Ryd (24.6 eV or 504Å), and a non-negligible flux up to 3.2 Ryd (286Å). Fig. 5 reveals that the blanketed cmfgen distribution is much softer than the unblanketed solution, showing a large deficit for energies 1.3Ryd (i.e. 700Å), such that a very low flux is emitted at energies beyond the He i edge. In addition, this distribution shows a moderate excess between the Lyman edge and 1.25 Ryd relative to the unblanketed case, which explains why its bolometric luminosity is essentially identical.
isa-wind shows an intermediate energy distribution, with a depression around 1.7 Ryd (540Å), but a relatively hard flux beyond the He i edge, up to energies of 2.9 Ryd (310Å). Possible explanations for the differences in ionizing fluxes between the two blanketed cases are discussed in Sect. 5.4.
5 Photo-ionization modelling
From the usual diagnostic diagram relating H/[S ii] to [S ii] 6717/6731 (see Sabaddin et al. 1977) we find that M1–67 falls in the photo-ionization dominated region. Therefore we use the general purpose photo-ionization code cloudy (Ferland 1996) for our analysis. The ionising radiation fields presented in the previous section are expected to yield different predicted nebular properties, when input into cloudy, which can be quantitatively compared with spectroscopic nebular observations taken from Esteban et al. (1991).
5.1 Description of the calculations
We constructed photo-ionization models using cloudy (v90.04) as described in Ferland (1996) and Ferland et al. (1998). Comparisons with other photo-ionization codes are provided by Ferland et al. (1995). The nebula are represented by a sphere of variable gas density, , and filling factor, , with a central cavity that is ionized and heated solely by the UV radiation of a single central star. Nebular fluxes are predicted, given input abundances, flux distributions and physical parameters. We use a volume filling factor of =0.05 as estimated by Solf & Carsenty (1982). The de-projected radial density profile obtained by Grosdidier et al. (1998) was used, together with an outer (inner) nebula boundary at 50′′ (8′′), which corresponds to 1.25 pc (0.2 pc) using a distance of 5 kpc.
Grosdidier et al. (1998) provided a measurement of the integrated nebular H flux, after correction for [N ii] contamination. We obtain an integrated de-reddened H flux using the reddening of =1.3 mag, determined in Sect. 2.1, namely (H)=5.4510-10 erg cm-2s-1. In addition, long slit nebular line intensities of Esteban et al. (1991) (their position A) are de-reddened according to this value of . Although the majority of previous stellar and nebular reddening determinations are in reasonable agreement with our value, Esteban et al. (1991) obtained a substantially lower value of =0.90 mag for M1–67 using H/H. Consequently, the H/H ratio, de-reddened according to our stellar reddening of =1.3 is far from the usual Case B value.
In order to assess the impact of alternative reddening determinations on the nebular properties, we have also calculated the integrated H flux, following the reddening determination of Esteban et al. (1991), i.e. =0.9, so that (H=2.3510-10 erg cm-2s-1. For this case, long slit nebular line intensities are taken directly from Esteban et al. (1991). Note that identical stellar ionizing flux distributions to those obtained for the higher reddening case are used in this analysis, except that the absolute K-band magnitude is adjusted by 0.15 mag to 6.1 mag, for consistency with the adopted distance of 5 kpc. Results from this alternative approach are very similar to those discussed here for =1.3 mag.
The electron density at the inner boundary was selected so that the predicted H flux agreed with observations. For the =0.9 mag case, typical quantities are =1,350 cm-3 at the inner boundary (8′′ or 0.2 pc), and 320 cm-3 at the outer boundary (50′′ or 1.25pc). Similar values were measured by Esteban et al. (1991), namely 1,000 cm-3 at a distance of 10–25′′ and 200 cm-3 for 30′′ (their region W).
Abundances are assumed to be typical of Galactic H ii regions, except for N, O and S, which are adapted from Esteban et al. (1991). For each reddening, electron densities and temperatures were obtained from the de-reddened [S ii] 6716/6731 and [N ii] 5755/6584 ratios using the ratio program (Adams & Howarth, priv. comm.). For =0.9 we obtained =102.9 cm-3 and =6,000K, while =103.0 cm-3 and =6,200K for =1.3. Subsequently, ionic abundances were obtained by solving the equations of statistical equilibrium using the equib program (Adams & Howarth, priv. comm.), and are given in Table 4 for each reddening. The usual elemental diagnostics were chosen, [N ii] 6584, [O ii] 3727, [S ii] 6731 and [S iii] 9069, with no ionization correction factors for nitrogen (since O O+). Also, we have adopted He/H0.2, since helium is expected to be moderately enriched. Solar abundance ISM dust grains were assumed, although the precise choice is not critical.
| Quantities | Observed | cmfgen | cmfgen | isa-wind |
|---|---|---|---|---|
| Blank? | no | yes | yes | |
| log I(H) | 9.7 | 9.7 | 9.7 | 9.7 |
| 0.05 | 0.05 | 0.05 | ||
| 0.2pc) | 2050 | 1650 | 2000 | |
| =1.25pc) | 480 | 380 | 460 | |
| 12+log N/H | 8.21 | 8.21 | 8.21 | 8.21 |
| 12+log O/H | 8.09 | 8.09 | 8.09 | 8.09 |
| 12+log S/H | 6.64 | 6.64 | 6.64 | 6.64 |
| He/H | 0.2 | 0.2 | 0.2 | 0.2 |
| 3727 [O ii] | 212 | 37 | 52 | 52 |
| 5007 [O iii] | 1: | 316 | 0.0 | 148 |
| 5755 [N ii] | 0.70.1 | 1.1 | 1.9 | 1.3 |
| 5876 He i | 1.60.3 | 30 | 0.0 | 31 |
| 6548 [N ii] | 711 | 24 | 113 | 45 |
| 6563 H | 1941∗ | 284 | 292 | 287 |
| 6584 [N ii] | 2042 | 71 | 333 | 134 |
| 6717 [S ii] | 8.40.2 | 1.8 | 12.5 | 2.7 |
| 6731 [S ii] | 10.30.2 | 1.9 | 12.8 | 2.8 |
| 7135 [Ar iii] | 0.2: | 68 | 0.1 | 50 |
| 9069 [S iii] | 5.50.3 | 30 | 9.5 | 24 |
| 9546 P8 | 1.90.2 | 3.8 | 3.9 | 3.9 |
| N2+/N+ | 10 | 0.00 | 3 | |
| O2+/O+ | 0.02 | 5.5 | 0.00 | 1.5 |
| S2+/S+ | 0.9 | 35 | 1.2 | 17 |
| Ar2+/Ar+ | 57 | 0.00 | 25 | |
| Te(K) | 6,200 | 9,800 | 6,900 | 8,500 |
: See text for an explanation why the H flux does not agree with the Case B value using our stellar reddening.
5.2 Results from photo-ionization modelling
Esteban et al. (1993) identified a large discrepancy between the nebular fluxes of M1–67 as determined by unblanketed model atmospheres (Schmutz et al. 1992) and that observed. In particular, they were unable to reproduce the observed and SS2+ ratio. Closest agreement was achieved for the line blanketed model of R84 (WN9) from Schmutz et al. (1991). We now investigate whether this discrepancy remains, based on improved stellar models, including those for which line blanketing is incorporated. Comparisons between predicted and observed nebular properties are presented in Table 4, including results from both the reddening of Esteban et al. (1991), or the present value, to illustrate the possible range of line strengths and plasma conditions. Lamers et al. (1999) discuss various aspects of the reliability of generally derived nebular conditions and abundances, of relevance to the present comparisons.
5.2.1 CMFGEN
From Table 4, the discrepancy between the observed plasma conditions and photo-ionization modelling from the unblanketed cmfgen analysis is more acute than Esteban et al. (1993) obtained, for both reddening solutions. (A higher stellar temperature is imposed here by modelling the stellar spectrum, including the allowance for light metals, whereas Esteban et al. did not adopt any stellar constraint).
In this case, the ionization balance in the nebula is much higher than observed, with SS+ overestimated by a factor of 40. In addition, the mean is far too high, with the predicted range from 11,200K at the inner nebula to 9,500K at the outer boundary, contrasting sharply with the observed value of 6,200K. Recalling Fig. 5, a relatively strong flux at energies greater than the S2+ edge at 356Å indicates that the predicted nebular ionization balance implies S S S+. Similarly for oxygen, the strong flux predicted below the O+ edge at 353Å implies an error in the OO+ ratio of order 300! Consequently, [O iii] 5007 is predicted to have an intensity that is greater than H, yet [O iii] 5007 is barely detected in M1–67. Similar problems relate to [N ii] 6584, He i 5876 and [Ar iii] 7135.
In contrast, the line blanketed cmfgen model, with a much softer extreme UV energy distribution, produces a much lower predicted electron temperature, in the range 6,600–7,900K, now in reasonable agreement with observations. From Table 4, almost every nebular line is predicted to be within a factor of two of the de-reddened value, with the predicted ionization balance in good agreement with observations.
An explanation for the success of this model can be understood by recalling Fig. 5 in which negligible flux is predicted at energies greater than the He0 edge at 504Å, and indeed only a small flux beyond the S+ 532 edge. Consequently, [S ii] 6731 and especially [S iii] 9069 are fairly well matched for either case, although the predicted ionization balance is actually marginally too low: S S S3+. Another important success of this model is that negligible flux is predicted above the O+ 353Å edge, so that the observed absence of [O iii] 5007 is accounted for.
However, the ionization of the model predicts negligible He i 5876 and [Ar iii] 7135 emission, yet these are both observed, albeit weakly. Note that the precise choice of the He/H abundance ratio in the nebula does not play a major role in the predicted He i 5876 strength, since it is primarily determined by the number of He i ionizing photons. Less crucial deficiencies of this model are that [N ii] 6584 and [O ii] 3727 are predicted to be too strong, although [N ii]/H (independent of reddening uncertainties) is in good agreement.
5.2.2 ISA-wind
Turning to isa-wind, its energy distribution lies intermediate between the unblanketed and blanketed cmfgen models, such that the nebular ionization structure is predicted to be somewhat higher than the observed properties, with overestimated by 40%. Once again, a significant ionizing flux is predicted to lie at energies above the O+ edge, so that the predicted OO+ ratio is a factor of 75 times too high, with very strong [O iii] 5007 predicted. Similarly, the flux above the S2+ and He0 edges are too strong, so that that the SS+ ratio is in error by a factor of 20, and He i 5876 is strongly overestimated.
5.3 Influence of uncertain nebular properties
How dependent are the predicted nebular properties on our assumed filling factor, , or geometry? As a test, we have carried out calculations for the blanketed cmfgen case with =1.3 mag.
For =0.025 (a factor of two smaller), the required electron density is higher, while predicted nebular properties and line strengths properties are barely affected, with the electron temperature unchanged. The greatest influence of a decrease in filling factor is a decrease in the sulphur ionization balance, from S2+/S+=1.2 to 0.9, with changes in nebular line strengths of up to 20% for [S ii-iii]. Comparable increases in S2+/S+ and decreases in electron density are obtained for higher filling factors.
Similarly, we have compared results with a constant, rather than exponentially decreasing, density throughout the nebula. For =0.05, the required electron density is =530 cm-3. Again, the influence is generally small, with the electron temperature unchanged and line strengths modified by up to 10%. Once again, the effect on sulphur is greatest, such that the ionization balance is decreased from S2+/S+=1.2 to 1.0 and changes in [S ii-iii] strengths of up to 20%.
From these calculations, we consider that the nebular predictions are robust, for the blanketed cmfgen case at least, except that the sulphur line strengths and ionization balance suffer from uncertainties of order 50%. Equivalent tests for the unblanketed cmfgen case indicate similar uncertainties for the ionization balance of oxygen and nitrogen, although the effect on emission lines from [O ii–iii] is minor.
Finally, one further note of caution is necessary. Lamers et al. (1999) emphasise that nebular line fluxes and (absolute) abundances may be sensitive to clumping, of particular concern for the M1–67 nebula. Although beyond the scope of the present work, one would ideally like to carry out a re-evaluation of the nebular abundances and conditions of M1-67, accounting for its highly clumped nature.
5.4 Why are predicted ionizing fluxes different?
A definitive explanation for the difference in ionizing spectra produced by the blanketed cmfgen and isa-wind models shortward of 700Å is not straightforward, given the differences in their treatment of the radiative transfer, blanketing, atomic models and atomic data. Nevertheless, several differences in the alternative techniques deserve consideration.
The most promising reason for the differences is that cmfgen allows for photons that are absorbed in lines and re-emitted at other (longer) wavelengths. In contrast, no such channel is available in the isa-wind MC calculations, thereby overestimating the ionizing flux. Other possible explanations, such as photon loss operating in cmfgen at the He i 584 resonance line, or an incorrect iron ionization balance being used for the MC calculation in isa-wind, appear to be excluded (Sect. 3.2).
In addition, the number of lines treated in both cases is incomplete, so that blocking will be underestimated, and the predicted ionizing fluxes overestimated. Recall that the number of lines considered by cmfgen is relatively small, principally treating Fe iii-v, while isa-wind considers many more lines and ionization stages, although this is clearly not complete (solely lines between measured energy levels are included). Depending on the strength of this effect, softer ionizing energy distributions would result, leading to improved agreement with nebular properties for isa-wind.
In spite of the modelling and nebular difficulties, we conclude that the cmfgen line blanketed ionizing energy distribution for WR124 provides excellent consistency with the nebular properties of M1–67, and solves the problem that was identified by Esteban et al. (1993) for this system based on unblanketed models. Use of isa-wind leads to consistent stellar properties for WR124, although the consistency with observed plasma conditions for M1–67 are somewhat poorer than for cmfgen.
6 Conclusions
We have used WR124 and its associated nebula M1–67 to assess the reliability of Lyman ionizing flux distributions from current stellar models. For WR124, we find that stellar properties obtained with two line blanketed, non-LTE extended model atmospheres, isa-wind (de Koter et al. 1997) and cmfgen (Hillier & Miller 1998) are in excellent agreement. However, comparisons with the observed properties of M1–67 favour the ionizing energy distribution obtained by cmfgen rather than isa-wind, reconciling previous inconsistencies identified by Esteban et al. (1993). Certainly, more general conclusions await comparisons for a variety of stars.
In the future we propose to extend our study to WR stars of different spectral type. One well known example is HD 192163 (WR136) and its ring nebula NGC 6888, for which Esteban et al. (1993) also identified a major inconsistency. However, in contrast with M1–67, there is evidence that nebular emission in NGC 6888 may be produced by shocks rather than photo-ionization. Further, the properties of other Galactic WR nebulae are often poorly known, such that different stellar ionizing distributions can reproduce the nebular properties by selecting, for example, alternative electron densities or shell thickness. WR nebulae in the LMC may provide more suitable candidates (Dopita et al. 1994).
In general, study of young stellar populations in external galaxies via associated H ii regions relies heavily on suitable stellar ionizing flux distributions (e.g. Leitherer et al. 1999). Currently, the only WR models that are generally available at this time are unblanketed, pure helium energy distributions (Schmutz et al. 1992). The calculation of a large multi-parameter grid of line-blanketed models remains a formidable computational challenge, unless codes such as isa-wind can be relied upon. Crowther (1999) finds that, in general, the H i and He i ionizing fluxes of early-type WR stars are not greatly affected by line blanketing. However, the additional blanketing from C and O in early WC stars produces a softer ionizing spectrum than for early WN stars of identical temperatures, with negligible flux emitted 300 Å. Indeed, unblanketed models are probably to be preferred for the study of young starburst regions in very metal deficient regions. However, the (uncertain) role that metallicity may play on mass-loss rates of Wolf-Rayet stars does need to be quantitatively investigated (e.g. Crowther et al. 1999).
Acknowledgements.
We are especially grateful to Linda Smith and Luc Dessart for observing WR124 at UKIRT, and for useful discussions. PAC is grateful to the STScI, in particular Antonella Nota, for financial support from the Visitors Fund where this work was initiated, and ST-ECF for support on a subsequent visit. PAC is funded by a Royal Society University Research Fellowship. OD acknowledges financial support from PPARC grant PPA/G/S/1997/00780. AdK acknowledges financial support from NWO Pioneer grant 600-78-333 to R.B.F.M. Waters and from NWO Spinoza grant 08-0 to E.P.J. van den Heuvel. The U.K. Infrared Telescope is operated by the Joint Astronomy Centre on behalf of the Particle Physics and Astronomy Research Council.References
- (1) Anderson L.S., 1989, ApJ 339, 558
- (2) Bertola F., 1964, PASP, 76, 241
- (3) Bresolin F., Kennicutt R.C.Jr, Garnett D.R., 1999, ApJ 510, 104
- (4) Cardelli J.A., Clayton G.C., Mathis J.S., 1989, ApJ 345, 245
- (5) Cassinelli, J.P., Cohen D.H., MacFarlane J.J., et al. 1995, ApJ 438, 932
- (6) Chu Y.-H., 1981, ApJ 249, 195
- (7) Chu Y.-H., Treffers R.R., 1981, ApJ 249, 586
- (8) Cohen M., Barlow M.J., 1975, Astrophys Letters, 16, 165
- (9) Crawford I.A., Barlow M.J., 1991, A&A 249, 518
- (10) Crowther P.A., 1999, In: K.A. van der Hucht, G. Koenigsberger, P.R.J. Eenens, eds., Proc. IAU Symp. 193, Wolf-Rayet Phenomena in Massive Stars and Starburst Galaxies, San Francisco, ASP, p.116
- (11) Crowther P.A., Smith L.J., 1997, A&A 320, 500
- (12) Crowther P.A., Hillier D.J., Smith L.J., 1995a, A&A 293, 403
- (13) Crowther P.A., Smith L.J., Hillier D.J. Schmutz W., 1995b, A&A 293, 427
- (14) Crowther P.A., Beck S.C., Willis A.J., Conti P.S., Morris P.W., Sutherland R.S., 1999, MNRAS 304, 654
- (15) Daly P.N., Beard S.M., 1992, Starlink User Note 27 (Rutherford Appleton Laboratory)
- (16) de Koter, A., Schmutz W., Lamers H.J.G.L.M., 1993, A&A 277, 561
- (17) de Koter, A., Heap, S.R., Hubeny, I. 1997, ApJ 477, 792
- (18) Dopita M.A., Bell J.F., Chu Y.-H. Lozinskaya T.A., 1994, ApJS 93, 455
- (19) Esteban C., Vílchez J.M., Smith L.J., Manchado A., 1991, A&A, 244, 205
- (20) Esteban C., Smith L.J., Vílchez J.M., Clegg R.E.S. 1993, A&A 272, 299
- (21) Ferland G.J., 1996, Hazy, a Brief Introduction to Cloudy 90, University of Kentucky, Physics Department Internal Report.
- (22) Ferland G.J., Binette L., Contini M., et al. 1995, In: Analysis of Emission Lines, A meeting Honoring the 70th Birthdays of D.E. Osterbrock and M.J. Seaton, R.E. Williams & M.Livio (eds.), Cambridge University Press.
- (23) Ferland G.J., Korista K.T., Verner D.A., Ferguson J.W., Kingdon J.B., Verner E.M., 1998, PASP 110, 761
- (24) Grosdidier, Y., Moffat, A.F.J., Joncas, G., Acker, A., 1998, ApJL 506, 127
- (25) Hamann W-R., Koesterke, L., Wessolowski, U. 1993, A&A, 274, 397
- (26) Hamann W.-R., Koesterke L., 1998a A&A 333, 251
- (27) Hamann W.-R., Koesterke L., 1998b A&A 335, 1003
- (28) Hamann W.-R., Koesterke L., Wessolowski U. 1995, A&AS 113, 459
- (29) Hillier D. J., 1987, ApJS 63, 947
- (30) Hillier D. J., 1990, A&A, 231, 111
- (31) Hillier D.J., Miller D.L. 1998, ApJ 496, 407
- (32) Hillier D.J., Miller D.L. 1999, ApJ in press
- (33) Howarth I.D., Murray J., Mills D., Berry D.S., 1995 Starlink User Note 50.16, (Rutherford Appleton Laboratory)
- (34) Hubeny I., Lanz T., 1995, ApJ 439, 875
- (35) van der Hucht K.A., Jurriens T.A. Olnon F.M., et al. 1985, A&A 145, L13
- (36) Kurucz R.L., 1991, In: Philip A.G.D., Upgren A.R., Janes K.A. (eds.), Precision Photometry: Astrophysics of the Galaxy, L. Davis Press, Schenectady, p.27
- (37) Lamers H.G.J.M.L., Nota A., Smith L.J., Panagia N., 1999, ApJ in prep.
- (38) Leitherer C., Schaerer D., Goldader, J.D., et al. 1999, ApJ in press (astro-ph/9902334)
- (39) Massey P., 1984, ApJ 281, 789
- (40) Merrill P.W., 1936, PASP 50, 350
- (41) Meyerdierks H., 1993, Starlink User Note 86.9 (Rutherford Appleton Laboratory)
- (42) Minkowski R., 1946,. PASP 58, 305
- (43) Morris P.W., van der Hucht K.A., Crowther P.A., et al. 1999, A&A submitted
- (44) Oey S., Kennicutt R.C.Jr. 1998 In: I.D. Howarth (ed.), Boulder-Munich II: Properties of Hot, Luminous Stars, ASP Conf Ser. 131, 322
- (45) Pasquali A., Langer N., Schmutz W. et al. 1997, ApJ 478, 340
- (46) Pauldrach A.W.A., Lennon M., Hoffmann T.L., et al. 1998 In: I.D. Howarth (ed.), Boulder-Munich II: Properties of Hot, Luminous Stars, ASP Conf. Ser. 131, 258
- (47) Rodriguez-Pascual P.M., Schartel N., Wamsteker W., Perez A., 1998, Ultraviolet Astrophysics Beyond the IUE Final Archive , ESA SP-413, p.731
- (48) Rosa M.R., Mathis J.S. 1990 In: C.D.Garmany (ed.). Properties of Hot, Luminous Stars, ASP Conf Ser. 7, 135
- (49) Sabaddin F., Minello S., Bianchini A., 1977, A&A 60, 147
- (50) Schartel N., Skillen I., 1998, Ultraviolet Astrophysics Beyond the IUE Final Archive , ESA SP-413, p.743
- (51) Schmutz W., 1994 In: D. Vanbeveren, W. Van Rensbergen &, C. de Loore (eds.), Evolution of Massive Stars A confrontation between Theory and Observations, Sp. Sci. Rev. 66, 253.
- (52) Schmutz W. 1997, A&A 321, 268
- (53) Schmutz W., Hamann W.-R., Wessolowski U., 1989, A&A 210, 236
- (54) Schmutz W., Leitherer C., Hubeny I., et al. 1991 ApJ 372, 664
- (55) Schmutz W., Leitherer C., Gruenwald R., 1992, PASP 104, 1164
- (56) Sirianni M., Nota A., Pasquali A., Clampin M., 1998, A&A, 335, 1029
- (57) Smith L.F., Shara M.M., Moffat A.F.J., 1996, MNRAS 281, 163
- (58) Solf J., Carsenty U., 1982, A&A 116, 54
- (59) Stasińska G., Schaerer D. 1998, A&A 322, 615