High resolution study of associated C iv absorption systems in NGC 554811affiliation: Based on observations made with the NASA/ESA Hubble Space Telescope, obtained from the data archive at the Space Telescope Science Institute. STScI is operated by the Association of Universities for Research in Astronomy, Inc. under NASA contract NAS 5-26555.
Abstract
We present the results of a careful analysis of associated absorption systems toward NGC 5548. Most of the well resolved narrow components in the associated system, defined by the Ly , C iv and N v profiles, show velocity separation similar (to within 10 ) to the C iv doublet splitting. We estimate the chance probability of occurrence of such pairs with velocity separation equal to C iv doublet splitting to be . Thus it is more likely that most of the narrow components are line-locked with C iv doublet splitting. This will mean that the radiative acceleration plays an important role in the kinematics of the absorbing clouds. We build grids of photoionization models and estimate the radiative acceleration due to all possible bound-bound transitions. We show that the clouds producing absorption have densities less than , and are in the outer regions of the broad emission line region (BLR). We note that the clouds which are line-locked can not produce appreciable optical depths of O vii and O viii, and hence can not be responsible for the observed ionized edges, in the soft X-ray. We discuss the implications of the presence of optically thin clouds in the outer regions of the BLR to the models of broad emission lines.
1 Introduction
Associated absorption systems (i.e. absorption systems with ), seen in of the QSOs (and of low AGNs), are a very good probe of the gas in the inner regions of the QSOs (AGNs). Studies of associated systems provide clue toward (i) understanding the chemical enrichment history (Petitjean et al. 1994; Hamann, 1997; Petitjean & Srianand, 1999), (ii) investigating the gas dynamics (infall/outflow), and (iii) probing the geometry and velocity field in the broad emission line region (BLR) (Srianand & Shankaranarayanan, 1999). There are other ways of probing the gas in the centres of AGNs/QSOs. Broad emission lines and their correlated variability with the ionizing continuum probe the emission line gas (Peterson, 1993). Various observations suggest that in most of the low redshift, low luminosity AGNs the BLR consists of optically thick as well as optically thin clouds contributing to the total emission (Shields et al. 1995). It is realized that the ionization conditions in the optically thin clouds resembles that of clouds producing associated absorption lines (Shields et al. 1995). Ionization edges due to photoionized gas in the soft X-ray range (due to O vii, O viii etc.,) are detected in large fraction of AGNs (Reynolds, 1997). These systems are known as ”warm absorbers”. The studies of ”warm absorbers” probe a very highly ionized gas components along the line of sight.
Modeling of different components discussed above requires a good knowledge of the shape of the ionizing radiation, location, chemical composition and density of the cloud. Within the allowed range of different parameters it is realized that one can get a unified model for the absorbing cloud which will produce the observed optical depths of ionized edges in soft X-ray and UV absorption lines (Mathur et al., 1995). High resolution observations of some of the nearby AGNs show that the associated absorption systems are made up of number of narrow components (Crenshaw et al. 1998). However the X-ray spectra used to detect the ”warm absorbers” are of very low resolution and it is impossible to establish any firm connection between the individual components in the UV absorption and the ionized edge seen in the X-rays. However, the important things one need to understand are (1) location of the UV absorbers, (2) kinematics of the clouds, (3) how much contribution such clouds will make to the emission line? and (4) how does the clouds respond to the continuum variation?.
In this work we concentrate on the associated absorption systems observed along the line of sight to NGC 5548. We investigate the multi-component velocity structure in the associated system using the HST archival data. The absorption line profiles suggest that most of the narrow components in the associated systems, identified using the narrow unsaturated lines in Ly and C iv , show signatures of line-locking with velocity separation equal to that of C iv doublet splitting. We construct grids of photo-ionization models and estimate the radiative acceleration due to line absorption in various transitions. We discuss the nature of the absorbing clouds using the upper limit on the acceleration measured from the two epochs of observations, constraints on the ionization parameter, , (which is the dimensionless ratio of number density of ionizing photons to that of particle density) and the requirements for the line-locking.
We show that the number density of the clouds is less than . This with the allowed range in suggests that the absorbing cloud will be situated in the outer regions of the BLR or in between BLR and NLR (Narrow emission line region). We also show that, under the framework of models considered in our analysis, these clouds can not produce appreciable optical depths of O vii and O viii. Thus such clouds can not be responsible for the ionized edges seen in NGC 5548. We discuss the implications of radiatively accelerated, optically thin clouds in the outer regions of the BLR in the reverberation mapping studies.
2 Sub-components in the associated system
The combined FOS (Faint Object Spectrograph) spectrum of NGC 5548, obtained for the AGN watch program (Korista et al. 1996), shows two distinct components in the Ly absorption at 1232Å(i.e = 0.0134) and 1234Å(i.e = 0.0151)(Mathur et al., 1995). The velocity separation between these components is , which is very close to the C iv doublet splitting. These two components are clearly present in the C iv profile in the GHRS (Goddard High Resolution Spectrograph) spectrum (Mathur et al., 1999). However the low redshift system is weak and the profile is not well defined due to poor signal to noise. The very high spectral resolution () achieved by the STIS (Space Telescope Imaging Spectrograph) data allow us to perform a detail analysis of the individual velocity components. The GHRS and STIS spectra used in this study are retrieved from the HST archive and the pipeline calibrated data are processed using standard STSDAS tasks in IRAF. The original data are published already in the literature (Mathur etal ,1999; Crenshaw & Kraemer, 1999).
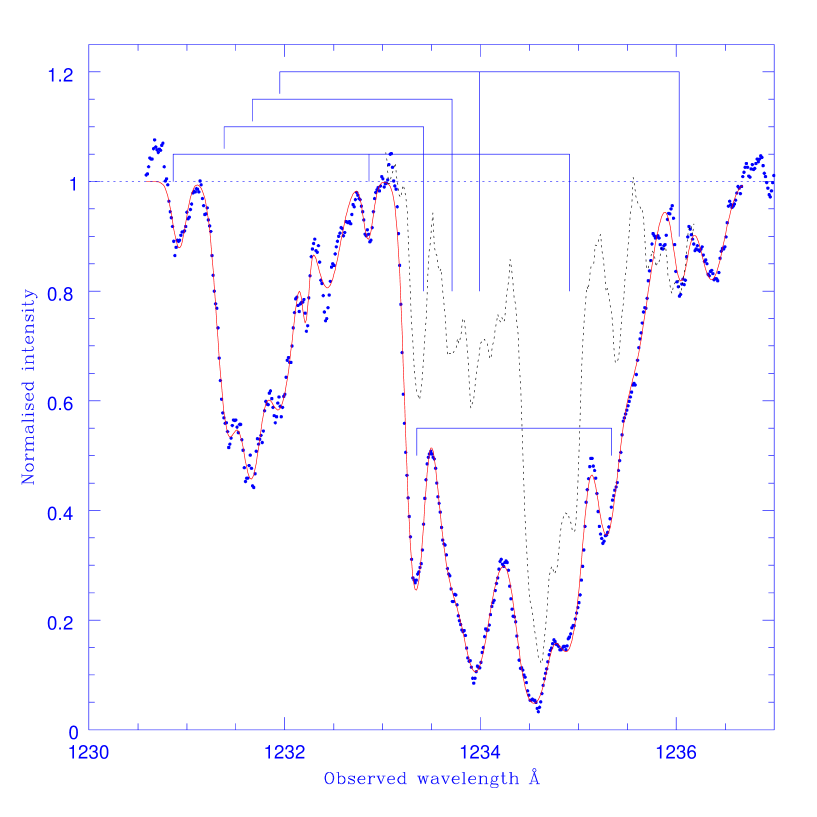
We plot the continuum normalised STIS spectrum (dots), in the wavelength range of Ly absorption, in Fig 1. As can be seen from the figure that the sub-components in the two systems noted above are clearly resolved. The components in the low- system are weak and well resolved, while the components in the high- system are strong and blended. In order to resolve the components in the high- system we make use of the C iv and N v profiles from the GHRS and STIS data. To illustrate the sub-components in this system we plot the C iv profile (GHRS), shifted to the Ly wavelength range, using the dashed curve. We fit the absorption lines using a Voigt profile fitting code (Khare et al., 1997). Minimum number of components needed to fit the blend is decided using the per degrees of freedom. The low- system is resolved into 7 sub-components. As the continuum fit to the spectrum is not unique (due to unknown intrinsic emission line profile) and the cloud producing the absorption need not cover the background source completely, the derived column densities from our fits are lower limits. However the measurement of observed wavelengths of the individual components are more reliable. Individual components in the low system have velocity dispersion in the range 15-40 and a typical error in the determination of the central wavelength is 10 . The high- system is resolved using 11 components. The centroid of each component is fixed to the value needed to fit the C iv and N v doublets from this system. The velocity dispersion of the individual components vary between 25 to 70 and the error in the wavelength is of the order of 7-10 .
It is interesting to note that most of the components which are resolved in the low- system have a corresponding components in the high- system (as shown in Fig 1) with a velocity splitting corresponding to the C iv doublet splitting within an error of 10 . Also there are three components in the high- system which have corresponding components with a velocity splitting corresponding to the C iv doublet splitting among most of the resolved components. Thus the Ly profile seen in the STIS spectrum suggests the presence of line-locking with C iv velocity splitting. We estimate the probability of occurrence of 8 pairs with velocity splitting equal to that of C iv doublet splitting (within 10 ) among 18 clouds randomly distributed distributed in the velocity range 0-1500 to be . This suggests that the line locking seen is most probably true. Thus assuming the existence of line-locking, in what follows we discuss various possible implications.
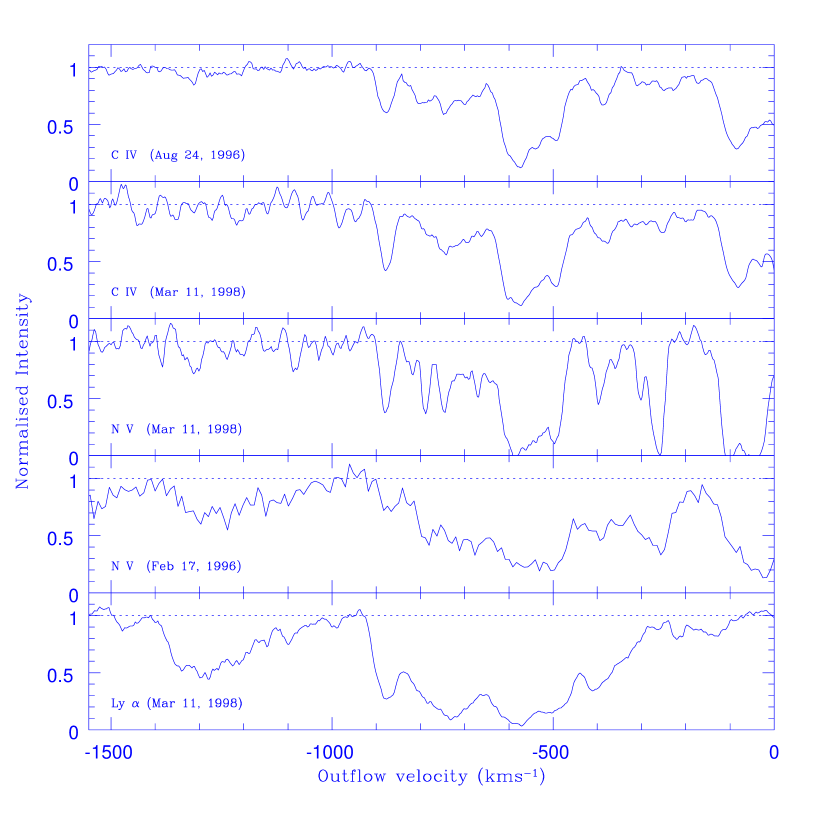
The epoch of observations of NGC 5548 with GHRS and STIS are roughly 2 years apart. These observations can be used to get the bound on the acceleration of the individual components. The velocity plot of Ly , C iv and N v absorption lines observed at different epoch are given in Fig 2. Apart from a uniform shift of -0.05 Å applied to all our GHRS data, we do not detect any shift in the wavelength of the centroid of lines between the data observed in August 24, 1996 and March 11, 1998. This gives a upper limit on the change in the velocity of the components to be . Note that this limit is strictly true for the components in the high- system only. In the case of low- systems poor signal-to-noise in the expected region of C iv absorption in the STIS spectrum prevents us from making any comparison between the C iv profiles. Similarly the GHRS spectrum in the N v absorption region is noisy. However, the N v profile resembles very well with the Ly profile observed with the STIS. In the following sections we try to get the relationship for radiative acceleration and acceleration due to gravity of a optically thin (at the Lyman limit) photo-ionized cloud.
3 Radiative Acceleration
Transfer of momentum of photons from the central source to the absorbing clouds through electron scattering, continuum ionization and resonance line absorption can be used to accelerate the clouds. If the clouds are highly ionized, as in the case of associated C iv absorption systems, the effect of continuum absorption is negligible. Electron scattering contributes to the acceleration only under high electron column densities, i.e., cm2. Thus in the range of ionization parameters and electron density one needs to explain the observed column densities of the associated systems the effect of radiative acceleration due to electron scattering and continuum absorption are negligible. Thus in this work we concentrate on the radiative acceleration due to line absorption only.
It is the usual procedure to represent the ionization state of an absorbing cloud using a dimensionless ionization parameter, . The distance of the cloud from the continuum source, , can be written in terms of as,
| (1) |
where is the number density of hydrogen (H i + H ii) atoms, the velocity of light. , the number of ionizing photons emitted from the source is given by
| (2) |
where is the luminosity at the frequent . For a given spectral energy distribution can be estimated from the observed flux and a set of cosmological parameters.
The gravitational acceleration of a cloud towards the central source is given by,
| (3) |
where is the mass of the central engine.
The total energy received by the cloud at any wavelength per unit wavelength interval per unit time is,
| (4) |
where is the area of the absorbing cloud. Total momentum available in the radiation per sec per unit wavelength interval at is
| (5) |
This momentum is imported to the absorbing cloud through resonance line absorption and used to accelerate the cloud. The acceleration due to a single line transition is given by,
| (6) | |||||
where, , is the optical depth of the line is the mass of the cloud and is the equivalent width to the line. If we assume the absorbing cloud to be a plane parallel slab then,
| (7) |
where, , is the total hydrogen column density, is the mass of hydrogen atom and is the mass fraction in terms of mass of hydrogen atom. In order to get the total acceleration we need to sum the values due to all possible strong transitions. We assume in all our models, and neglect the drag forces due to ambient medium.
4 Line-locking
Line-locking is a process in which the velocity separation between two absorption minima are equal to the velocity separation between some allowed resonance transitions. If the flow is dominated by radiative acceleration due to line absorption then the line-locking is achieved through a non-local coupling process in which photons resonant with one transition (at frequency ) in one part of the flow (say at a location , and velocity ) Doppler shift into resonance with another transition (at frequency ) in another part of the flow (say at , and velocity ) with
| (8) |
In such a case the total number of photons at that can be absorbed by the out-flowing material at is reduced due to absorption at by the material at . This reduces the net acceleration at . Thus the material at will spend some time at an out-flow velocity corresponding to the velocity separation between and . In order to keep this stable for long time two possible mechanisms are proposed. (1) Steady state locking: In the case of steady state locking the net acceleration drops to zero at . This requires that either the contribution by the line transition at dominates total radiative acceleration - and this is normally not the case - or that the total outward force is almost wholly counter balanced by an inward force (eg. gravity or pressure drag) such that their difference is smaller than the line radiation force due to the transition at . In order to achieve such a case one needs to fine tune the model parameters. In this case the line-locking will occur at a definite ejection velocities in the rest frame of the ionizing source (i.e. line locking occurs on the absolute velocities). The double absorption troughs seen in C iv absorption in the case of few BALQSOs (Broad Absorption Line Quasi Stellar Objects) suggest such an accelerating mechanism is indeed important in some quasars (Weymann et al., 1991). (2)Non-steady state locking: In this case, the locking is assumed to be on velocity differences and not on absolute velocities relative to the central source. Locking occurs between two gas elements none of which is at constant velocity (vanishing acceleration), it is only the relative velocity between the two that remains constant and equal to the doublet velocity. The fact that the line-locked pairs occur at different velocities in the case of associated narrow absorption line systems suggests that the non-steady state line locking is operating in these systems. In this case no critical balance between the outward and inward acceleration is required for locking to occur. What one needs is the reduction is acceleration at due to lack of photons at should be equal to the difference in the acceleration between the two fluid elements before locking. While neither of the velocities of the locking and locked gas, with respect to the central source, is constant at locking their velocity difference is. Also locking can occur in the in-falling as well as out-flowing clouds (Braun & Milgrom, 1989).
5 Parameters of the associated system in NGC 5548:
In order to estimate the acceleration of the cloud one needs to get the estimate of various parameters related to the AGN and the absorbing cloud. In this section we try to get the allowed bounds on different parameters from different available observations.
5.1 Mass of the central engine:
The mass of the central engine can be estimated assuming the width of the broad emission lines are due to the gravitational influence of the central engine. The distance of the BLR from the central engine is obtained from the reverberation mapping studies. Krolik et al. (1991), based of the correlation between the line of sight velocity dispersion of different emission lines and characteristic response time for each line, estimated the mass of the central engine to be in the range . Clavel et al. (1992) estimated the mass to be 3.7, using the widths of the Ly line. Done & Krolik (1996), using the C iv emission line profile variability, estimated the central mass to be 2 (for two dimensional random motions) and 8 (for three dimensional random motions) for the mass of the central engine in the case of NGC 5548. Other method of estimating the mass is using the accretion disk models and the continuum spectral energy distribution. Sun & Malkan (1989) need a minimum mass of to reproduce the energy distribution of NGC 5548 in the framework of standard disk models. However when re-processing is added, the mass required reduces to 5.5. Thus we consider the mass to be in our models for NGC 5548.
5.2 Density in the absorbing clouds:
Shull & Sachs(1993) have studied the associated C iv absorption in NGC 5548 using the IUE monitoring data. A clear anti-correlation between the continuum luminosity and the C iv absorption line equivalent width is visible in their data. Using the 4 days (sampling interval) limit on the absorption line variability they estimated the electron density, . Mathur et al. (1995) have studied the HST FOS spectra of NGC 5548 observed as a part of the AGN watch program during 1993 with a sampling interval of 1 day. They did not find any change in the equivalent width of C iv absorption, within measurement errors, in spite of a factor 1.5 variation in the UV continuum flux. However they have noted that the data is consistent with expected variability in the C iv equivalent width, within measurement uncertainties. The high resolution studies of NGC 5548, with GHRS and STIS, have revealed multi-component structure of the absorbers. Also the absorption lines do not cover the background source (BLR+continuum) completely and each component has different covering factor. The variability in the equivalent width might have some contribution from the varying covering factor (Srianand & Shankaranarayanan, 1999).
5.3 Spectral energy distribution on NGC 5548:
It is known that the optical-UV continuum in NGC 5548 is variable and flattens when the object brightens. However there is little simultaneous observations of NGC 5548 in various wave bands and the change in the spectral energy distribution as a function of source luminosity is unknown. Dumont et al.(1998) have provided detailed discussion on spectral energy distribution of NGC 5548. In this study we use the continuum used by Dumont et al (1998). Assuming , and redshift of NGC 5548 to be 0.0175 we estimate the value of from the flux in the range 1 to 20 Ryd. Note that the spectrum we reconstruct from the observations need not be the one seen by the absorbing clouds. As noted by Dumont et al. (1998), we should keep in mind that whole continuum distribution in the observed range is determined within about a factor two of uncertainty ( and a large factor in the Extreme UV range), owing to temporal variation.
5.4 Ion column densities:
Ultraviolet spectra of NGC 5548 observed with the Hopkins Ultraviolet Telescope (Kriss et al. 1997) show no Lyman limit at the systemic redshift. This suggest that in individual components. The Voigt profile fits gives lower limit on the as we do not know the exact value of the covering factor. The in the individual components obtained from the profile fits vary between to . From the absence of C ii absorption we estimate the 2 upper limit on to be . The lower limit on the C iv column density derived from different components in the high- system varies between 2 to . Similarly, the lower limit on the column density of N v is in the range 2 to 4. It is interesting to note that N v column densities in all the components are higher than C iv . If the heavy element abundance ratios are like solar this will mean high degree of ionization. However excess N abundances are known in high- QSOs (Hamann, 1999; Petitjean & Srianand, 1999) and the observed ratio could be due to the excess [N/C]. Other possibility for getting the higher values of N(N v) could be the difference in the covering factor for N v and C iv (Petitjean & Srianand, 1999). ROSAT PSPC observations by Nandra et al.(1993) have confirmed the soft X-ray absorption by ionized gas in NGC 5548. Reynolds (1997) has obtained = 0.240.04 and = 0.160.03 by fitting the observed ASCA spectrum using and . The model fits to the ASCA data investigated by George et al.(1998) suggest that the warm absorbing material is completely covering the X-ray continuum emitting region. If we assume complete coverage then the estimated column densities are and . Done et al. (1995) using the ROSAT spectra obtained a lower limit on the electron density in the warm absorbers to be 5. Unlike UV spectrum the X-ray spectra is of lower resolution and it is very difficult to get the optical depth contributed by individual components, we detect in the UV spectra.
6 Results of the model calculations:
We use the photo-ionization code cloudy (Ferland,1996) to get the ionization conditions in a typical absorbing cloud. We consider the absorbing cloud to be plane parallel slab of uniform density with chemical composition similar to that of solar composition. The ionizing radiation is assumed to be similar to the one used by Dumont et al(1998) and assume to shine on the cloud from one side. We run grids of photo-ionization models covering -2.01.00 and stopped the code when the column density of neutral hydrogen reaches a given value. In this work we discuss the results obtained when is 1015 (model A) and 10 (model B) respectively. The model results are plotted in Fig 3. The panels (a) and (b) give the column densities of various ionization states that are detected in the associated system as a function of ionization parameter. In the range of ionization parameter considered here, the C ii column density is well within the upper limit we get from the non-detection. Also the resulting N v column densities are higher than that of C iv . The horizontal lines in both the panels show the lower limit on the column densities of O viii and O vii so that the optical depth is equal to one tenth of the measured optical depth. Fig 3 suggests, in order for UV absorber to contribute at least 10% of the optical depth of Oxygen edges, that (model A) and (model B). If only one of the clouds produce all the observed optical depth of ionized Oxygen edges then (model A) and (model B). In the case of model A, such a cloud will not produce detectable amount of C iv and N v column densities as in the case of the sub-components in the low- system (if the abundance ratios are solar). However in the case of model B, in a narrow range of ionization parameter, one can get a consistent solution for the UV as well as ”warm absorbers”.
The column densities of various ionization states of H, He, C, N and O, resulting from our models, are stored in an array and are used to estimate the equivalent widths of different transitions. We also store the total column density of hydrogen resulting from the models. We consider the Doppler broadening and natural broadening of lines (Voigt profiles) while calculating the equivalent widths. We estimate the radiative acceleration due to line absorption using the column densities of H i, He i, He ii and all possible ionization states of O, N and C. We use , , , redshift of the AGN, . The results presented in Fig 3 assume the velocity dispersion to be 25 . The acceleration due to gravity and the radiation pressure are calculated assuming the mass of the central engine to be and . The net acceleration as a function of ionization parameter are plotted for a range of densities for the two cases (see panels c-f Fig.3). The allowed range in the acceleration, from the observations, are given by the horizontal dotted lines. Positive values of the acceleration means the radiative acceleration dominates and the negative values represent the gravitational deceleration.
When mass of the central engine is , radiative acceleration dominates when the ionization parameter (model A) and (model B). Note that such a cloud will have the optical depths of O vii and O viii less than 0.01 and could not make appreciable contributions to the observed optical depths. Decreasing the mass of the central source will increase the upper limit on . Note that when we consider a small range is allowed in where the cloud can contribute one tenth of the observed optical depth of the Oxygen edges. However if all the Oxygen edge optical depths are due to single cloud then the cloud’s motion will be dominated by the radiative acceleration due to line absorption only when . Such a low values of the mass are not allowed by the observations.
When we consider , observational constraints on the change in velocity allows an extremely narrow range in when . Also this demands a near critical balance between the radiative acceleration and the gravitational deceleration, which requires extreme fine tuning. Also such a balance can not be maintained when the ionizing continuum changes as in the case of NGC 5548. Thus it is more likely that the density of the absorbing cloud has to be less than when . This will mean the distance of the cloud from the central source has to be higher than 20 lt days (for ). Transfer function derived from the HST monitoring data suggest that the region of C iv emitting clouds streaches from 1 lt-day or closer, out to 10 lt-day are further (Done & Krolik, 1996). Thus the locations of the clouds with N(H i) will be the outer regions of the BLR. Note that the Voigt profile fits to the components suggest that the in individual components are less than . However, as discussed before, due to unknown degree of saturation and covering factor the column density derived will be a lower limit only. The Ly line of the low- system is well resolved and, as can be seen from Fig 1, the lines do not show any signature of saturation (flat bottom) and it is more likely that the in the individual components. Thus the location of such a cloud will be between the BLR and NLR. However the change in the velocity for these clouds are not measured due to poor S/N in the GHRS & STIS data.
When we consider , critical balance is needed only for . This means the distance of such a cloud from the central engine has to be higher than 2 lt days (for ). Note that some of the components in the high- system could have such large column densities. However the C iv and N v profiles of these components suggest that these clouds cover more than 80% of the BLR and have to be outside the BLR. Thus we believe even in these clouds.
In all our calculations we consider the effect of the continuum radiation alone. However if the absorbing clouds are outside the BLR then the line photons from the emission line clouds could also contribute to the radiative accleration. Specially C iv and Ly emission lines are very strong and the excess contribution to the accleration due to these lines could be appreciable. Also this effect will be larger for the high- system. In order to keep our analysis simple we do not include the effect of the emission lines in the radiative acceleration.
7 Implications of line-locking in NGC 5548
In order for the line locking to occur the radiative acceleration should contribute appreciably to the net acceleration of the cloud. As discussed before the locking among different sub-components in absorption occures at the velocity difference corresponding to the velocity splitting of C iv doublet. This means the fractional acceleration contributed by the C iv1550 absorption line is important. Since the locking occures at different velocities with respect to AGN it is clear that the case we have to consider is non-steady state line locking. Also if the continuum source varies it will be easy to preserve the locking under the non-steady state conditions. In Fig. 4 we plot the fractional acceleration contributed by the C iv1550 absorption in different case under consideration. As most of the important transitions are saturated effect of velocity dispersion is important. In Fig 4, we plot the results for two different values of the velocity dispersion parameter in order to get the feel for the dependence of radiative acceleration on our choice of velocity dispersion. Note that these curves are independent of the choice of . In the range of ionization parameter where the radiative acceleration dominates C iv1550 absorption contributes up to 4% of the net acceleration. The maximum contribution of the C iv1550 line to the acceleration occurs when there is a near balance between the gravitational acceleration and the radiative acceleration. Locking at such ionization parameters are very unstable against a small changes in the intensity of the ionizing continuum.
Let and are the net acceleration of two clouds along our line of sight (with ). Let be the fractional acceleration contributed by the C iv1550 absorption in cloud 2. At the locking,
| (9) |
If the ionizing continuum is same for both the clouds (i.e. cloud 1 is optically thin to the continuum radiation) then the difference in acceleration between two clouds can be achieved by changing , , and . Note that the total acceleration is directly proportional to the produce . In order to achieve the locking the cloud which is getting locked (cloud 2) should be further away from the source compared to the cloud which produces locking (cloud 1). This demands,
| (10) |
where superscripts and are used to represent the first and second cloud respectively. This condition suggests that if the ionization parameter of the locking cloud is less than or equal to that of the locked cloud (i.e ) then the density of the locking cloud should be higher than that of the locked cloud (). In order to understand the range of parameters one needs to get the locking we consider the following cases.
-
•
case i: If we assume N(H i) for locking cloud is less than or equal to that of the locked cloud, and if is less than then will be always greater than in the range of ionization parameters relevant to this study. Thus in order for the locking to occur .
-
•
case ii: If we assume N(H i) for locking cloud is greater than or equal to that of the locked cloud, then will be much higher than . However in order to produce locking at the C iv velocity splitting, the difference in the acceleration between the clouds should be equal to the acceleration of cloud ’b’ due to C iv1550 absorption. This condition suggest, in the range of relevant to this study, will be equal to or slightly less than in order for the line-locking to occur at the C iv doublet splitting.
In the case of NGC 5548 the locked clouds (low-) most probably have a lower H i column density than the locking cloud (high-). As discussed above the of the low- system should be equal to or less than that of the high- system in order to produce line-locking. Though we do not have stringent limit on the change in the velocity of the low- system, due to poor S/N, in the wavelength range of the C iv absorption, the above condition suggests that the density of the low- system is less than . From Fig 3 it is clear that in the range of ionization parameter, where the radiative acceleration dominates, the optical depth of O vii and O viii in the clouds are much lower than the observed value. Though low values of central mass can produce solutions with radiatively accelerated clouds with appreciable optical depths of O vii and O viii, the fractional acceleration contributed by C iv1550 in such a clouds are negligible. Thus the clouds which are showing line-locking with C iv doublet splitting are most probably not responsible for the observed ionized Oxygen edges.
8 Discussion:
HST observations of nearby AGNs suggest that of the seyfert 1 galaxies do show associated absorption systems (Crenshaw et al., 1998). Invariably, in all cases is less than , suggesting a component of out-flowing, highly ionized, optically thin gas, close to the centers of seyfert galaxies. The strong absorption components have cores that are much deeper than the continuum flux levels, indicating that the regions responsible for these components lie completely outside the BLR. This result is supported by the derived covering factors for few systems (NGC 3516, NGC 3783, NGC 4151, NGC 5548, Mrk 509) using the high resolution data (Crenshaw et al., 1998), and the constancy of the wavelength of the absorption lines over a period of few years seen in few systems (NGC 5548 (this work) and NGC 4151 (Weymann et al. 1997)). Presence of signatures of line-locking, in NGC 5548, suggest that the radiative acceleration plays (or played) a vital role in accelerating the clouds. Note that even in the case of NGC 4151 some of the narrow components seem to have velocity splitting close to the C iv doublet splitting (see Fig 5. of Weymann et al. 1997).
The 1993 monitoring campaign on NGC 5548 (Korista et al. 1996) revealed a red/blue symmetry between the blue and red line core light curves of the C iv emission. However no such relationship is seen between the blue and red wing light curve suggesting a possible radial motions for emitting clouds with large velocities. Done & Krolik (1996), noted that the response function for the red and blue cores are nearly identical, and the red wing response has a strong peak at small lags but the blue wings response raises only very slightly toward zero time delay. This indicates, if we assume all the emitting cloud to have a positive response, that there is more material near the line of sight and/or at small radii that is traveling away from us than is traveling towards us.
Detail studies of UV emission lines in NGC 5548 provide some indirect evidence for the presence of optically thin line emitting clouds. Sparke(1993) finds that gas with negative response is required, at small time delays, to explain the shape of the cross-correlation function for several lines in the case of NGC 5548. Koen(1993) finds evidence for negative instantaneous response of Si iv and C ii lines to the UV continuum variations.Various implications of the presence of such optically thin components are discussed by Shields et al. (1995). Observations discussed here clearly suggest that there is a component of optically thin gas, which are most probably present just outside the BLR, with net outward velocity. As the densities are high the cloud will respond to the continuum variations instantaneously. The C iv line emission from these clouds will have negative response to the continuum variations. If the volume filling factor of such clouds are high then they are expected to contribute appreciable to the total C iv emission. The slow response towards the zero time lag in the case of blue wing could be due to the instantaneous negative response of small fraction of optically thin clouds close to our line of sight. If these clouds are far away from the central continuum source and have radial outflows, like the individual components in the absorption systems, then they will affect only the blue wing response function at short time delays. However these clouds can contribute appreciable amount to the response function of the red wing at higher time delay.
It is interesting to note that the response functions derived for total C iv as well as red wing of the C iv emission show minima (even negative response) at a delay time of days (Done & Krolik, 1995). Similar result is also obtained by Wanders et al. (1995) using different numerical method. They interpreted this as an evidence for bi-conical structure in the emission line region. However this result is also consistent with our expectation in the case of presence of radially out-flowing optically thin gas in the outer regions of the BLR. Though there are models of BLR with optically thin as well as optically thick clouds are discussed in the literature (Goad et al. 1995), optically thin clouds are considered very close to the central source. It will be an interesting and important exercise to build models of BLR with optically thin clouds in the outer regions as suggested by the absorption line studies.
9 Summary
We study the multiple velocity component structure in the associated absorption system in NGC 5548 using HST high resolution spectra. Most of the narrow components in the associated systems show the signature of line-locking with velocity separation equal to C iv doublet splitting. Using the spectra observed at two different epochs separated by yrs we estimate the upper limit on the acceleration of individual clouds. We construct grids of photo-ionization models and estimate radiative acceleration due to line absorption by various transitions. Using the constraints on the ionization parameter, acceleration, covering factor and the conditions to be satisfied for the line-locking, we show that (a) the density of the cloud is less than 10, (b) the clouds are situated out side the BLR, (3) the clouds involved in the line-locking can not be responsible for the observed ionized Oxygen edges in the soft X-ray. We discuss the implications of the presence of optically thin clouds in the outer regions of the BLR. Lack of information on the ionization conditions of the clouds prevents us from making a more realistic models of the line-locked clouds. We believe, future UV observations of NGC 5548 using FUSE will provide better constraints on the ionization parameters of the individual components, which can be used to get a more realistic models.
References
- (1) Braun, E. & Milgrom, M. 1989, ApJ, 342, 100.
- (2) Clavel et al. 1992, ApJ, 393, 113.
- (3) Crenshaw, D. M. & Kraemer, S. B. 1999, astro-ph/9903439.
- (4) Crenshaw, D. M. et al. 1998, ApJ, 516, 750.
- (5) Done, C., & Krolik, J. H. 1996, ApJ, 463, 144.
- (6) Done, C., Pounds, K. A., Nandra, K. & Fabian, A. C. 1995, MNRAS, 275,417.
- (7) Dumont et al. 1998, A&A, 331, 11.
- (8) Ferland, G. J. 1996 HAZY, A brief introduction to Cloudy, University of Kentucky, Department of Physics and Astronomy, Internal Report.
- (9) George, I. M. et al. 1998, ApJS, 114, 73.
- (10) Goad, M. R., O’Brien, P. T., & Gondhalekar, P. M. 1993, MNRAS, 263, 149.
- (11) Hamman, F. 1997, ApJS, 109, 279.
- (12) Hamman, F. 1999, astro-ph/9812216.
- (13) Khare, P., et al., 1997, MNRAS, 285,167.
- (14) Koen, C. 1993, MNRAS, 262, 823.
- (15) Korista, K., et al., 1996, ApJ, 461, 641.
- (16) Kriss et al. 1997., Emission Lines in Active Galaxies: New Methods and Techniques; IAU Colloquium 159., Ed. Bradley M. Peterson, Fu-zhen Cheng, and Andrew S. Wilson., p.453
- (17) Krolik, J. et al., 1991, ApJ, 371, 541.
- (18) Mathur, S., Elvis, M., & Wilkes, B. 1995, ApJ, 452, 230.
- (19) Mathur, S., Elvis, M., & Wilkes, B. 1999, ApJ, 519, 605; astro-ph/9901275.
- (20) Peterson, P. 1993, PASP, 105, 247.
- (21) Petitjean, P., Rauch, M. & Carswell, R. F., 1994, A&A, 291, 29.
- (22) Petitjean, P., & Srianand, R. 1999, A&A, 345, 73.
- (23) Pogge, R. W., & Peterson, B. M. 1992, AJ, 103, 1084.
- (24) Reynolds, C. S. 1997, MNRAS, 286, 513.
- (25) Shields, J. C., Ferland, G. J., & Peterson, B. M. 1995, ApJ, 441,507.
- (26) Shull, J. M., & Sachs, E. R. 1993, ApJ, 416, 536.
- (27) Sparke, S. L. 1993, ApJ, 404, 570.
- (28) Srianand, R. & Shankaranarayanan, S. 1999, ApJ, 518, 672; astro-ph/9901091.
- (29) Sun, W. & Malkan, M. A. 1989, ApJ, 346, 68.
- (30) Wanders, I. et al. 1995, ApJ, 453, L87.
- (31) Weymann, R.J., Morris. S. L., Foltz, C. B., & Hewett, P. C. 1991, ApJ, 373, 23.
- (32) Weymann, R.J., Williams, R. E., Peterson, B. M., Turnshek, D. A. 1979, ApJ, 234, 33.