Dynamics of Circumstellar Disks II: Heating and Cooling
Abstract
We present a series of 2-dimensional () hydrodynamic simulations of marginally self gravitating (=0.2, with and with disk radius and 100 AU) disks around protostars using a Smoothed Particle Hydrodynamic (SPH) code. We implement simple and approximate prescriptions for heating via dynamical processes in the disk. Cooling is implemented with a simple radiative cooling prescription which does not assume that local heat dissipation exactly balances local heat generation. Instead, we compute the local vertical () temperature and density structure of the disk and obtain ‘photosphere temperature’, which is then used to cool that location as a black body. We synthesize spectral energy distributions (SEDs) for our simulations and compare them to fiducial SEDs derived from observed systems, in order to understand the contribution of dynamical evolution to the observable character of a system.
We find that these simulations produce less distinct spiral structure than isothermally evolved systems, especially in approximately the inner radial third of the disk. Pattern amplitudes are similar to isothermally evolved systems further from the star but do not collapse into condensed objects. We attribute the differences in morphology to increased efficiency for converting kinetic energy into thermal energy in our current simulations. Our simulations produce temperatures in the outer part of the disk which are very low ( K). The radial temperature distribution of the disk photosphere is well fit to a power law with index . Far from the star, corresponding to colder parts of the disk and long wavelength radiation, known internal heating processes ( work and shocks) are not responsible for generating a large fraction of the thermal energy contained in the disk matter. Therefore gravitational torques responsible for such shocks cannot transport mass and angular momentum efficiently in the outer disk.
Within 5–10 AU of the star, rapid break up and reformation of spiral structure causes shocks, which provide sufficient dissipation to power a larger fraction of the near infrared radiated energy output. In this region, the spatial and size distribution of grains can have marked consequences on the observed near infrared SED of a given disk, and can lead to increased emission and variability on year time scales. The inner disk heats to the destruction temperature of dust grains. Further temperature increases are prevented by efficient cooling when the hot disk midplane is exposed. When grains are vaporized in the midplane of a hot region of the disk, we show that they do not reform into a size distribution similar to that from which most opacity calculations are based. With rapid grain reformation into the original size distribution, the disk does not emit near infrared photons. With a plausible modification of the opacity, it contributes much more.
1 Introduction
In the early stages of the formation of a star (see the review paper of Shu, Adams & Lizano 1987), a cloud of gas and dust collapses and forms a protostar with a disk surrounding it. Later on, while the accretion from the cloud continues, the star/disk system also begins to eject matter into outflows whose strength varies in time. Finally, accretion and outflow cease and over the next million or so years the star loses its disk and evolves onto the main sequence. A major refinement of this paradigm over the past decade has been to account for the formation of multiple objects from a single collapse. While this picture provides a good qualitative picture of the star formation process, many important issues remain poorly understood.
Once a well developed star/disk system evolves, whether as a single star or a multiple star system, the dynamics of the disk itself as well as its interaction with the star or a possible binary companion become important in determining the system’s final configuration. Depending on the mass and temperature of a disk, one may expect spiral density waves and viscous effects to develop and play roles of varying importance. Each may be capable of processing matter through the disk as well as influencing how the disk eventually decays away as the star evolves onto the main sequence.
Until recently the primary observational evidence for circumstellar accretion disks has been the existence of sources with strong infrared excesses which extend from the near infrared to submillimeter and millimeter wavelengths. A number of papers (Adams, Lada & Shu 1987, 1988, Adams, Emerson & Fuller 1990, Beckwith et al. 1990–hereafter BSCG, Osterloh & Beckwith 1995) have successfully modeled these excesses assuming a geometrically thin accretion disk with or without additional circumstellar material. Other recent observations (Roddier et al. 1996, Close et al. 1997) have used adaptive optics to image the disks of several young star systems. Other disk systems (so called ‘proplyds’) have been observed in the Orion molecular cloud with the Hubble Space Telescope (O’Dell & Wen 1994, McCaughrean & O’Dell 1996) in silhouette against the bright cloud background or through interactions with winds from nearby massive stars.
With these direct and indirect observations it has become clear that disk systems are quite common around young stars. Many efforts to model the dynamical processes involved in their formation (Laughlin & Różyczka 1996, Bonnell & Bate 1997) and evolution (Nelson et al. 1998, hereafter Paper I , Boss 1997, Artymowicz & Lubow 1996, Pickett, Durisen & Link 1997) have so far resulted only in a summary of what is possible rather than strong limits on what types of evolution are impossible. Many gaps remain in the understanding of the physical processes important in different regimes and even in the configurations of systems at various points in their history.
Other efforts have been applied to modeling the spectral energy distributions (SEDs) of young stellar systems. The SEDs of passive disks (i.e. those disks which only reprocess radiation from the central star) have been successfully modeled in recent work by Chiang & Goldreich (1997). Axisymmetric models of a disk and a mixing length approximation for the vertical structure (Bell & Lin 1994-hereafter BL94, Bell et al. 1995, Bell et al. 1997-hereafter BCKH) have been used to model the most dynamic properties of disks seen in FU Orionis stars. Time dependent radiative transport calculations (Simonelli, Pollack & McKay 1997, Chick, Pollack & Cassen 1996) have also been incorporated into calculations of the structure of infalling gas and dust. They model the destruction of grains in material falling onto the star/disk system from the surrounding circumstellar cloud and find that under many conditions grains can be partially or totally destroyed prior to their accretion into the star/disk system. Heating mechanisms in the cloud and infalling envelope are of comparable effectiveness in heating the grains as in the accretion shock itself.
Paper I showed that in the limit of a disk modeled with a locally isothermal equation of state, spiral arm formation and later collapse into clumps totaling at least a few percent of the disk mass was prevalent in all disks whose minimum initial Toomre stability was . Boss (1997) and Pickett et al. (1998) have concluded that a locally adiabatic equation of state will also produce spiral arm collapse as instabilities grow. Each of these works are limited in the sense that a predefined temperature law is assumed: the gas is locally isothermal or locally adiabatic, but is not globally isothermal or globally adiabatic. In this approximation, any radial motion of gas within the disk causes the parcel of gas to heat or cool, even if no other processes occur to change its state. Compression and shock events are likewise artificially managed. Heating and cooling are instantaneous, but only act when the state of the gas deviates from a predefined ‘steady state’ value.
We present a series of two dimensional (radius and azimuth) numerical simulations using Smoothed Particle Hydrodynamics (SPH) modeled under the assumption that the disk is able to heat or cool depending only on local conditions within the disk. Our goal for this work is to understand the dynamical growth characteristics of instabilities in systems with heating and cooling incorporated into the models and to understand which heating and cooling mechanisms are likely to be responsible for which features in the spectral energy distributions of observed systems. In section 2, we summarize the initial conditions adopted for the disks studied. In section 3, we outline heating and cooling mechanisms included in our study and the numerical method used to determine their magnitude at each point and time in the disk. We describe the dynamical results obtained from our simulations in section 4 and the physical origin of the emitted spectra in section 5. In section 6, we compare our results to work in the literature and summarize their significance in the context of the evolution of stars and star systems.
2 Physical Assumptions
2.1 Initial Conditions
The initial conditions used in this work are quite similar to those used in Paper I . We refer the reader to that work for a more complete discussion and only summarize them here. At time zero we set equal mass particles on a series of concentric rings extending from the innermost ring at a radius of AU to either 50 or 100 AU depending upon the simulation (see table 1 below). With the number of particles used, smoothing lengths (i.e. the resolution) are less than a few tenths of one AU in the inner portion of the disk and up to 1 AU in the outer disk. The star is modeled as a point mass free to move in response to gravitational forces from the surrounding disk. The gravitational force due to the star is softened with a softening radius of AU and particles whose trajectories pass through this radius are absorbed by the star. Magnetic fields are neglected in our simulations.
The disk mass is initially distributed according to a power law:
| (1) |
while the disk midplane temperature is given according to a similar law:
| (2) |
where the exponents and are and , respectively, and and T0 are determined from the disk mass and a choice of the minimum value of Toomre’s stability parameter over the disk. is defined as:
| (3) |
where is the local epicyclic frequency and is the sound speed. The core radius for the power laws is set to =1AU.
Matter is set up on initially circular orbits assuming rotational equilibrium in the disk. Radial velocities are set to zero. Gravitational and pressure forces are balanced by centrifugal forces by setting
| (4) |
where is the gravitational potential of the disk and the other symbols have their usual meanings. The magnitudes of the pressure and self gravitational forces are small compared to the stellar term, therefore the disk is nearly Keplerian in character.
We use an accretion radius of 0.4 AU as a compromise between the numerical requirement that the integration time step not be so small that long period evolution cannot be followed and the desire to model as large a radial extent of the disk as possible. The exact size of the boundary region between the stellar surface and the inner disk edge is not well constrained, but is probably substantially smaller than 0.4 AU. For example, Shu et al. (1994) estimate that the inner edge of the disk should be between two and ten times the stellar radius. Coupling this with a stellar radius computed from pre-main sequence evolution (see e.g. D’Antona & Mazzitelli 1994, 1997) of , depending on age, gives an inner disk edge as small as 0.02 AU or as large as 0.2 AU. We will also perform a small number of simulations with an accretion radius of 0.2 AU in order to investigate what effects the inner boundary may have on the evolution.
2.2 The Equation of State
The hydrodynamic equations are solved assuming a vertically integrated gas pressure and a single component, ideal gas equation of state given by:
| (5) |
where is the ratio of specific heats, is the vertically integrated pressure and is the specific internal energy of the gas. Since we limit the motion of our particles to two dimensions (), the effective value of is different from that derived from a true three dimensional calculation (see e.g. the discussion of the equations of motion derived for a vertically integrated torus in Goldreich, Goodman & Narayan 1986). For the systems we study, we have taken a simpler approach by assuming that only two translational degrees of freedom exist for each molecule. Helium is included as a monatomic ideal gas and metals are neglected. Coupled with the assumption that the gas is of solar composition, this means the effective value of is no longer the well known , but rather
| (6) |
This value includes the contribution of hydrogen with its rotational degrees of freedom active ( K) but its vibrational degrees of freedom inactive ( K). This value will be most representative of moderate temperature regions of the disk. In three dimensions, .
3 Thermal Energy Generation and Dissipation
In this work we relax the common practice (see e.g. Paper I , Pickett et al. 1998, Boss 1997) of predefining the temperature or adiabatic constant, , at each location in the disk. Instead, we allow thermal energy to be generated by internal processes and we allow the disk to cool radiatively at a temperature solely dependent upon local conditions at a given time. Thermal energy may be generated in one location in the disk but be dissipated somewhere else if matter moves there, or the disk may heat up or cool down over time in a single location. The disk may therefore equilibrate to the internal energy state that the physical evolution of the system requires.
In our simulations, we only require that the disk be in instantaneous vertically constant entropy equilibrium and instantaneous vertical thermal balance in order to determine its structure. We do not require it to be in long term vertical thermal balance. With the latter assumption, the radiative cooling rate at each point is defined to be equal to the local heating rate from internal processes (see e.g. Frank, King & Raine 1992 section 5.4). In some cases, the assumption also includes energy flux radiating onto the disk from outside, so that the radiative cooling rate includes terms due to both internally generated energy and passive reprocessing. Accurate quantification of the relative contributions of each of these terms is critical because by working backwards from observed spectral characteristics of the disk an observer can derive an evolutionary picture of the mass and angular momentum transfer through the system. For example, if radiation emitted by a disk comes entirely from passive reradiation, then no mass or angular momentum transport can occur, since such transport is due to internal dissipation of kinetic energy in the disk. Therefore, if the contributions due to one or more sources of the emitted radiation are incorrectly determined, an evolutionary picture derived from them will be flawed. In the present work, we will neglect passive heating and reradiation in favor of accurately quantifying internal heating mechanisms in the disk. Here we outline the physical basis for the heating and cooling processes incorporated into our simulations.
3.1 Thermal Energy Generation
Thermal energy in the disk is generated in our simulations from bulk mechanical energy via viscous processes and shocks. We model the energy generation using an artificial viscosity common in many implementations of hydrodynamic codes. Because the balance between thermal energy generation and dissipation are important for both the observed character of the systems as well as their morphology and dynamics, we outline our implementation here. In the following section (section 3.1.1), we also outline the physical interpretation of its effects on our simulations and the basis for conclusions about physical processes that can be drawn from these effects. We refer the reader to one of the many discussions already in the literature (e.g. Benz 1990, Monaghan 1992) for more complete treatment.
The standard form of artificial viscosity used in numerical hydrodynamic codes takes the form of an added artificial viscous pressure to the energy equation. In the SPH formalism the energy dissipation due to this additional term is the sum of contributions from all neighbor particles, , on particle as
| (7) |
where and are the velocities of each particle, is the mass of the th particle and is the value of the SPH kernel calculated between the two particles. The factor 1/2 in eq. 7 accounts for half of the kinetic energy dissipation being added to each particle. The term is the viscous pressure and the other terms together compose the volume element, , in the viscous work . An analogous term enters in the momentum equation, so that momentum and energy may be properly coupled.
The viscous pressure, , is given by a sum of two terms which are linear and quadratic in the velocity divergence. The form of these terms is determined by the desire to model correctly strong compressions while reducing numerical oscillations in the flow (see below). Mathematically, is
| (8) |
where and are the positions of each particle, is the sound speed and is the mean surface density. These two terms are the so called ‘bulk’ or ‘’ 111Note that we have used the symbol to denote the bulk component of artificial viscosity in order to distinguish it from the Shakura & Sunyaev (1973) turbulent viscosity parameter, . viscosity and the ‘von Neumann-Richtmyer’ or ‘’ viscosity. The velocity divergence is defined by
| (9) |
where is a small value to prevent numerically infinite divergence as particles come very close and is the average of particle and particle ’s smoothing lengths. The and terms are due to Balsara (1995) and are defined by
| (10) |
Equations 7–9 are little more than a restatement of the standard form of artificial viscosity for SPH as discussed in Benz (1990). The standard form, while adequate for many problems, is well known to produce a large and unphysical shear dissipation as a side effect in disk simulations like those in our study. Such dissipation arises because in order to more closely model the physical effects of shocks with the code, the divergence is calculated pairwise between particles rather than as an average over the nearest neighbors (Gingold & Monaghan 1983). In a Keplerian disk, particles at different radii have nearly parallel trajectories but different velocities, which produces the numerical result that they appear as if they are approaching (false compression) each other or receding (false expansion) from each other. Another side effect is that the standard formulation produces dissipation nearly everywhere in the fluid rather than only in regions in which it is required. Numerical modeling of an adiabatic compression is impossible with artificial viscous terms included for example.
The specific form of the terms in eqn. 7–9 are quite arbitrary. Any improvements to them which decrease the importance of unphysical side effects, while retaining the required stability and dissipative effects of the code, are desirable. We incorporate two adaptations which improve the performance of the code by reducing these side effects.
First, we modify the computation of the velocity divergence from its usual form by including the factors and in eq. 9. These factors act to reduce shear viscosity. They are near unity when the flow is strongly compressive, but near zero in shear flows. For the simulations we have performed we find that typically the reduction due to this term is a factor of three or better. The second improvement is due to Morris and Monaghan (1997). They implement a time dependence to the coefficient which allows grow in regions where it is physically appropriate (strong compressions) and decay in quiescent regions where it is inappropriate. The decay takes place over at distance of a few SPH smoothing lengths, after which the coefficient stabilizes to a constant, quiescent value. In our formulation, which includes both the and terms, we define the ratio , but allow their magnitudes to vary in time and space according to the Morris & Monaghan formulation. Thus, except in strongly compressing regions (shocks) where it is required to stabilize the flow, artificial viscous dissipation is minimized.
3.1.1 The origin and physical meaning of artificial viscosity
The physical reason for including an artificial viscosity into a numerical code is that in real systems, dissipation of kinetic energy into heat occurs on scales which are much smaller than the numerically resolvable scale of the system. Shock dissipation for example occurs over a few mean free path lengths of the molecules in the fluid, a size at which even the fluid assumptions of the hydrodynamic equations break down. Without the addition of additional, artificial terms to the finite difference equations, such dissipation would not be included. The results obtained from such an omission are in general numerically unstable.
The solution of choice has been to include macroscopic dissipation terms (the viscous pressure above) to model the microscopic dissipation. The form of the two terms making up is motivated first by the fact that dissipation must be introduced to the system in order to reproduce the hydrodynamic quantities in shocked regions. The term in eq. 8 provides a functional dependence of the viscous coefficient (usually denoted ) itself on the velocity divergence present in the flow. In this way, the magnitude of the dissipation becomes dependent upon a low order approximation of the discontinuity present in a shock.
Without additional correction unphysical oscillations can still develop in the flow, due to the low order finite differencing in the numerical solution of the hydrodynamic equations. To damp out such oscillations, a second term (the term in eq. 8) is introduced which acts diffusively. With this in mind we note that, while the von Neumann-Richtmyer term may have some approximate physical basis, its counterpart bulk term can only be considered a necessary nuisance.
Although we may properly regard both terms as nuisances, since they do not directly model any physical process, with caution we can turn artificial viscosity into a useful nuisance. We have already identified the von Neumann-Richtmyer term as a low order representative of shock dissipation. We can make a similar identification of the bulk viscosity as a ‘black box’ source of dissipation in the system like the ad hoc ‘’ model of Shakura & Sunyaev, which uses a single parameter, , to model the effects of turbulence. A correspondence (Murray 1995, 1996) exists between the standard form of dissipation and the bulk artificial viscosity implemented in our simulations. In two dimensions the correspondence can be expressed for particle as
| (11) |
where the index refers to the th particle, is defined by eq. 10, is its bulk viscosity coefficient, is the orbit frequency, is the sound speed of the particle and is its smoothing length.
The conversion to an ‘’ in our work is different from the standard Shakura & Sunyaev form in several ways. It is both time and space dependent, in contrast to the usual form of a constant everywhere or (in a few cases), variation between an ‘on’ and ‘off’ state. The conversion neglects the contribution due to the von Neumann-Richtmyer term and so by itself represents only an incomplete approximation of the magnitude of the total dissipation present. Finally, it also neglects the Morris & Monaghan time dependence of the viscous coefficients noted above. In the context of attempting to identify the source of the dissipation, this means that if a region experiences repeated compression events or shocks on short time scales, the dissipation would be accounted for as a turbulent process rather than as a shock process. In this case, a short time scale means that the gas travels only a few SPH smoothing lengths before experiencing another compression. Nevertheless, we find that it proves useful as an illustration of where and to what extent thermal energy generation processes are active.
3.2 Thermal Energy Dissipation and the Vertical Structure of Accretion Disks
The cooling experienced by a given particle is determined first by calculating the approximate vertical density and temperature ( structure of the disk. Then, using these quantities we determine the altitude of the disk photosphere and cool the particle as a blackbody whose temperature is the calculated photosphere temperature.
In order to calculate and without a full three dimensional hydrodynamic calculation we make two assumptions about the disk structure. We assume that at each location the disk has some degree of turbulence or convection so that it becomes very nearly adiabatic in the direction (i.e. that with and constant). We also assume that it is locally plane parallel. In this limit, Fukue & Sakamoto (1992) have shown that and at a known distance from the star can be determined from the solution of the second order, ordinary differential equation
| (12) |
A known midplane density, , the distance from the star, , the adiabatic constant, , and the ratio of specific heats, , define the conditions which completely specify the solution in the absence of external heating of the disk surface.
In our two dimensional simulations, each SPH particle is uniquely defined at some time by a particular value of internal energy, surface density and distance from the star. These three quantities correspond to the three conditions , and which specify the structure in . The distance from the star is, of course, the same for both the SPH and Fukue & Sakamoto specifications. Derivation of the quantities and from the surface density and internal energy must be done by iteration to convergence.
We supply an initial guess for and and solve equation 12 numerically for . The coordinate is discretized with 500 zones and the differential equation is solved numerically to second order accuracy. Once a tentative solution is reached, we integrate the density over using the trapezoid rule to derive the surface density of matter defined by the solution. Specific internal energy is obtained by a similar integration over the vertical extent of the disk. The guesses of and are then revised using the downhill simplex method to converge to a self consistent solution. Plots of the density and temperature structure as a function of the altitude, , are shown for several conditions typical of the disks in our simulations are shown in fig. 1.
Implicit in our calculation is the assumption that the gas is locally (and instantaneously) adiabatic as a function of . In an adiabatic medium, the gas pressure and density are related by and the heat capacity of the gas, , is a constant (by extension, also the ratio of specific heats, ). In fact, this will not be the case in general because, in various temperature regimes, molecular hydrogen will have active rotational or vibrational modes, it may dissociate into atomic form or it may become ionized. As a matter of expediency and in order to retain our prescription for the structure calculation, we have assumed that the rotational states of hydrogen are active, but that the vibrational states are not. Under this assumption and including the contribution due to helium, the effective value for the three dimensional adiabatic exponent of the gas is .
From the now known structure we derive the temperature of the disk photosphere by a numerical integration of the optical depth, , from to the altitude at which the optical depth becomes
| (13) |
In optically thin regions, for which at the midplane, we assume the photosphere temperature is that of the midplane. The photosphere temperature is then tabulated as a function of the three input variables radius, surface density and specific internal energy. At each time we determine the photosphere temperature for each particle from this table and cool the particle as a blackbody at that temperature. The cooling of any particular particle proceeds as
| (14) |
where is the Stefan-Boltzmann constant, and are the specific internal energy and surface density of particle and is its photospheric temperature. The factor of two accounts for the two surfaces of the disk. On every particle, we enforce the condition that the temperature (both midplane and photosphere) never falls below the 3 K cosmic background temperature. Finally, we investigate the effect of optically thin emission in some simulations by multiplying the flux by the optical depth, , in regions where the optical depth to the midplane is ).
We use Rosseland mean opacities from tables of Pollack, McKay & Christofferson (1985 hereafter PMC). Opacities for packets of matter above the grain destruction temperature are taken from Alexander & Ferguson (1994). We have chosen not to use the updated opacity models of Pollack et al. (1994) in this work. In part this is due to the fact that opacity tables including both and variation based on this work do not exist (D. Hollenbach, personal communication). As the authors note however, the opacity is only a weak function of density (entering primarily through the change in vaporization temperatures of various volatiles at different densities) and they produce a figure comparing the new opacity with that of the old for a single value of the density. The functional form derived by Henning & Stognienko (1996) to reproduce the Pollack et al. opacity also do not include full and dependence.
As we shall note in the sections ahead, it is exactly this vaporization of grains which we find to be an important factor in determining the character of the SED. We have therefore chosen to implement the old version of the opacities until such time as new tabulated values become available. In any case, the opacities derived from the new and old works (see Pollack et al. , fig. 6) are similar except in the temperature region between 200 and 450 K, where the Pollack et al. (1994) derivation exceeds the PMC value by a factor of about three. The effect on our calculations would be to slightly reduce the photosphere temperature in regions where the difference between the two versions becomes important.
3.2.1 Where this prescription fails, and an improvement
We will find in section 4.1 that SEDs synthesized from our simulations using the cooling prescription above fail to reproduce the short wavelength spectrum (near IR) of observed circumstellar disks. This wavelength regime corresponds to the portion of the disk in which the disk midplane temperatures are warm enough to sublimate grains. Our cooling prescription on the other hand, assumes both that the opacity source (grains) is evenly mixed with the gaseous disk material and that the grain size distribution everywhere is not substantially different from that of the interstellar medium distribution used to calculate the Rosseland opacities. Is the failure of our simulations to correctly reproduce observed disk SEDs due to the failure of these physical assumptions about the grain physics?
To address the first assumption we note that Weidenschilling (1984) has shown that grains smaller than 0.1–1 cm will be largely entrained in the gas in a turbulent disk and will therefore not settle to the midplane. Because the smaller grains provide the largest contribution to the opacity, we may assume that for the purposes of our model the grains are well mixed.
The second assumption (the size distribution of grains) proves much more difficult to address. Contained within our assumption of a vertically adiabatic disk structure is the fact that the adiabatic condition arises out of a convective or turbulent medium, which acts to smooth any entropy gradients that develop. In such a case, grains entrained in the gas should be processed through the midplane fairly frequently and, if the midplane temperature is hot enough, destroyed. As refractory materials are brought to higher altitudes where temperatures are lower, they will begin to reform into grains. If they reform quickly (compared to their vertical motion) into a similar size distribution to their original distribution, a narrow boundary region in which grains reform will delineate a hollowed out region within the disk as shown in figure 2a. On the other hand, if grain reformation is slow compared to speed of vertical motion then the region in which the grain size is modified from its original distribution becomes much wider (fig. 2b). In this case, calculations assuming one distribution of grains may not determine the true opacity.
These differences are important because of the common use of grain distributions similar to those given in Mathis, Rumpl & Nordsieck (1977 hereafter MRN) or Kim, Martin & Hendrys (1994) and used in many opacity calculations. Since the opacity is a function of the size distribution, modifying the distribution from some canonical value will result in differences in the calculated opacity. For example, PMC have shown (see their fig. 5) that a narrow size distribution with an average grain size of 0.1 m will produce Rosseland mean opacities which are reduced from the values obtained from their standard size distribution values by a factor of 10 at temperatures above about 150 K and an additional factor of ten above 600 K for grains of size 0.01 m. The differences comes because the grain size to wavelength ratio changes as the grain size changes. As the ratio changes from small to large, the calculations move from a Rayleigh scattering regime, to a Mie scattering regime and finally to a geometric optics regime. In each, the opacities produced from the calculations change in magnitude as different scattering and absorption processes vary in importance.
In appendix A we model the growth of grains under the assumption that the midplane temperature is hot enough that the grains are destroyed there. The result of that calculation is that the grain distribution does not return to a distribution similar to that used in most grain opacity calculations. Instead, at high altitudes grains are unable to grow beyond a few hundredths of a micron in size and at moderate altitudes to a few tenths of a micron on dynamical time scales of the inner disk. Power law distributions do not reform at any altitude.
A reduced opacity implies for our cooling prescription that the photosphere of the disk will be found at a lower altitude and therefore an increased effective radiating temperature will be obtained. Using the tabulated opacities to obtain the location and temperature of the photosphere will then underestimate the cooling which actually takes place. Furthermore, due to the higher effective radiating temperatures, the SED will be modified from its previous form as more radiation is emitted at shorter wavelengths.
We investigate the effect of a modified grain opacity by adapting our cooling prescription to include an additional assumption. In regions of the disk where the midplane is hot enough to vaporize grains, we assume that the grain opacity is temporarily reduced from its tabulated value by a constant multiplicative factor, , over the entire vertical column of disk matter above and below the midplane. In other regions of the disk we assume the opacity remains unaffected, so that the effective opacity is
| (15) |
where is the grain destruction temperature and is the disk midplane temperature. The disk photosphere temperature and altitude are calculated in the same manner as before, with the modified opacity replacing in eq. 13 above. The disk photosphere temperature therefore will increase in regions where the midplane temperature is hot enough to destroy grains and remain unaffected elsewhere.
In eq. 15, the factor is only applied when the midplane temperature is above the grain destruction temperature. Thus, the duration of the opacity modification is the time span for which the midplane temperature remains above the dust destruction temperature. Further, the modification affects the whole vertical column of material in the same way. The possibility does exist for further revisions of this prescription. For example, one could implement a buffer region of some finite vertical thickness over which the modification was applied or a modification factor, , which varied as a function of midplane temperature or of distance from the star. Ultimately, we believe that such additional parameters are of limited value in the present study because of our large ignorance of their exact values.
3.3 Synthesizing Observations
In order to connect the physical properties of our simulations of accretion disks to observable quantities in real systems we synthesize spectral energy distribution’s (SEDs) from our simulations. We calculate the SED using the derived black-body temperature of each SPH particle at a particular time. We assume that the disk is viewed pole on and then determine the luminosity of each particle at each frequency as
| (16) |
and of the disk by summing the contributions of all of the particles. In eq. 16, is the mass of particle , is its surface density and is the Planck function. The area factor is given as in order to avoid ambiguity in the surface area (i.e. the smoothing length and its overlap with other particles) defined for each particle.
Although we neglect the luminosity of the star as a source of energy input during the calculation, we include it in the post processed SED calculation. We assume the star contributes to the SED as a 1 blackbody with temperature 4000 K, both values are typical of observed T Tauri stars (see e.g. Osterloh & Beckwith 1995, BSCG, Adams et al. 1990). The star’s contribution is included primarily to make the visual comparison of our synthetic SEDs to observed systems simpler and to provide a constant physically meaningful calibration of the disk emission on the plot. We neglect the contribution to the luminosity which would be present due to the accretion of mass onto the star, and instead merely remove particles whose trajectory takes them inward beyond the defined accretion boundary. We expect these two sources of luminosity to contribute primarily to the optical and UV spectrum, while the disk will contribute primarily at longer wavelengths. Therefore, for our purposes, the disk luminosity will be well separated in frequency from both the stellar and star/disk boundary accretion luminosities.
Comparison of the results of our simulations with observed systems is an important step towards interpreting those results. However, the characteristics of SEDs from observed sources are quite diverse and a comparison our synthesized SEDs with any specific source would suffer from failures to duplicate features in an SED which may only be idiosyncrasies of a single object. Therefore, in order to make a comparison to observational data, we will compare with a ‘fiducial’ SED which we derive from observed systems in the literature. We construct these SEDs assuming that the radial dimensions of the disk are the same as the initial radial dimensions of our simulations. The temperature profile of the disk is given by a power law with exponent (i.e. ) and the total disk luminosity is . We derive the SED by summing the blackbody contribution of each radial ring, at each frequency. Finally, as in the synthesized SEDs above, we add a 1 , 4000 K stellar black body to the SED.
The total disk and stellar luminosities are obtained from the results of BSCG, who quote luminosities between about 0.5 and 2 for the star and 0.1 and 1.0 for the disk. Disk masses inferred from their observations are typically , similar to the disks in our study. We use a temperature exponent, , derived from the BSCG study and from the Osterloh & Beckwith (1995) study by using the approximate median of their fitted exponent values.
In figure 3, we show fiducial SEDs as described above assuming a temperature power law index of and disk radii of 50 AU and 100 AU. We also show SEDs for similar systems with a smaller ( AU) inner disk edge, rather than the AU usually assumed in our simulations. Both sets of SEDs show a gap in their near infrared emission corresponding to material assumed to be missing between the inner disk edge and the stellar surface, and so appear somewhat dissimilar to many observed SEDs. Since our purpose for these fiducial SEDs is to compare the flux from our simulated disks with the portion of flux which comes from the same spatial part of the disk as in observed system, this discrepancy poses no serious problem. The SEDs with the larger inner disk radius exhibits a gap between 1 and 10m and which is deepest at about 3m. The smaller inner disk radius exhibits emission which is enhanced by a factor two over that produced by the disks with =0.4 AU. At long wavelengths, the 100 AU fiducial SEDs exhibit emission further into the far infrared than their 50 AU counterparts, but are otherwise similar to the 50 AU systems.
3.4 Units: The Physical Scale of the System
The introduction of a cooling mechanism requires an introduction of a physical scale to the simulations. We shall assume quantities with values typical of the early stages of protostellar evolution. The star mass will be assumed = and the disk radius of either AU or AU as noted in table 1. Time units are given in either years or the disk orbit period defined by = which, with the stellar mass and disk radii given above is equal to about 500 or 1400 years for disk radii of or AU respectively.
4 The Simulations
Paper I showed that the character of disk evolution undergoes a marked change between disk masses of and . In this paper, we will concentrate on studies of a disk at the lower edge of this mass boundary. In the following discussion, we simulate the evolution of a disk with a mass ratio of and with an assumed initial minimum Toomre stability of , under varying physical assumptions. Initial parameters of our simulations are tabulated in table 1. The first column of the table represents the name of the simulation for identification. The second column defines the resolution (in number of particles) and column 3 the disk radius. The assumed opacity modification factor (see sections 3.2 and 4.1.1) is defined in column 4 and the total simulation time of each simulation in the remaining column. We examine the qualitative nature of the simulations first, then examine in detail the structures which form and their characteristics.
We have run three series of simulations under different assumptions about the heating and cooling mechanisms important for the disk. The first set of simulations proceed under the assumption that gas and grains exist in equilibrium everywhere in the disk and that the grain size distribution is well modeled by the distributions used in opacity calculations in the literature (e.g. PMC, Alexander & Ferguson 1994). Vaporized material, upon entering a region cool enough for it to form grains, does so instantly and in such a way as to reproduce its original grain size distribution, as defined by PMC. These simulations are denoted by a leading ‘a’ (100 AU disks) or ‘A’ (50 AU disks) in the simulation name in table 1.
The second set of simulations relaxes the assumption that refractory materials reform into their original size distribution quickly. Instead, we assume that they reform their original distribution slowly so that their size distribution and therefore their opacities may be modified from their original form. These simulations are denoted with a leading ‘B’ in table 1.
We have also run models of disks under the same ‘isothermal evolution’ assumption used in Paper I . In these simulations we assume a fixed temperature profile as a function of radius and a ratio of specific heats, , equal to unity. These simulations are denoted with a leading ‘I’ in Table 1. In each case, a capital letter refers to a disk with outer edge at 50 AU while a lower case letter refers to a disk with outer edge at 100 AU. In each case ‘lo’, ‘me’ and ‘hi’ refers to a simulation with low, medium or high resolution as defined in column 2, and with the ‘B’ simulations, the number 1–5 corresponds to an assumed opacity modification.
In the following sections we first describe the morphology of the systems as they evolve and the energy output they produce. We then describe the azimuth averaged thermodynamic structure produced by the evolution. Finally we close the section with a discussion of the origin of the differences between the results produced by isothermally evolved simulations as opposed to the ‘A’ and ‘B’ runs in our current study.
4.1 Morphology and Spectral Energy Distributions
Using the physical assumptions outlined above and cooling using the ‘A’ prescription we have completed a series of simulations with initial minimum Toomre . Snapshots of the evolution of simulation A2me are shown in figure 4 and of its synthesized SED in figure 5. As in our previous isothermally evolved simulations (Paper I ) growth of instabilities begins in the inner regions of a disk, engulfing the entire system over the course of about 1 . Initially, spiral structures develop in the inner disk, but are later suppressed by the heating which occurs there. The spiral structures which develop throughout the whole disk are multi-armed and change their shape and character over orbital time scales. At times they become somewhat filamentary, but in no case do they become as filamentary as in the isothermally evolved simulations of Paper I .
In order to make quantitative comparisons between systems evolved under different physical assumptions, we examine the amplitude of various spiral patterns during the simulations. We derive pattern amplitudes using the same procedure as in Paper I . We compute the amplitude of spiral patterns by Fourier transforming (in the azimuth coordinate) a set of annuli spanning the disk in radius. The amplitude of each Fourier component is then defined as , where is
| (17) |
for . The term is defined with a normalization of . With this normalization, the term is the mass of the disk and the amplitudes, , are dimensionless quantities.
As shown in Paper I , SPH cannot follow low amplitude growth of structure in disks. In a simpler test case in which a short duration linear phase was possible, the results produced from our SPH code and from a Piecewise Parabolic Method (PPM) code (which is able to follow low amplitude growth for longer periods) were similar. In both these test cases and disk evolution simulations the gross morphology of the SPH and PPM simulations were also similar. Therefore, apart from the inability to derive growth rates of spiral structures or assign linear growth modes to the system, we expect little effect on our results due to this characteristic of the SPH method.
In figure 6 we show the amplitudes at three radii for the pattern produced from an isothermally evolved simulation and the disk shown in figure 4. Short period variation occurs in the pattern amplitudes shown, but pattern growth has saturated to the extent that time averages of the amplitudes can be used to characterize much of the system. We derive the time average of a given pattern using the time interval between and , shown with solid horizontal bars. These limits are used in order to ensure than most of the disk has in fact reached its saturation amplitude (for the beginning limit), but has not evolved long enough to form clumps (in the case of the isothermally evolved runs). The time intervals used for both sets of runs are identical in order to ensure that the comparison can be as close as possible. For example, for the outer part of the disks, it is clear that the ‘A’ simulation reaches its highest amplitudes well after the isothermally evolved simulation forms clumps and cannot be evolved further. In order to make a fair comparison of the amplitudes we restrict the averages to the same time window.
As we found for the isothermally evolved disks studied in Paper I , the ‘A’ simulations (figure 6) also produce time variation of the pattern amplitudes on the same time scales as the orbital periods in the disk. The amplitude of the variation present at each radius is about a factor two above and below the mean amplitude. The time variation is important in a dynamical context because of the possible observational consequences. Dynamical variation produces heating from shocks as various portions of the disk collide with each other or break apart and reform. We will discuss the energy output obtained from our simulations, its origin and variation in section 5 below.
The time averaged amplitudes are shown as functions of radius for the same simulations in figures 7 and 8. Approximately the inner third of the cooled disk shows suppressed pattern amplitudes relative to the isothermally evolved simulation. In Paper I we showed that this region was the region most likely to form collapsed objects in the isothermal evolution limit. With our new series of simulations this conclusion must be revised. No clumps form in this region in these simulations, as they do in the isothermally evolved runs. The time averaged pattern amplitudes decrease as radius increases in the outer half of each disk because the patterns have not fully saturated there during the period over which the average is taken. Averaged over longer time baselines later in the simulation, the averages of the ‘A’ and ‘a’ simulations reach values of throughout the outer disk.
A similar deficit in the amplitude of spiral structure in the inner third of the disk is present in disks with outer radii at 100 AU. These simulations show the same amplitude structure as in the 50 AU disks above, stretched over the 100 AU extent of the disk rather than over 50 AU. Because of the great similarity we omit a separate figure displaying the result. Attempts to compare these results to isothermally evolved simulations were unsuccessful, since such simulations tend to develop clumps on the same physical time scale (750–1000 yr) as with the AU isothermal runs. Evolution of the 100 AU simulations had to be terminated before the outer disk has completed even a single orbit.
In spite of the large pattern amplitudes, only one simulation (a2me, with an assumed 100 AU disk radius) showed evidence of possible spiral arm collapse into a clump. A portion of a spiral arm near the outer disk edge began to show signs of collapse at time . At this point the cooling prescription failed to determine the vertical structure for the particles near the forming clump and further evolution of this simulation becomes impossible. We cannot determine whether collapse would continue or dissipate once again into the background flow. No other simulations show indications of clump formation, including the lower and higher resolution counterparts of this run (a2lo, a2hi). Therefore we do not consider the signs of collapse in the a2me simulation to be reliable evidence for spiral arm collapse in our simulations. More generally, since the simulations in our present study do not reliably form clumps, we conclude that spiral arm collapse in marginally self gravitating systems like those we study is rare.
The SEDs synthesized from the simulation A2me are shown in figure 5. The simulation produces a double peaked spectrum with one peak dominated by the assumed 4000 K stellar black body and the other between 10 and 20m (3–400 K). The long wavelength end (m) portion of the SED does not match the SED well: insufficient radiation is emitted. We defer a detailed discussion of the differences in the long wavelength behavior to section 5.2. The near infrared band (defined for our purposes as wavelengths from m to 5m) does match the fiducial SED with the same morphology as our simulated disk, however this turns out to be a fortunate accident rather than a real agreement. Lower (higher) resolution simulations produce more (less) flux, due to variations in the dissipation rate with resolution (see appendix B.2). We expect that if resolution were increased still further, the near IR flux would continue to decrease.
The absence of near IR flux in both the fiducial SED and our simulations is in part due to the relatively large truncation radius of our disk (recall that particles are accreted by the star inside 0.4 AU). The size of the accretion radius is motivated by numerical time step constraints rather than a specific physical basis, but does model the physical existence of a 0.4 AU boundary region between the inner disk edge and the star if one that size exists. To test the effect of a smaller boundary region we ran simulations similar to A2me and A2hi but with a reduced accretion radius, 0.2 AU. We found that the total disk luminosity does increase and the near IR flux deficit is partially filled in, but that a near IR deficit still remains. It remains unclear the full effect that a still smaller inner truncation radius or higher resolution will have on the SED.
In several regions, our cooling model will break down. For example, reprocessed stellar illumination will heat the gas and modify the assumed vertically adiabatic structure. Another failure will manifest because of the combined effect of the large, low temperature opacities and the low temperatures implied by our model at high altitudes above the midplane. For any conditions at the midplane of the disk, our vertical structure calculation produces a region which is both cold and sufficiently dense to make the column optically thick at high altitude. Photosphere temperatures higher than 500 K are not obtained in this case and the disk is unable to radiate efficiently in the near infrared. Such a condition will accurately model real systems only as long as the opacity source (dust) remains unaffected by temperature or by vertical transport. In regions where the gas is hot enough to vaporize embedded dust grains, this assumption will fail.
4.1.1 An Attempt to Improve the Cooling Prescription
The dust which produces nearly all of the low temperature opacity will be destroyed in the inner disk because the temperatures in the disk midplane can rise above the vaporization temperature of the dust. At higher altitudes temperatures are cooler and grains can reform and grow. We have studied the growth and reformation of dust grains when the midplane is hot and found (Appendix A) that after being destroyed, grains require several months to grow to sizes of a few tenths of a micron. At high altitudes where densities and the probability of dust-dust collisions are lower, grains grow to only m in the same time. In no case do grains reform into a distribution similar to that assumed for most Rosseland mean opacity calculations (e.g. PMC, Pollack et al. 1994).
The Rosseland opacities in use in most calculations to date are calculated with a specific grain size distribution and constitution based on models of the dust in the interstellar medium (ISM). In the case of the disk evolution, both densities and temperatures are much higher than the ISM and our calculations in the appendix show that grain reprocessing occurs on orbital time scales in the inner disk. We have not calculated the effect that the reprocessing discussed in appendix A will actually have on the opacity, however other calculations for different grain sizes (Pollack et al. 1994, Miyake & Nakagawa 1993) have shown significant differences between the frequency dependent opacities calculated for different sized grains. Therefore, we conclude that in the inner disk where grain size evolution occurs on short time scales, accurate opacities require a calculation which accounts for the time dependent size and composition changes of the grains. Radiative transport calculations in which such effects are not included may yield inaccurate spectra and thermodynamic structure of the disk.
We have investigated the effect of a grain reprocessing on a disk system by performing a series of simulations which begin with the same initial model as simulation A2me, but with an artificially modified opacity. In these simulations, we calculate the instantaneous midplane temperature for each location in the disk and if it is above the grain destruction temperature, we multiply the opacity by a factor (see eq. 15). We vary between and for different simulations. Within a single simulation is constant. The factor models in a crude manner the effect of a modified opacity limited to regions where the temperatures are hot enough that dust may be destroyed and reform. The photosphere temperature is determined as before, but will be modified because the reduced opacity allows photons closer to the hot disk midplane to escape into space.
We show time averaged SEDs derived from these simulations in fig. 9. Depending on the assumed opacity modification, , the near infrared flux ‘turns off’ or ‘turns on’. With large the SED appears similar to that shown above in figure 5 (whose time average is reproduced in the lower right panel of fig. 9). With small it appears permanently in an ‘outburst’ phase in which the 1–5m band is enhanced by as much as a factor of ten over the stellar contribution.
It is notable that the values of which are required to produce any change in the 1–5m flux are quite small. In fact, the modifications in the opacity values are not inconsistent with an opacity consisting only of a contribution from gas rather than from both gas and grains. A ‘grain free’ calculation (D. Alexander: personal communication) of the opacity using the model of Alexander & Ferguson (1994) down to 1000 K produces opacities which are similar in magnitude to our modified values. We conclude that unless grains are completely destroyed in a given column of disk matter no effect will be present in the emitted spectrum.
Both a frequency dependent radiative transfer code, incorporated into the hydrodynamic calculation at each time step, and a recalculation of the Rosseland opacity for each , , and grain size distribution accessible to our simulations are beyond the scope of the present work. As a parameterized factor however, we bracket the difference from the tabulated PMC opacities to a factor between 0.001 and 0.01 times the PMC values in regions where the midplane temperature rises above the grain vaporization temperature. Below, we shall implement a ‘standard’ factor of 0.005 (high resolution) or 0.0075 (medium resolution) times the tabulated PMC values in such regions.
Other regions of the disk may also experience the effects of grain reprocessing and modified opacities. Except for the hottest regions, grain size evolution occurs on a time scale of many orbits (Weidenschilling 1997) rather than less than one, so we would expect less short term variation in the energy output of the disk. Long term differences may still occur as the size distribution evolves and the opacity changes.
4.1.2 Morphology and SEDs using modified opacities
The results of a simulation with an identical initial condition, but with the modified cooling prescription ‘B’ (simulation B2m4), are shown in figure 10. The derived SED corresponding to each frame is shown in figure 11. The gross morphology of the system as evolved under this modified cooling prescription is quite similar to that produced with the original prescription. Instabilities begin in the inner regions of the disk and as time progresses, engulf the entire disk, forming filamentary, multi-armed spiral structures. A quantitative measurement of the system morphology as measured by its pattern amplitudes (fig. 12) confirms the similar behavior for these simulations. There are no significant differences between the pattern amplitudes derived from the ‘A’ and ‘B’ simulations apparent.
The similarities are perhaps to be expected since only the inner regions undergo different cooling. However, if the inner regions of the disk are responsible for the character of dynamical behavior further out, the modifications might create a different pattern of evolution throughout the entire disk. Since no such differences are evident, we may conclude that although the instability growth begins in the inner most regions of the disk, its character at large radii is not strongly dependent on the dynamics of the inner region, at least for the two types of cooling assumptions we have outlined.
In spite of only small differences in the system morphologies, the derived SEDs show a marked difference from those produced using the original cooling prescription. In the present case, the SED exhibits a rising (toward higher frequencies) spectrum between 30–50m ( Hz) and m (a few Hz), then falls off at the highest frequencies where only the star contributes significantly to the flux. In this example, the flux in the near infrared is variable in time, with each of the panels in the SED time mosaic being somewhat different from the others. The variations are concentrated in the near IR region of the disk, for which the calculated midplane temperatures are high enough to invoke the modified cooling. The flux also significantly overestimates that of our fiducial system, which also includes the possibly unphysical 0.4 AU central hole region. The hot inner disk will cause significant grain reprocessing out to much larger radii than 0.4 AU. However, the extent to which the reprocessing actually reduces the opacity and increases the flux, or the simple presence of additional matter in the hole region is responsible for producing additional near IR flux is unclear. Models which attempt to reproduce the near IR flux from observed systems must account for this degeneracy.
As before with our ‘A’ cooling prescription, the disk does not emit sufficient flux at low frequencies ( Hz), since the modifications in section 4.1.1 affect only the hottest portion of the disk. The temperature at the disk photosphere lies above the values required to produce the 30–100m flux when grain destruction has begun to affect the radiating temperature, or below them, where the matter contributes only minimally to the SED.
4.2 Azimuth averaged radial structure
In this section we use the structure model from section 3.2 to derive physical disk parameters such as the gas temperature and the disk scale height, as well as the directly available mass density as functions of distance from the star. The physical and numerical origins of the radial structure as a function of time are addressed in section 4.3 and in appendix B.
4.2.1 Surface Density
Dissipative processes produce radial transport of mass and momentum through the disk. Figure 13 shows the azimuth averaged surface density profile obtained after 4. The density profile far from the star does not change greatly over the period of evolution simulated. Further inward, we find that a portion of the mass initially in the inner disk has been driven further outwards, increasing the surface density over its initial value, Another portion is accreted by the star, as shown in fig. 14. The total mass accreted for the ‘A’ and ‘B’ simulations are similar. During the first two , the accretion rate is much more rapid than later on. In our highest resolution runs, the accretion begins at rate of about yr, but falls by a factor of three later on. These rates compare favorably with accretion rates obtained for very young objects (e.g. Hartigan, Edwards & Ghandour 1995), however they do depend on the resolution of the simulation, and a further study of the details of the accretion will be required to completely specify the accretion. In the example above, the total mass accreted by the star over 6was approximately , or 23% of the initial disk mass. In lower resolution simulations the total increases to , or 30%.
This time dependent mass accretion pattern is present in every simulation we study. Over the duration of a simulation, the inner disk becomes depleted of much of its initial complement of mass (fig. 13) as the orbital energy of the gas is dissipated first as heat and then as radiation. Effectively, the surface density profile develops a much larger core radius ( in eq. 1) than it initially has. The new core radius is approximately AU and the surface density in the core region is gm/cm2. More exact values are not possible to quote because they continue to evolve for the full duration of our simulations.
The initial fast accretion period and its decrease later on, suggest that the initial density profile we assume is somewhat unrealistic. The late time, slower and more constant accretion rate suggests that a ‘steady state’ system will have a flatter density profile than we assume initially. Since we begin our evolution at a somewhat arbitrary point in time, we conclude that a more physical initial condition for the radial density structure for circumstellar disks will be shallower than the power law initially assumed here to extend all the way to the inner disk edge. We defer additional discussion of the redistribution of mass and angular momentum within the disk to a future study.
4.2.2 Temperature
The azimuth averaged temperature profiles late in the evolution of the disks shown in figures 4 and 10 are shown in figure 15. The midplane temperature shows several distinct regions which individually appear as power laws for suitably small radius ranges, but a single power law for the whole range of radii does not provide a good fit to the temperature structure. Between 1 and 10 AU the midplane temperatures of both simulations decrease roughly according to an power law. Further out (between 10 and 20 AU) the decrease steepens as the disk transitions from an optically thick to optically thin regime. Beyond 20 AU the disk becomes optically thin to its own radiation so that the midplane and photosphere temperatures are the same.
In the innermost portion ( 1 AU) of both sets of simulations, the radial photospheric temperature structure is nearly a flat function of radius. Due to the increased efficiency of cooling when the opacity is modified, the ‘B’ disk midplane temperature profile also flattens out in the inner 1 AU, while the ‘A’ simulation temperatures increase to 2-400 K above those of the ‘B’ temperatures. The difference is because of the changed opacity assumptions when dust is destroyed. The hottest ‘B’ temperatures are similar to the dust destruction temperatures obtained from the PMC opacity tables.
The photosphere temperature follows a single power law much more closely over its radial range. Only in the inner few AU does the temperature again becomes flatter than in rest of the disk. The ‘A’ and ‘B’ cooling prescriptions have profiles which are quite similar to each other. The differences which do exist are in the azimuthal variation of the temperature. In regions where the midplane is hot and the modified cooling procedure comes into play, the rms photosphere temperature is nearly as large as the temperature itself, indicating many short lived opacity holes for which hot material near the midplane becomes temporarily more visible to the surrounding space.
In the ‘B’ runs, a sensitive balance between the dynamical heating and cooling in the inner disk produces wide variation in the opacity because dust grains responsible for the opacity are destroyed at high temperatures. When dynamical activity heats a vertical column of disk matter so that grains are destroyed, the hot disk midplane is exposed and the column cools efficiently. As it cools below the grain reformation temperature, the optical depth to the midplane increases and the cooling slows as the effective temperature reflects colder, high altitude regions.
We have fit both the midplane and the photosphere temperature profiles to power laws whose exponents are a free parameters. The resulting exponents are plotted as a function of time in figure 16. Fits are made over the range of radius between the assumed accretion radius and the outer edge of the system, where no particles exist. Because the midplane temperature cannot be fit to a single power law we do not attach significant meaning to the derived exponent. We include it in order to highlight the differences between the value obtained by an external observer and that relevant for the dynamically important disk midplane.
After an initial transient of 200 yr (0.4) as the disk becomes active, the exponents reach minimum values of and , then settle to and over the next the next 1000 yr (2). This time corresponds to the end of the fast mass accretion period, after which the dynamical evolution and the strong internal heating which accompanies it slows. Each of the power law exponents are steeper than those derived from the models of BSCG, who fit observed SEDs to a model of a disk with a power law temperature profile. In their work, exponents in the range were determined. The origin of the differences are discussed in section 5.2.
To study the effect of using a Rosseland opacity in an optically thin region on the cooling prescription, in a separate simulation, we multiplied the flux emitted from such from regions by the optical depth, , which will more accurately model the flux when . This treatment will produce reasonable accuracy as long as the Rosseland and Planck mean opacities are comparable. In this case, the temperatures in the optically thin outer disk increased to about 10 K at the outer disk edge from the 5 K temperature seen in fig. 15. The fitted exponents changed to 1.0 and 1.6 for the photosphere and midplane respectively. No change in the dynamical character of the simulation was observed.
4.2.3 Toomre
In figure 17, we show a plot of the azimuth averaged Toomre values for the initial system and at 1, the middle of the period over which the pattern amplitudes are averaged in section 4.1. In the inner 10 AU of the disk, the value is far larger than initially, while between 10 and 30 AU a smaller increase is present. Beyond 30 AU, decreases below its initial value after 1, but recovers its initial profile later in time, as the spiral structure becomes fully active and internal heating turns on throughout the disk.
The increase at small radii is driven primarily by the decreased surface density there, which decreases the denominator in eq. 3. Secondarily increases because of the increased temperatures relative to the isothermal runs, which increase the numerator of eq. 3, through the temperature dependence of the sound speed. The consequence of the increased values are the lower amplitude spiral structure and the lack of clumping in the A and B simulations because of the increased stability to perturbations. Note that increased Toomre stability does not necessarily imply stability against all perturbations however, since as we shall see shock dissipation is largest in the inner disk.
4.2.4 Scale Height
The vertical structure model outlined in section 3.2 can also be used to calculate the vertical scale height at each point in the disk. For the purposes of this work we define the disk scale height, , at some point in the disk as the altitude above the midplane at which the mass density, , decreases by a factor of from its midplane value. We find (fig. 18) that as our simulations evolve, the disk becomes quite thick at small distances from the star. No differences are apparent between the scale height produced from the different cooling prescriptions. The altitude of the photosphere shows an even more pronounced rise at small radii, extending vertically to near 5 AU. At larger radii, the photosphere surface drops to the midplane as the disk becomes optically thin to its own radiation. In the same region, the scale height, , stays nearly constant with no flaring present except at the outer boundary of the disk.
No doubt the vertical structure produced will change when a full description of the heating mechanisms is included. However, heating by absorption of stellar photons requires that the outer disk not be in the shadow of material further in, as the maxima in the photosphere and exponential scale heights suggest could be the case. In order to fully address the question, the three dimensional distribution of the opacity sources must be known, both for the long wavelength, ambient disk radiation and short wavelength stellar radiation. Even though the disk may be transparent to its own radiation, it may still absorb stellar photons efficiently at high altitudes above the photosphere (see e.g. D’Alessio et al. 1998).
4.3 The origin of the differences between isothermally and non-isothermally evolved simulations
The differences in the pattern morphology in the ‘I’ and ‘A/B’ simulations have their origin in the way thermal energy is retained by the gas or radiated to space. The conversion of kinetic energy via shocks into radiated energy is more efficient in isothermally evolved simulations than our current series. The conversion of kinetic energy into thermal energy is more efficient in our current series than in isothermally evolved simulations. The conversion efficiencies are different because an isothermal evolution assumption implies three restrictive statements about the physical mechanisms involved in the heating and cooling of the disks, which are not otherwise present. Namely,
Isothermal evolution assumes that the effects of heating and cooling exactly balance each other according to a predefined temperature law.
Isothermal evolution assumes that passive cooling and dissipative heating processes within the disk are very rapid. Deviations from the predefined temperature law are restored instantaneously to the original profile.
Isothermal evolution as modeled assumes zero efficiency for reversibly converting kinetic energy into thermal energy of the gas (i.e. work) because of the assumption that the ratio of specific heats, , is equal to unity and the temperature is constant.
Each of these statements actually also highlight subtle differences between the model of an isothermal system and the actual physical system. Consider the case of an isolated hydrogen gas (). In this physical system, passage through a shock or some through some viscous disturbance would increase the temperature and pressure of the gas. If we assume the cooling is efficient so that the evolution is ‘isothermal’, we assume that the energy driving the temperature increase across the shock interface is radiated away to an external reservoir. The first two statements above express this balance between the rapid dissipative heating and rapid radiative cooling.
In our disk models such dissipative heating may occur as gas passes though a spiral arm structure. The first two statements are falsified in our new simulations because substantial heating of the disk occurs before a new equilibration is reached (section 4.2) and because temperature variations which occur as a result of grain growth and destruction, since these temperature variations do not immediately return to their ‘steady state’ values. The temperature profile at any given instant in time is not the same as the predefined profile: the gas retains thermal energy better than we assume in the isothermally evolved case. The changed thermodynamic state in turn changes the stability of the disk to perturbations. The decreased pattern amplitudes in the inner third of our disks are a consequence of this stability.
Again in the hydrogen gas example, a compression which does not lead to a shock in a hydrogen gas will only be isothermal if energy going into raising its temperature is radiated away to an external reservoir. In an isothermally evolved model, rather than including a cooling process which produces an effective value of unity, we define and a different assumption is made instead (expressed in the third statement above). In this case, no energy is used to raise the temperature of the gas in the compression. Instead, all of the work used to compress the gas goes only into increasing its pressure and density. A given amount of work can therefore compress the gas to higher densities and, in our specific example of disk evolution, spiral structure will achieve higher amplitudes and appear more filamentary.
5 The contribution of dynamical processes to emitted radiation
In addition to direct conclusions regarding the dynamical evolution of the simulations, in this section we investigate the contribution that dynamical mechanisms make to the energy output by the system. Because we have not included all sources of heating available to the disk in our simulations (passive reprocessing of radiation for example), we cannot expect the SEDs synthesized from those simulations to accurately reproduce observations. We can however draw conclusions about the whole by examining the differences between our synthesized results and observed systems. For example, to what extent do dynamical processes power observed accretion disk SEDs (and in what wavelength regimes?) as compared to passive sources? Given that dynamical processes do not reproduce the SED completely, what can we infer about the relative importance of other processes in the system?
5.1 Variation of the SEDs with time
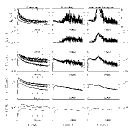
We concluded in section 4.1.1 that the time averaged SED in the near and mid IR is strongly dependent upon the microphysics of the dust grain size distribution and its effect upon the opacity, but that our model could only bracket the magnitude of the modification required to accurately reproduce the time averaged spectrum. We now study the time dependent behavior of our simulations. In fig. 19 we plot the the total luminosity of the disk and the emitted power, , at 2, 10, 25 and 100 m as a function of time for each of three resolutions for our ‘A’ simulations and our highest resolution ‘B’ simulation (The right hand panels are discussed in appendix B).
Within 100 yr of the beginning of the simulation, the total luminosity from the disk increases to a peak and then decreases over the next two to a more stable, long term evolution. The high luminosity is a consequence of the the high mass accretion period seen above and as the mass accretion rate decreases the luminosity falls. Fluxes in all wavelengths continue to decrease slowly even late times. We attribute the continued decrease to the absence in our models of external sources of thermal energy, such as stellar illumination and additional mass accretion from the molecular cloud.
With the ‘A’ cooling model only small flux variations in time are present: no short term variations larger than 10-20% are present at any wavelength and short term variations at longer wavelengths are smaller, about 1% at 100m. At 2m, no contribution from the disk is present; the flux is completely dominated by the assumed constant 4000 K black body contribution of the star. In these simulations, at short wavelengths the assumed 1 , 4000 K black body contribution from the star dominates the emission from the system. Further, the total luminosity of the disk is only a small fraction of the stellar contribution. In our highest resolution simulation ‘A’ simulation the disk luminosity is of order 0.2, while the increased near infrared emission in the ‘B’ simulation increases the total to about 2/3 .
The ‘B’ simulations show behavior similar to the ‘A’ simulations in the mid and far IR, but exhibit large variations in the near IR. At 2m for example, the variation is about a factor of two or more from peak to peak and the total disk luminosity shows a similar amount of variation. This simulation does not produce substantial 2m flux until near the end of the initial fast mass accretion period and similar behavior occurs in the other ‘B’ simulations.
In order to see the shorter term structure in the flux variation, we show the same variables as in 19, but expanded to show a small slice in time in fig. 20. The time scale of the variation in the near and medium infrared is similar to the orbital time scales of the inner disk, which is truncated at 0.4 AU in our simulations. At some times, only the assumed stellar component of the flux contributes to the flux, while at others, the flux is dominated by the disk contribution. The variations have no well defined periodicity. Variations occur over periods of less than a year and over periods of as long as ten to twenty years.
The variation which exists in the near infrared is due to the sensitive temperature balance near the destruction temperature of dust grains. When a column is heated so that the midplane temperature is above the dust destruction temperature, the midplane is exposed and more near infrared radiation escapes. As it cools, dust reforms and the the hot midplane is again concealed by a cooler high altitude dust layer, which emits most efficiently at longer wavelengths. Because of this sensitivity, we conclude that a correct model of the dynamics and spectral energy distributions of circumstellar disks must include an accurate description of the full three dimensional spatial distribution of grains and of their size distribution. Qualitatively, we can understand the dynamical origin of the variation by noting that heating processes in the inner disk do not occur at regular intervals as the disk evolves, but rather occur sporadically as spiral arm structures or other inhomogeneities interact and dissipate orbital energy as heat. We discuss the significance of possible numerical origins of the variations and their amplitude in Appendix B.
Coupled with the sharp decrease in opacity required to reproduce the near IR flux (sec 4.1.1), the time variability present in our simulations suggests the following interpretation. In the inner portion of the accretion disk, clouds of grains in small patches of the disk are destroyed and reform, intermittently obscuring the hottest parts of the disk midplane from view. Such an interpretation implies quite naturally the existence of intermittent variability in the near and mid infrared spectra of star/disk systems originating from within the disk rather than from a stellar photosphere. Skrutskie et al. (1996) observe such variation on time scales of a few days to a few weeks in the , and bands for several young stellar systems. They conclude that such variations are due to processes in the accretion disk within a few tens of stellar radii from the star or less. Longer term mid-IR variations observed by Wooden et al. (1999) show an apparent correlation between a short lived 10 m absorption feature and a sudden decrease in the band luminosity in the DG Tau system. Such a correlation suggests that stellar or disk midplane photons escaping to space are later more and more strongly attenuated by dust as it recondenses and the medium becomes optically thick.
Also, the class of higher mass pre-main sequence stars known as “UXOR’s” show quasi-periodic optical variations on decade long time scales occurring (Herbst & Shevchenko 1999). These variations have been attributed to dust clouds in a disk which intermittently obscure the stellar photosphere. While UXOR stars are more massive than those modeled in our study, similar mechanisms may apply to each. In our model, we do not require that the system be observed edge on as discussed in Herbst & Shevchenko and so remove one of the more substantial objections to the model noted in their discussion. Similar observational studies of longer term infrared variations of other T-Tauri and UXOR stars would provide in situ measurement grain evolution in the disk and dynamical activity within a few AU of the star.
5.2 The origin of thermal energy generation
The goal for this section is to understand which physical processes are responsible (and just as importantly which are not responsible) for the luminosity produced by observed young star/disk systems in each portion of their spectrum. Of particular interest will be to understand the origin of so called ‘flat’ or shallow spectrum sources which may be representative of more massive disk systems like those in our study. We have noted that the artificial viscosity incorporated into our simulations approximately models the underlying physical dissipation of kinetic energy present in the disk. We now proceed to calculate the magnitude and origin of the thermal energy generated in different portions of the disk. In appendix B, we attempt to quantify and understand properties of the artificial viscosity prescription which are not of physical origin.
We first quantify the quantify the magnitude of turbulent dissipation in our simulations, as quantified by the Shakura & Sunyaev parameter. Figure 21 shows its azimuth averaged value derived from our simulations. Its value in any of the disk is of order a few . Both the ‘A’ and ‘B’ simulations produce identical dissipation rates, so only the ‘A’ results are shown. We also plot the ratio of the dissipation due to the turbulent and shock artificial viscosities and find that the ratio is near unity. The total budget of thermal energy generation from dissipation of large scale gas motions averaged over azimuth is therefore within a factor of a few of that provided by the term alone. Two distinct regions exist in the plot. In the inner disk ( AU) shock dissipation dominates the total, while further out turbulent dissipation dominates. The increases at large radii are due to the loss of resolution at the disk boundary and are not significant.
5.2.1 The inner disk
We have discussed the mass accretion onto the star from the inner disk in section 4.2 above. Here we discuss the dissipation responsible for it. The dominant source of of the near and mid infrared radiation is from radii AU from the star but the exact allocation of radiated energy to specific wavelength bands depends on the opacity assumptions. The internal dissipation processes present at radii AU are sufficient to power a large fraction of the near/mid infrared SED. In this region, figure 21 shows that shock dissipation is as much as a factor of 2–3 larger than turbulent dissipation. Also, the turbulent dissipation itself increases by a similar factor over its value at large radii. A portion of this increase may be due to numerical and resolution effects as discussed in appendix B (higher resolution implies lower numerical dissipation), but the exact proportion of physical and numerical dissipation remains unclear.
The decrease in mass density of the central region later in the simulations poses a problem for our SPH code because of its reliance upon particles to resolve the flow. As the density decreases so does the particle density and therefore also the detailed resolution of the flow. In order to resolve the physical conditions in the inner disk, we expect that very high resolution simulations concentrating specifically on the dynamical behavior of the inner accretion disk must be performed in order to better define the physical conditions present over long periods.
5.2.2 The outer disk
The flux derived from the simulations at long wavelengths (figures 5 and 11) underestimates that from observed systems (e.g. BSCG), and especially those thought to be younger systems for which large disk masses are more likely (Adams et al. 1990). Also, the long wavelength turnover in the SEDs typically occurs near between 10 and 30m ( Hz) rather than the 100–300m (1012 Hz) typical of observed systems (BSCG, Adams et al. 1990). Is this deficit physical, or are the initial conditions of our simulations responsible for its existence?
The dominant source of the long wavelength radiation is colder regions of the disk distant from the star. If the assumed disk radius is doubled, so that the total disk surface area radiating at, say 10–30 K, is increased by a factor of approximately four, will sufficient long wavelength flux be produced? We examined the differences in the long wavelength end of the SEDs generated from our 50 AU disks (simulations A2lo, A2me and A2hi) with those generated from 100 AU disks (simulations a2lo, a2me and a2hi). Time averaged SEDs for each of the simulations are shown in fig 22. Looking specifically at the long wavelength flux behavior, in which dust destruction is unimportant, we find no significant differences between shape of the SED seen in one or the other simulation. We conclude that the assumed size of the accretion disk is not responsible for the shape of the SED at long wavelengths.
Is the initial temperature profile too cold, so that even with substantial heating the disk never warms enough to produce appreciable long wavelength flux? A test simulation identical to A2me, but with initial =2.5 so that the initial disk temperatures everywhere are higher, cools over the course of the first 1–3to resemble the conditions in simulation A2me. We conclude that the initial temperature profile is not critical for the long term () temperature of the system.
In section 4.2 we showed that the temperatures in the outer part of the disks are lower than are determined from observations. We find temperatures at the outer disk edge 10 K, while Adams et al. 1990 for example determine temperatures at the outer disk edge of order 15–30 K. In many parts of the disk, they are in fact also lower than those observed for the molecular clouds in which the disks reside (see e.g. Walker, Adams & Lada 1990). We can conclude from the low temperatures and the corresponding long wavelength flux deficit that heating of the disk due to identifiable internal processes (e.g. large scale shocks) in our simulations is insufficient to heat the outer disk to the ‘right’ temperature, i.e. a temperature warm enough to produce SEDs from our models which are similar to observed systems.
This conclusion implies an upper limit on the amount of mass and angular momentum transport due to gravitational torques, since such torques are ultimately responsible for the growth and evolution of the spiral structures in which the shocks occur. We obtain a conservative limit if we attribute all of the energy dissipation in our simulations in the outer accretion disk to gravitational torques. We conclude that they produce large scale shocks which dissipate kinetic energy at a rate no greater than an equivalent dissipation of . This limit is valid for marginally self gravitating systems (=0.2) only, where spiral arms are both filamentary and of high order symmetry (). In massive systems, where the dominant spiral patterns are of low order symmetry () and gravitational torques are likely to be more effective, perhaps more efficient transport is possible. Also in this case, gravitational torques may be more effective in transporting matter non-dissipatively, so that their effects would not be observable in the radiated energy spectrum. Then the transport would be through direct and non-local exchange of gravitational potential energy of matter in one part of the disk for kinetic energy of matter another part of the disk, rather than through wave amplification and dissipation.
6 Discussion and comparisons to other work
In order to provide a context for further investigations, here we compare the results and limitations of this study with other recent work. The majority of previous multi-dimensional hydrodynamic simulations of circumstellar disks have been done completely or partially within the assumption that the thermodynamic properties of the gas are either locally isothermal or locally adiabatic. One subset of these (e.g. Pickett et al. 1998, Paper I , Laughlin & Różyczka 1996) has investigated the linear and nonlinear development of spiral density patterns in massive systems. A second subset (e.g. Boss 1998, Laughlin & Bodenheimer 1994, Bonnell & Bate 1997) has investigated physical outcomes of cloud collapse and the early evolution of the disk which forms afterwards.
The results of first subset show that Fourier components of the spiral structures that form tend to saturate at amplitudes of %, due to non-linear mode coupling between spiral patterns of different symmetries (Laughlin, Korchagin & Adams 1997). This amplitude saturation is true of the present work as well, however the saturation amplitude is lower in the inner third of the disk relative to the growth found in isothermally evolved models with similar initial conditions (Paper I ). In our simulations, thermal energy can be retained in the gas rather than being immediately radiated to space or preserved in the form of bulk kinetic energy. Similar to isothermally evolved runs, regions more distant from the star develop spiral structures which vary in time and do not persist as a single pattern over even a single orbit of the outer disk around the star.
The Pickett et al. (1998) models examine the evolution in a massive star/disk system (=0.4), including the star disk boundary and the region within a few 10’s of of the star. They investigate the effects of the thermodynamic treatment of the fluid by evolving systems in the limits of either isothermal and adiabatic (i.e. rather than fixed) evolution. Their isothermally evolved runs develop much more pronounced spiral structure than their adiabatic runs, similar to our own findings for isothermal vs. cooled simulations and that their isothermally evolved runs break up into ‘arclets’ similar to the clumps in Paper I and in Boss (1998). They also find that the star/disk boundary is subject to different instability morphologies than is the disk itself. Coupled with our findings about the variability in the inner disk, such a finding makes even more clear the need for a detailed study of the character of the disk within a few AU of the star.
In Paper I , Boss (1998) and Pickett et al. (1998), spiral structures collapse into clumps late in some of the simulations. In Paper I and Pickett et al. , the radial temperature structures were isothermal, while in Boss (1998), the thermal structure of the disk was first obtained from a synthesis of many axisymmetric calculations including simply radiative transport, then three dimensional disk evolution was modeled assuming the structure was thereafter either locally adiabatic or isothermal. Except in one unverified example (section 4.1), spiral patterns in our current calculations do not collapse into clumps as they did in the isothermally evolved cases in Paper I . It is significant that only simulations of disks with predefined radial temperature or entropy structure also produce clumping in disks. As we warned in Paper I , the thermodynamic structure of disks is not yet sufficiently well understood to make the interpretation of such clumping clear.
In both Paper I and in the present work, dynamical activity (spiral structure) in the inner few AU develops and produces heating due to shocks as various structures collide and reform. The dissipation results in mass accretion onto the star and transport radially outward to conserve angular momentum. Within 1000 yr, The assumed surface density power law becomes nearly flat as a function of radius inside 10 AU. From these results it seems improbable that such a steep density distribution can endure for a long time. Laughlin & Bodenheimer (1994) showed that a massive disk forms during the collapse of a cloud which is initially somewhat toroidal, and during later evolution, evolves toward a power law profile (Laughlin & Różyczka 1996). One could argue that the differences between their calculation and ours are due to modeling different stages of an evolutionary sequence, though it is more likely that the true nature of the density distribution as a function of radius is simply not yet sufficiently well constrained by the models. Neither set of simulations evolve far enough in time to produce a steady state (if one exists) and do not include additional accretion of matter from the surroundings.
In a series of papers, Bell and her collaborators (BL94, Bell et al. 1995, BCKH, Turner Bodenheimer & Bell 1997) have developed an evolutionary model for accretion disks based on an model for radial transport and a mixing length theory (MLT) based vertical structure model. In similar work D’Alessio et al. (1998, 1999) have also developed a ‘11’ dimensional model. In an model, three input parameters determine the amount of active and passive heating experienced by the disk, as well as its time and radius dependent temperature and density structure. They are the accretion rate, , magnitude of the viscosity, and the radiative flux impinging upon the disk surface
In the present work, we follow the evolution through a ‘21’ dimensional model, including the evolution of matter in both radius and azimuth, but at the expense of simpler vertical structure and radiative transport (section 3.2). Our models assume that the disk exists in isolation (i.e. that radiative fluxes onto the disk are zero) in order to study the effect of dynamical processes internal to the disk itself. We investigate the dynamical evolution (and consequent thermal energy generation mechanisms) of the disk which can not be addressed in the 11D work due to the input assumptions of the disk formulation. The accretion rate is left unspecified and is determined only from dynamical conditions.
As the high pattern amplitudes noted above indicate, a full multi-dimensional evolution is important for a description of the density structure. The energy dissipated by their variation in time and space is also important for the specification the temperature structure. The temperature structure does not develop such large variations in azimuth. Given an accurate approximation of the energy input from dynamical heating, an azimuth averaged temperature law will be accurate to a few percent. In the inner disk, where grain destruction becomes important and the hot midplane intermittently becomes exposed to space, an azimuth average is not appropriate and a multi dimensional description must be invoked.
We assume in our vertical structure calculation that the structure is adiabatic in , which is equivalent to assuming that turbulent processes smooth vertical entropy gradients. BCKH find that ordinarily the structure is super adiabatic in when only convective turbulence is active. Three dimensional calculations of a narrow annular section of a minimum mass disk (Klahr, Henning & Kley 1999), support this conclusion. The effect that a super adiabatic gradient would have on our simulations would be to systematically reduce the photosphere temperature of the disk for a given midplane temperature.
Another possible source of turbulence which may be important in dynamically active systems is turbulent mixing as large scale density structures in the disk intermittently collide and reform. It is unclear however, how efficient this process might be in coupling large scale () motion into the small scale motion required to affect the vertical structure. Recently, Pickett et al. (1999) have extended their 1998 calculations to include the effects of thermodynamic heating (but not cooling) on the disk matter and find that most thermal heating occurs away from the disk midplane, as waves generated at low altitudes are amplified upon entering lower density, high altitude regions. This result indicates that the transport of energy due to structure in the plane is at least non-negligible and can affect the thermal structure. It remains unclear whether the effect will be limited only to a very high altitude ‘corona’ or whether the structure throughout the vertical extent of the disk will be affected.
The magnitude of vertical turbulence will also have a critical affect on the vertical distribution of the opacity. Across a grain destruction boundary for example convective turbulence may be suppressed. If the dynamical turbulence noted above is also inefficient then grains would rarely be dragged into the hot midplane region and destroyed, as assumed in our ‘B’ models. In those models, a sensitive temperature balance between dynamical heating radiative cooling occurs near the dust destruction temperature and can cause variation in the near infrared energy output of the disk. Because of this sensitivity, we conclude that a correct model of the dynamics and spectral energy distributions of circumstellar disks must include an accurate description of the full three dimensional spatial distribution of grains and of their size distribution. With such a description more accurate opacity models can be obtained and radiative transfer calculations which depends on them can be improved.
In spite of the differences between the modeling assumptions and procedures utilized in our work and the models above, many of the results produced from each are quite similar. This should perhaps not be too unexpected since one of our heating terms analogous to the standard model, extended to include limited time and space dependence. The other term (shocks) is not a dominant source of heating in most of the radial extent of the disk.
Both methods are able to produce SEDs which reproduce observed profiles to varying degrees. The temperature and density profiles on which the SEDs are based however are quite different. In our work, the inner disk provides nearly all of the flux and is characterized by an essentially flat surface density profile and an temperature law at the photosphere. Only at distances AU does the surface density begin to fall off steeply. At these radii, the temperatures derived from our models are low enough not to contribute significantly to the flux, and indeed our simulations are deficient in long wavelength radiation relative to observed systems.
Both in our work and Bell et al. (1995), a mechanism by which the disk may vary its energy output (SED) in time is explored. We consider the variation of the opacity due to the destruction and reformation of grains in the inner disk, while they consider variation in the thermal ionization state of gas within a few stellar radii of the star. They are able to produce very large and long term temporal variations typical of FU Orionis outbursts in accretion disk SEDs, while we find much smaller variations (factors of 2 or less) which occur over much shorter time scales.
The puffed up inner disk in our work is similar to the hump at the same radii seen in BCKH, which they attribute to the temperature dependence of the opacity (i.e. the temperature at which various component grains vaporize) and the our results are likely to be the same effect. The smaller ‘volcano region’ discussed by Turner et al. (1997) in their simulations of the disks of FU Orionis objects (derived from the BCKH models) is much smaller in extent and is due to reprocessed stellar photons. Neither model depends upon the validity of the thin disk assumption and both indicate that such an approximation may be inappropriate in the inner regions of the disk.
We have linked the long wavelength flux deficit in our calculations to a limit on the amount heating due to shocks derived from gravitational torques. Studies of shock dissipation (Spruit et al. 1987, Larson 1989) have previously shown that shocks in disks are weak. Our results gives an estimate of how weak, in terms of their effect on the observable character of the system. If gravitational torque heating does not power the long wavelength part of the SED, what does? A variety of mechanisms are possible. The outer disk may be heated by internal means like three dimensional turbulence originating in dynamical processes or magnetic fields if there is enough ionization (e.g. Gammie 1996). The outer disk may also be heated by passively absorbing and re-radiating light from the central star or the surrounding molecular cloud. As is shown for the 1D case in Turner et al. (1997), absorption and reradiation of infrared and microwave photons can heat the outer disk, flatten the temperature profile and provide additional far infrared flux. Chiang & Goldreich (1997) show that at long wavelengths the flux may instead be due to passively reradiated long wavelength flux from the hot disk interior, because at long wavelengths the disk becomes optically thin. If the midplane regions can indeed supply enough flux ‘as is’, then the temperatures in the outer disk may not require modification at all and disk systems may be colder than expected far from the star.
We have not attempted to model passive heating in this work, in part because of the radiative transport approximations we have implemented (i.e. Rosseland mean opacities) preclude a reliable determination of the magnitude of such radiative heating processes in optically thin regimes. Such a treatment in our model would require a multi-dimensional frequency dependent radiative transport code, which has not yet been incorporated. The distinction between active and passive heating is important because assuming the wrong proportions of each imply incorrect mass and momentum transport rates through the disk. Accurate models require that the correct balance between passive and active heating be well understood in order both to reproduce observed SEDs and model the correct dynamical evolution.
Appendix A Grain Growth and Destruction in a Hot Disk Midplane
In this appendix we discuss the growth of grains in regions where the disk midplane is above the dust destruction temperature. We base these calculations on the coagulation models of Weidenschilling & Ruzmaikina (1994). For a complete description of the physical model and the code, see Spaute et al. (1991); here we shall merely summarize the model presented there.
In our calculations, the vertical density and temperature structure remain constant and are computed as described in section 3.2. We assume a midplane temperature of 1350 K and a local mass surface density of gm/cm2 at 1 AU. These conditions correspond to the intermediate temperature curves in fig. 1. A vertical column in the disk is divided into 20 vertical layers and particle aggregates are accounted for as a series of 84 bins spaced logarithmically in grain diameter with each bin 1.1 times larger than the previous bin. The smallest bin is assumed to contain grains of size 1m. Grains smaller than 1m are not accounted for and nucleation of grains from the gas phase is likewise neglected. Relative velocities of grains are associated with the turbulence, settling of dust aggregates to the central plane, and radial drift due to gas drag. The turbulent velocity is set to m/s, equivalent to (assuming , where is the sound speed at the midplane), and the impact strength of the grains, , is set to erg/cm3.
Using the geometric cross section of each grain size, the number density of grains of that size and the relative velocities between grains in different size bins, we compute the number of collisions between all possible pairs of size bins during one time step. The result of these collisions may be coagulation, erosion or total destruction depending upon the relative velocities of the particles and their assumed strength. Collisions resulting in grain coalescence remove aggregates from the smaller bins and change the mean mass of aggregates in the larger bins. If a collision leads instead to erosion or disruption, then the fragments are distributed into appropriate smaller size bins. Vaporization of grains in hot regions is modeled by lowering the grain strength so that any collision causes fragmentation. In the initial state, all of the grains are in the smallest size bin. Assuming that nucleation from the gas phase into 1m sized grains occurs quickly, this initial condition is equivalent to the assumption that at some point in the evolution of a particular column of gas all of the dust has been destroyed and must now reform.
Figure 23 shows snapshots of the grain size distribution at one AU plotted as a function of altitude above the midplane. Time step constraints within the coagulation model forbid a very long time evolution of the size distribution, however such longer term evolution is of limited value because the state of the gas (its temperature and density) changes on these same time scales, making a grain distribution derived from a single () configuration irrelevant physically.
At high altitudes, grains are unable to grow to large sizes in the time shown because of the low densities (which imply low collision cross sections) that are found there. The largest size to which grains grow in the time shown is 0.02-0.05m. At moderate altitudes, but still well above hot midplane where grains do not grow, grains ten times larger (m) form in this same time interval. At low altitudes near the midplane, grains are unable to grow and remain locked in the smallest size bin available. It seems likely that in this region grain material is in fact locked in an atomic or molecular state rather than in small grains, however this supposition cannot be investigated in the context of our present computation.
The size distribution of grains is quite unlike that of the interstellar medium (ISM), as characterized by MRN or KMH, whose work shows a distribution proportional to . Instead it is characterized a quantity of grains in the smallest size bin, whose origin is in the partial erosion of larger particles, and an increasing or near flat spectrum near the upper edge of the size distribution with a sharp cutoff. A flat size spectrum such as this is a characteristic feature of the collisional coagulation of grains where little destruction takes place. The flat spectrum forms because larger grains have longer stopping times, encounter more grains and therefore grow faster than their smaller neighbors. A declining power law distribution characterizes destructive processes and is pronounced at lower altitudes. Near the midplane only grains in the smallest two or three size bins exist because the assumed vaporization of grains (modeled in our calculation via grain destruction, which moves grains from larger bins to smaller) is very efficient there.
How does the grain distribution vary as the turbulent velocity and assumed grain strength vary? In figure 24 we show the results of tests similar to that outlined above, but with varying turbulent velocity and grain strength, . We vary , between 5 and 1, as discussed in Weidenschilling (1984). Except for very weak particles, the largest grains grow to a size of a few tenths of a micron within half an orbit around the star. The size distribution of grains is dependent upon the strength of the grains but not strongly on the turbulent velocity, except that higher velocities produce more erosion and keep a larger population of smaller grains active. The turbulent velocity plays a role in carrying grains into regions where they otherwise would not grow, as is shown in the bottom three frames of figure 24. Strong grains in a highly turbulent flow were able to penetrate much closer to the midplane before being completely disrupted. This penetration is a likely artifact of the way we implement grain destruction, since a grain much suffer a collision with another grain rather than be heated by collisions with gas molecules in order to be destroyed.
In all cases with impact strength, , greater than 105 erg/cm3, grain growth occurs more slowly at high altitudes than at lower altitudes. With the nominal grain strength of 106 erg/cm3, no turbulent velocities produce power law like distributions, even at turbulent velocities of half the sound speed. With weak turbulence grains form a relatively narrow size distribution, since the growth times from the smallest grains are everywhere the same and little destruction occurs. The small end of the size distribution fills in with higher turbulence as more destructive or erosive collisions occur. The distribution approaches power law form if grains are weaker than our assumed impact strength of 1 erg/cm3 and the turbulent velocity is high, but even with the highest turbulent velocity shown, differences from power law form are present. With still weaker grains, very little growth is possible anywhwere, even in regions where the grains do not vaporize, because the thermal velocities of the grains themselves are large enough to cause fragmentation of the very small, weak grains we assume. In this case, only high altitudes evolve grains of any size much larger than our smallest assumed size bin. Under no conditions were we able to reproduce the distribution of interstellar grains obtained by MRN, and we conclude that opacity calculations based upon such size distributions may produce misleading results, when used for radiative transport calculations in circumstellar disks.
Appendix B Sorting out numerical effects from physical processes
B.1 Systematic errors in the dissipation
A numerical question remains before we can make a physical interpretation of figure 21. We must certain that modeling the dissipation of kinetic energy into heat using artificial viscosity gives a reasonably accurate representation of the true thermal energy generation rate. For example, we would draw incorrect conclusions if the thermal energy generated by our artificial viscosity was systematically larger or smaller than physically appropriate. Simply running a higher resolution simulation does not address this question because the procedure for determining the dissipation remains the same and systematic errors would produce the same effect.
We have performed a simulation similar to B2h3 with the time variation of the viscous coefficients discussed in section 3.1 turned off and the viscous coefficients set to and . This simulation is denoted H2h3 in table 1. Effectively, this change will increase the global rate of thermal energy generation because we find that the time dependent viscous coefficients for each particle () ordinarily fall well below the value of unity assumed in simulation H2h3.
The time dependent fluxes for this simulation are shown in the right hand panels of figure 19 and 20. The total luminosity is increased by the viscosity modification but the increase comes only from short wavelengths regime representative of the inner disk. The high luminosity and short wavelength flux over the first 2–3 again come from the initial fast mass accretion period seen in the ‘A’ and ‘B’ runs. After this period the disk has adjusted from its initial condition to one which is stable over longer periods. The magnitude of the initial burst in flux is larger because for a single heating event, the thermal energy transfered to column of matter is larger and leads to higher temperatures than before. Higher temperatures over a larger region of the inner disk then produce a correspondingly increased flux as the gas cools.
After the initial fast accretion period (i.e. after 2), the near and mid IR flux are increased in magnitude above that of the ‘B’ simulation by only %–barely large enough to be detectable on the plot. The long wavelength flux also increases by only % relative to the ‘B’ simulation. In both simulation B2h3 and H2h3, little thermal energy is produced in the outer disk. More significantly, the bottom frame of figure 22 shows that the long wavelength turnoff does not shift further into the far IR or submillimeter region. It remains instead near Hz (30m). Therefore, we can be certain that the specific details of the artificial viscosity implementation to generate thermal energy are not strongly affecting the outcome of our simulations.
B.2 Variation of dissipation with resolution
In our higher resolution runs, the SEDs synthesized have a systematically smaller infrared excess and total luminosity than in lower resolution runs (fig. 22). This difference is due to the correspondingly lower dissipation possible at high resolution, as shown in the top panel of fig 21. Because the purely compressional dissipation (i.e. shocks) is better resolved at higher resolution, as the resolution increases the shock dissipation term will more closely model the physical dissipation present in shocks and purely numerical dissipation will decrease elsewhere in the flow. Therefore until a set of simulations converges to a well defined amount of dissipation which is not a function of resolution, the dissipation which is present will represent an upper limit on that present in a real system.
Ideally, the contribution of unidentified sources of dissipation to the energy output of the system would be negligible. In such a case, specification of known dissipation mechanisms and the known passive heating mechanisms in the model assumptions would specify the observable appearance of the system. In our models this ideal can only be approached, rather than definitely specified. We have identified the bulk viscosity term in eq. 8 with the Shakura & Sunyaev , which attempts to model the effects of turbulence with a single parameter. Since our resolution is finite, this source of dissipation is non-zero. Further, at progressively higher resolution, the magnitude of the dissipation decreases and we conclude that we have not fully resolved the hydrodynamics important for energy generation in the system. We estimate the unknown, ‘turbulent’ contribution to the dissipation (via eq. 11) to be of order between 10 and 50 AU for the highest resolution simulations we have run (see fig. 21).
We cannot assign a definite physical origin to the bulk viscosity term, other than to say that it models turbulence. However, we still can constrain the magnitude of other, known sources of thermal energy generation by comparing their computed contribution to those of our bulk term. The comparison is useful because of the correspondence between this bulk term and the well known and widespread use of models to describe accretion disk evolution.
We have identified the von Neumann-Richtmyer dissipation term in the artificial viscosity with shock dissipation. In the lower panel of fig 21 we show the ratio between the dissipation rates from turbulence and shocks. Higher resolution produce less shock dissipation relative to lower resolution runs, and we conclude that the shock dissipation is not fully resolved. By convervatively ascribing all dissipation as being due to shocks, we conclude that the effects of shocks on the disk can be no greater than an equivalent dissipation of a few .
At radii close to the star this conclusion is reversed. Shock dissipation apparently dominates the total dissipation rate. Further, the dissipation attributed to turbulence also increases. There are two numerical reasons for the turbulent dissipation increase. First, the value of the viscous coefficient itself is never able to relax to its lowest value in this region. (Recall that we have implemented a time dependence in the viscous coefficients, which causes them to grow during compressions and decay to a small, steady state value in a smooth flow). This indicates that strongly compressive events repeat on very short temporal and spatial scales not well resolved by the code, and leads (by eq. 11) to an artificial increase in the derived Shakura & Sunyaev viscous coefficient, , which should be attributed instead to shock dissipation. This effect would tend to make the dominance of shock dissipation even stronger.
Second, within only a few ten’s of orbits, mass accretion onto the central star begins to reduce the density (see section 4.2). Since SPH resolves the flow using particles of finite mass, lower mass density in a given region is equivalent to lower resolution (fewer particles) and higher numerical dissipation. Notably, higher resolution simulations produce progressively more centrally peaked dissipations (fig. 21), which means that the region in which shock dissipation may be important is limited to a smaller portion of the disk near the star. The derived value of the turbulent dissipation at all three resolutions reaches at the inner edge, suggesting that this value is fairly well resolved. At early times, for which little mass transport has yet occurred and the structures developing in the inner disk are best resolved, the conclusion that shock dissipation is a strong contributor to the thermal energy generation remains.
B.3 Dependence of the near infrared variation on resolution and the opacity modification
The variations in the near infrared flux of our ‘B’ simulations are a function of the resolution of the simulations, decreasing as resolution increases. We cannot be certain of the amplitude at which variations become independent of resolution or the opacity approximations we have made. In order to accurately quantify the true amplitude of variations, the balance between dynamical heating and radiative cooling must be better understood. Heating due to shock dissipation in the inner disk must be well resolved and the effects of grain vaporization, reformation and size evolution on the opacity must be determined to accurately determine the magnitude of the radiative cooling.
On the other hand, the variation time scales are dominated by the dynamical (orbital) times of the inner disk and so will be relatively insensitive to resolution. Our simulations are insensitive to shorter term variations since our disks were truncated at a relatively large distance from the star. If dynamical activity continues to modify the opacities closer to the star in a similar manner to our simulations, signatures of shorter time scale variations could also exist in the emitted flux.
References
- (1)
- (2) Adams, F. C., Lada, C. & Shu, F. H., 1987, ApJ, 312, 788
- (3)
- (4) Adams, F. C., Lada, C. & Shu, F. H., 1988, ApJ, 326, 865
- (5)
- (6) Adams, F. C., Emerson, J. P. & Fuller, G. A. 1990, ApJ, 357, 606
- (7)
- (8) Alexander, D. R., Ferguson, J. W., 1994, ApJ, 437, 879
- (9)
- (10) Artymowicz, P., Lubow, S. H., 1996, ApJ, 467, L77
- (11)
- (12) Balsara, D., 1995, J. Comp. Phys, 121, 357
- (13)
- (14) Bate, M. R., Bonnell, I. A., 1997, MNRAS, 285, 33
- (15)
- (16) Beckwith, S. V. W., Sargent, A. I., Chini, R. S. & Güsten, R., 1990, AJ, 99, 924 (BSCG)
- (17)
- (18) Bell, K. R., Lin, D. N. C., 1994, ApJ, 427, 987 (BL94)
- (19)
- (20) Bell, K. R., Lin, D. N. C., Hartmann, L. W., Kenyon, S. J., 1995, ApJ, 444, 376
- (21)
- (22) Bell, K. R., Cassen, P. M., Klahr, H. H. & Henning, Th., 1997, ApJ, 486, 372 (BCKH)
- (23)
- (24) Benz, W., 1990, in The Numerical Modeling of Nonlinear Stellar Pulsations p. 269, J. R. Buchler ed.
- (25)
- (26) Bonnell, I. A. & Bate, M. R., 1997, MNRAS, 285, 33
- (27)
- (28) Boss, A., 1995, ApJ, 439, 224
- (29)
- (30) Boss, A., 1997, Science, 276, 1836
- (31)
- (32) Boss, A., 1998, ApJ, 503, 923
- (33)
- (34) Cassen, P. M. & Moosman A., 1981, Icarus, 48, 353
- (35)
- (36) Chiang, E. I. & Goldreich, P., 1997, ApJ, 490, 368
- (37)
- (38) Chick, K. M., Pollack, J. B. & Cassen P., 1996, ApJ, 461, 956
- (39)
- (40) Close, L. M., Roddier, F., Northcott, M. J. Roddier, C., Graves, J. E., 1997, ApJ, 478, 766
- (41)
- (42) D’Alessio, P., Canto, J., Calvet, N., Lizano, S., 1998, ApJ, 500, 411
- (43)
- (44) D’Alessio, P., Canto, J., Calvet, N., Lizano, S., 1999, ApJ, 511, 896
- (45)
- (46) Frank, J., King, A. R., Raine, D. J., 1992, Accretion Power in Astrophysics, Second Ed., Cambridge University Press: Cambridge
- (47)
- (48) Fukue, J., Sakamoto, C., 1992, PASJ, 44, 553
- (49)
- (50) Gammie, C., 1996, ApJ, 457, 355
- (51)
- (52) Goldreich, P., Goodman, J., Narayan, R., 1986, MNRAS, 221, 339
- (53)
- (54) Hartigan, P., Edwards, S., Ghandour, L., 1995, ApJ, 452, 736
- (55)
- (56) Henning, Th., Stognienko, R., 1996, A&A, 311, 291
- (57)
- (58) Herbst, W., Shevchenko, V. S., 1999, ApJ, In press.
- (59)
- (60) Kim, S.-H., Martin, P. G., Hendry, P. D., 1994, ApJ422, 164
- (61)
- (62) Klahr, H. H., Henning, Th., Kley, W., 1999, ApJ, 514, 325
- (63)
- (64) Larson, R. B., 1989, in The Formation and Evolution of Planetary Systems, ed. Weaver, H. A., Danly, L., Cambridge University Press: Cambridge
- (65)
- (66) Laughlin, G., Bodenheimer, P., 1994, ApJ, 436, 335
- (67)
- (68) Laughlin, G., Różyczka, M., 1996, ApJ, 456, 279
- (69)
- (70) Laughlin, G., Korchagin, V., Adams, F. C., 1997, ApJ, 477, 410
- (71)
- (72) Mathis, J. S., Rumpl, W. & Nordsieck, K. H., 1977, ApJ, 217, 425
- (73)
- (74) McCaughrean, M. J., O’Dell, C. R., 1996, AJ, 111, 1977
- (75)
- (76) Miyake, K., Nakagawa, Y., 1993, Icarus, 106, 20
- (77)
- (78) Monaghan, J. J., 1992, ARA&A, 30, 543
- (79)
- (80) Monaghan, J. J. & Gingold, R. A., 1983, J. Comp. Phys., 52, 374
- (81)
- (82) Morris, J. P., Monaghan, J. J., 1997, J. Comp. Phys., 136, 41
- (83)
- (84) Murray, J., 1995, PhD thesis: Monash University
- (85)
- (86) Murray, J., 1996, MNRAS, 279, 402
- (87)
- (88) Nelson, A. F., Benz W., Adams, F. C., Arnett, W. D., 1998, ApJ, 502, 342 (Paper I )
- (89)
- (90) O’Dell, C. R., Wen, Z., 1994, ApJ, 436, 194
- (91)
- (92) Osterloh, M., Beckwith, S. V. W., 1995, ApJ439, 288
- (93)
- (94) Pickett, B. K., Durisen, R. H., Link, R., 1997, Icarus, 126, 243
- (95)
- (96) Pickett, B. K., Cassen, P., Durisen, R. H., Link, R., 1998, ApJ, 504, 468
- (97)
- (98) Pickett, B. K., Cassen, P., Durisen, R. H., Link, R., 1999, ApJ, Submitted.
- (99)
- (100) Pollack, J. B., McKay, C. P., Christofferson, B. M., 1985, Icarus, 64, 471 (PMC)
- (101)
- (102) Pollack, J. B., Hollenbach, D., Beckwith, S., Simonelli, D. P., Roush, T. & Fong, W., 1994, ApJ, 421, 615
- (103)
- (104) Roddier, C., Roddier, F., Northcott, M. J., Graves, J. E., Jim, K., 1996, ApJ, 463, 326
- (105)
- (106) Shakura, N. J. & Sunyaev, R. A. 1973, A&A, 24, 337
- (107)
- (108) Shu, F. H., Adams, F. C. & Lizano, S., 1987, ARA&A, 25, 23
- (109)
- (110) Shu, F. H., Najita, J., Ostriker, E., Wilkin, F., Ruden, S., Lizano, S., 1994, ApJ, 429, 781
- (111)
- (112) Simonelli, D. P., Pollack, J. B. & McKay, C. P., 1997, Icarus, 125, 261
- (113)
- (114) Skrutskie, M. F., Meyer, M. R., Whalen, D., Hamilton, C., 1996, AJ, 112, 2168
- (115)
- (116) Spaute, D., Weidenschilling, S. J., Davis, D. R., Marzari, F., 1991, Icarus, 92, 147
- (117)
- (118) Turner, N. J. J., Bodenheimer, P. & Bell, K. R., 1997, ApJ, 480, 754 (TBB)
- (119)
- (120) Walker, C. K., Adams, F. C., Lada, C. J., 1990, ApJ, 349, 515
- (121)
- (122) Weidenschilling, S. J., 1984, Icarus, 60, 553
- (123)
- (124) Weidenschilling, S. J., Ruzmaikina, T. V., 1994, ApJ, 430, 713
- (125)
- (126) Weidenschilling, S. J., 1997, Icarus, 127, 290
- (127)
- (128) Wooden, D., Butner, H., Harker, D., Woodward, C., 1999, In prep.
- (129)
| Name | Number of | Disk | Opacity | End Time |
|---|---|---|---|---|
| Particles | Radius (AU) | Factor | (TD=1) | |
| I2lo | 16520 | 50 | 1.6 | |
| A2lo | 16520 | 50 | 6.0 | |
| I2me | 33399 | 50 | 1.8 | |
| A2me | 33399 | 50 | 6.0 | |
| B2m1 | 33399 | 50 | 0.001 | 6.0 |
| B2m2 | 33399 | 50 | 0.010 | 6.0 |
| B2m3 | 33399 | 50 | 0.050 | 6.0 |
| B2m4 | 33399 | 50 | 0.075 | 6.0 |
| B2m5 | 33399 | 50 | 0.025 | 6.0 |
| I2hi | 101016 | 50 | 1.8 | |
| A2hi | 101016 | 50 | 6.0 | |
| B2h3 | 101016 | 50 | 0.050 | 6.0 |
| H2h3 | 101016 | 50 | 0.050 | 6.0 |
| a2lo | 16182 | 100 | 3.0 | |
| a2me | 33134 | 100 | 2.3 | |
| a2hi | 100971 | 100 | 3.0 |