GRB as explosions with standard power
Abstract
We show that the distribution of observed energies of GRB with known redshifts can be explained by the hypothesis of the standard energy release ergs. Two situations are possible, either the beaming angle differs from burst to burst, or there is a universal emssion diagram in each burst, the observed difference being due to different viewing angles.
Key Words.:
Gamma rays: bursts1 Introduction
Standard energy release is a general phenomenon in astrophysical sources with (nearly) fixed masses. The most bright example is provided by core collapse supernova explosions. When a neutron star results from such a collapse, its binding energy is released in the form of neutrino. Measurements of neutron star masses all indicate a strikingly very narow range near 1.4 (Thorsett and Chakrabarty 1999), although the underlying fundamental reason for this is still unknown. Another example is type Ia supernovae involving explosions of a white dwarf with the Chandrasekhar mass. Apparently, a similar standard energy must be released during binary neutron star coalescences, mostly in the form of gravitational waves (roughly, 90%) and neutrino (roughly, 10%), as follows from numerical calculations (Ruffert and Janka 1998).
Can gamma-ray bursts (GRB) join the class? Although their origin has not been yet firmly established, the most probable models include binary neutron star coalescences (as first suggested by Blinnikov et al. 1984) and collapses of very massive stars (e.g. Woosley 1993, Paczyński 1998). Note that assuming GRB as standard candles and using the position of GRB 970228 (the first GRB with low-energy afterglow) on the – diagram, its redshift was predicted to be immediately after its discovery (Lipunov, Postnov, Prokhorov 1997; Lipunov 1998), which is in the excellent agreement with measurements of the redshift of the host galaxy of this GRB () made two years later (Djorgovski et al. 1999). This may be not a pure coincidence.
Intense optical studies of GRBs have resulted in a rapidly increasing number of redshift measurements. Now redshifts of 8 GRBs are known (see Table 1). This enables us to calculate distances and effective (i.e. assuming spherical symmetry) energy release in gamma-rays . This energy, as seen from Table 1, varies in a broad range from erg to erg. This fact can be treated as a wide proper luminosity function of GRBs.
The actual energy release may be significantly lower than due to a possible beaming of gamma-ray emission. If beaming angle , then the actual energy release .
In the general case, the distribution of may be affected by both the proper energy release distribution and the beaming factor distribution . Here we show that the existing observations of GRBs conform with the hypothesis of a standard energy release in the underlying GRB explosions, and the apparent dispersion in the detected energy can be explained by the beaming factor . The observed detected energy can be explained by both distribution of beaming angles and by some universal shape of the emission diagram in GRBs.
2 Three groups of the observed GRB energies
In Table 1 we list eight GRBs with measured redshifts. We excluded GRB 980425, which possibly relates to SN 1998 bw in a close (40 Mpc) galaxy. We included into the Table 1 GRB 980329 with high redshift 5, which was indirectly deduced (Palazzi et al. 1998; Fruchter 1999) and can be excluded from our consideration. This however has an insignificant effect on the final conclusions.
| GRB | Beaming | |||
|---|---|---|---|---|
| 970228 | 0.695b) | 1 | NO | |
| 970508 | 0.835 | 1 | NO | |
| 971214 | 3.418 | 50 | ||
| 980329 | 5? | 500 | ||
| 980613 | 1.096 | 1 | ||
| 980703 | 0.966 | 20 | ||
| 990123 | 1.60 | 300 | YES | |
| 990510 | 1.62c) | 30 | YES |
a) Data from Briggs et al. 1999
b) Djorgovski et al. 1999
c) Vreeswijk et al. 1999
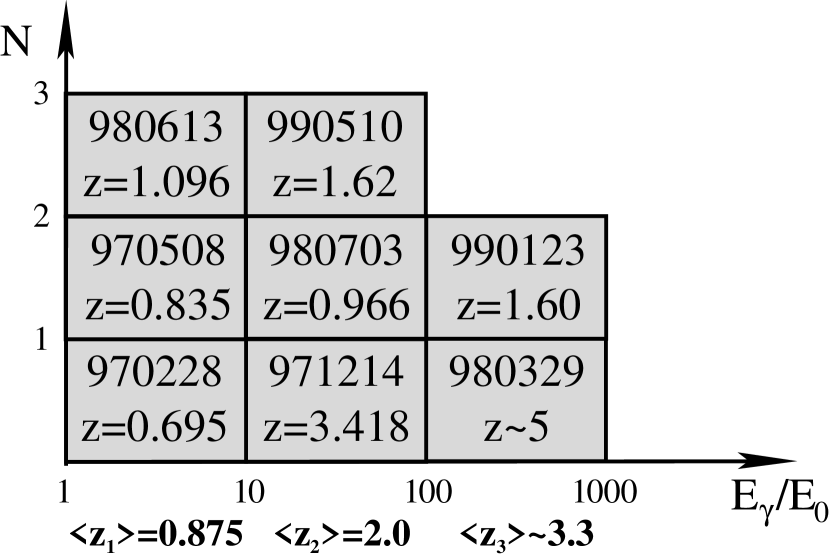
Of these eight GRBs, three (GRB 970228, GRB 970508, GRB 980613) display about the same effective energy release of – ergs. They form the weakest group of GRBs. Another three GRBs (GRB 971214, GRB 980703, GRB 990510) form the intermediate group with the effective energy release – ergs, i.e. 20–50 times as bright as the first group. The last two GRBs (GRB 980319 and GRB 990123) are the brightest among all GRBs with the effective energy release and ergs, respectively (500 and 300 times brighter than the first group). We should note that the dispersion in energy release for GRBs from the first group is much smaller than for bursts from the second and the third groups. The mean reshift in these groups shows tendency to grow with energy: , , . This correlation is natural in the hypothesis of beaming: the narrowest beams corresponding to the largest observed energies should be detected less frequently from a given radius and thus will be observed from larger distances to give a comparable number of detections with weaker energies.
GRB 990123 shows some evidence for a significant beaming (Kulkarni et al. 1999) which is deduced from the break in the optical afterglow light curve. Such a break is expected to occur when the Lorentz-factor of the expanding relativistic shell matches the inverse beaming angle (Rhoads 1999). The true energy release for this GRB thus becomes erg, close to the weakest group of GRB effective energy. This may imply that GRBs from the weakest group occur almost spherically-symmetrically and for this bursts and the energy release ergs is a fundamental value for all GRBs. A smooth broad-band change is observed in the slope of the afterglow of the recent GRB 990510 (Harrison et al. 1999), which can also be explained by beaming, so the actual energy release in this case is again smaller. In contrast, no indication of beaming is seen for longest observed optical afterglows of GRB 970508 and GRB 970228, and for them the observed energy release is approximately the same, about erg.
3 Standard GRB energy release
Let us postulate the standard energy release in all GRBs to be ergs. The three groups of GRBs by their ratio are schematically shown in Fig. 1. This distribution is fairly flat and can be treated in two different ways. It can both reflect the dispersion of in beaming factors of individual bursts and be explained by a universal shape of the gamma-ray emission diagram of GRBs with the standard energy release.
3.1 Beaming angle distribution
Consider first beaming angle distribution. In this hypothesis the standard energy ergs is assumed to be deposited into cones with different opening angles . For the sake of simplicity we shall assume Euclidean space. Then the observed energy in each group is
| (1) |
and by assumption
| (2) |
Let be the spatial concentration of GRB sources, be the fraction of sources with corresponding so that
| (3) |
The limiting distance from which a GRB form i-th group can be observed is so that the number of i-th events potentially observed is
| (4) |
Solving Eqs. (1-4) we obtain , , and the corresponding opening angles , (we used which is valid for ). This distribution is illustrated by Fig. 2.
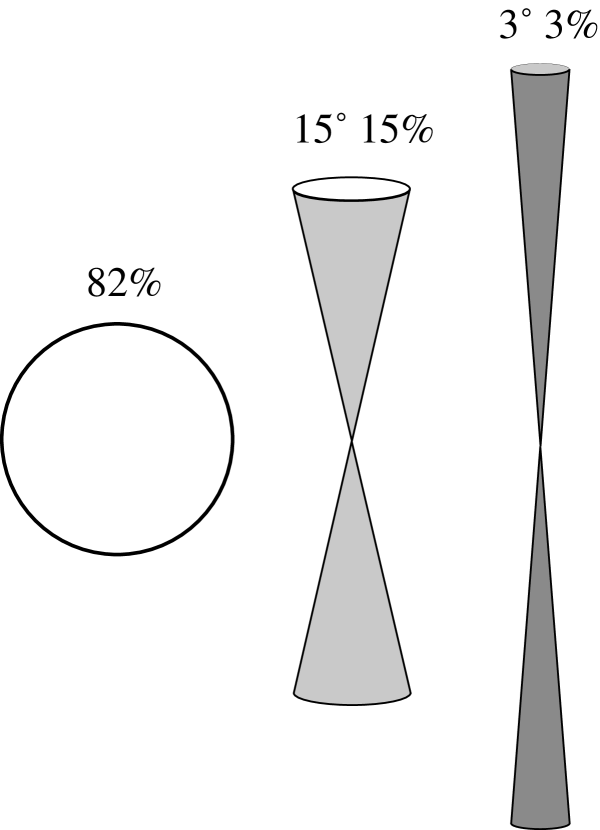
.
3.2 A universal diagram of gamma-ray emission
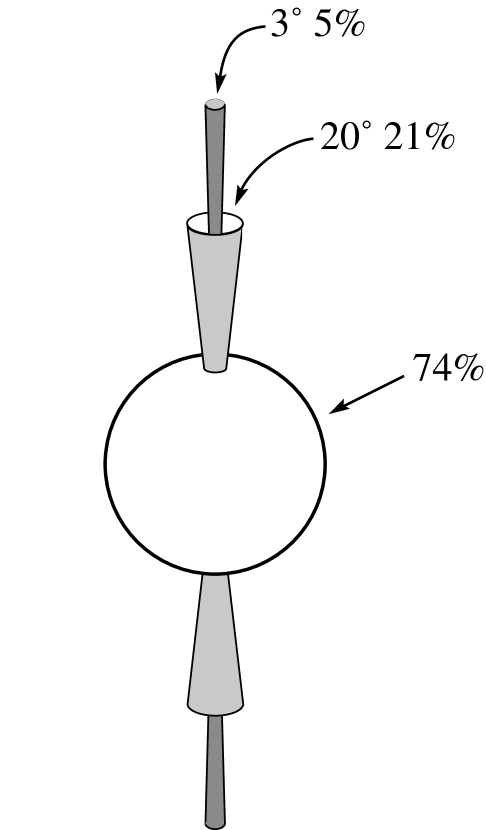
In this hypothesis we assume that for some reason in all GRB the standard energy is always deposited into a universal emission diagram, with the observed number of events from different GRB groups coming from different viewing angles with respect to the symmetry axis of the diagram (Fig. 3). Then Eq. (1) modifies into
| (5) |
where characterizes the fraction of the total energy which is collimated into the cone , Eq. (2) reads
| (6) |
normalization (3) transits into
| (7) |
(here we neglect overlapping between the cones since ; this would yield a minor correction), and Eq. (4) becomes
| (8) |
Solving system (6-8) we arrive at , , collimated into the cones with opening angles (isotropic emission), , and , respectively. Note that in this variant the total energy release turns out to be by 22% larger and is ergs. This diagram is illustrated by Fig. 3.
4 Conclusions
We have shown that the observed distribution of GRB energies can be explained by the hypothesis of the standard energy release ergs. Two situations are possible, either the beaming angle differs from burst to burst, or there is a universal emssion diagram in each burst, the observed difference coming from different viewing angles. At this stage, we don’t discuss any physical model for such a diagram. Possibly, GRBs observed as different parts of thus shaped energy release can have different physical features (for example, some spectral or temporal peculiarities).
The opposite point of view is that the energy release in GRBs can vary by orders of magnitude and beaming is not significant (e.g. Totani 1999). Although so far we can not distinguish between different possibilities (i.e. whether the observed distribution is due to different beaming, or due to different true energy release, or both), the increased statistics of GRB redshift measurements, which is expected in the near future, can be used to discriminate between these points of view.
The increase in statistics, however, cannot discriminate between the two possible variants discussed in this paper, because both beaming angle distribution and the universal diagram can discribe an arbitrary number of groups of GRBs with an arbitrary number of events inside each group. The hypothesis of a standard energy release can be discarded if (a) a GRB with mush smaller than is observed; (b) an inconsistency is found of the predicted cone angle to the value mesaured by some means; (c) the mean redshift of GRB in groups does not increase with observed energy . Apart form a doubtful case of GRB 980425 possibly associated with SN 1998bw, no GRBs with smaller than erg energy have been observed. The determination of beaming angles from the existing observational data is also not very accurate now (see Sari, Piran and Halpern 1999 for more detail). The mean redshift of GRBs do increase, on average, with observed energy (see Fig. 1).
The authors thank S.I.Blinnikov, N.I.Shakura and I.G.Mitrofanov for discussions. The work is partially supported by Russian Fund for Basic Research through Grant 99-02-16205 and INTAS grant 96-315.
References
- (1) Blinnikov S.I., Novikov I.D., Perevodchikova T.V., Polnarev A.G., 1984, SvA Lett. 10, 177
- (2) Briggs M.S., Band D.L., Kippen R.M., et al., 1999, Ap in press (astro-ph/9903247)
- (3) Djorgovski S.G., Kulkarni S.R., Bloom J.S., Frail D.A., 1999, GCN 289
- (4) Fruchter A. et al. 1999, ApJ in press
- (5) Harrison F.A., et al., 1999, astro-ph/9905306
- (6) Kulkarni S.R., et al., 1999, Nature 398, 389
- (7) Lipunov V.M., 1998, in Highlights of Astronomy 11B, 779
- (8) Lipunov V.M., Postnov K.A., Prokhorov M.E., 1997, astro-ph/9703181
- (9) Paczyński B., 1997, ApJ 499, L45
- (10) Palazzi E., et al. 1998, A&A 336, L95
- (11) Rhoads J.E., 1999, ApJ submitted, astro-ph/9903399
- (12) Ruffert M., Janka H.-Th., 1998, A&A 338, 535
- (13) Sari R., Piran T., Halpern J., 1999, astro-ph/9903339
- (14) Thorsett S.E., Chakrabarty D., 1999, ApJ 512, 288
- (15) Totani T., 1999, MNRAS submitted, astro-ph/9907001
- (16) Vreeswijk P.M., Galama T.J., Rol E., et al., 1999, GCN 324
- (17) Woosley S.E., 1993, ApJ 405, 273