Luminous “Dark” Halos
Abstract
Several lines of evidence suggest that cold, dense gas clouds make a substantial contribution to the total mass of dark halos. If so then physical collisions between clouds must occur; these cause strong, radiative shocks to propagate through the cold gas, with the startling implication that all “dark” halos must be luminous. The expected luminosity is a strong function of halo velocity dispersion, and should contribute a significant fraction of the observed X-ray emission from clusters of galaxies, if dark halos are predominantly made of cold gas.
Existing data do not exclude this possibility; indeed two particular expectations of the luminous-halo model are borne out in the X-ray data, and thus give support to the cold-cloud dark matter model. First we find a luminosity-temperature correlation of the form , as seen in recent analyses of cluster samples. Secondly the anticipated spectra have substantially more power at low energies than isothermal bremsstrahlung spectra, and might account for the observed “excess” EUV emission seen from some clusters. The successes of the luminous-halo model are particularly remarkable because the theory has no free parameters or ad hoc elements. The model can be tested by the X-ray satellite Chandra, which should resolve the Virgo cluster into point-like, transient X-ray sources. Non-detection of any such sources by Chandra can constrain the contribution of cold gas clouds to be % of the total matter density in the Universe, assuming Virgo to be representative.
Research Centre for Theoretical Astrophysics,
School of Physics A28,
University of Sydney, NSW 2006
m.walker@physics.usyd.edu.au
Keywords: dark matter — galaxies: clusters — galaxies: halos
1 Introduction
Several years ago it was proposed that cold gas could make up a significant fraction of the dark matter in spiral galaxies (Pfenniger, Combes & Martinet 1994). This particular proposal advocated massive, fractal gas clouds distributed in a thin disk, but subsequent authors have contemplated spherical clouds in the (dynamically more conventional) context of a quasi-spherical halo (Henriksen & Widrow 1995; de Paolis et al 1995; Gerhard & Silk 1996; Walker & Wardle 1998). Walker & Wardle’s (1998) model for Extreme Scattering Events (radio wave lensing events) requires that essentially all of the Galactic dark matter be in the form of cold, dense gas clouds. Data on Galactic emissions – notably in the -ray region (de Paolis et al 1995; Kalberla, Shchekinov & Dettmar 1999) – and LMC microlensing properties (Draine 1998; Rafikov & Draine 2000) do not exclude this possibility. A natural question, then, is to ask whether all of the dark matter in all halos (galaxies and clusters of galaxies) might assume the form of cold gas. However, this extension precipitates a conflict with established ideas, because clusters of galaxies are generally assumed to be so large that they are representative samples of the Universe, and well-known arguments favour a predominantly non-baryonic Universe (e.g. Peebles 1993). One possible resolution of this conflict has been considered by Walker & Wardle (1999), who emphasised the loopholes in the case for non-baryonic dark matter. Even in the absence of a resolution, though, it is useful to contemplate purely baryonic models of dark halos, in order to clarify the strengths and weaknesses of these models; that is the spirit of this paper.
Three discoveries in the last two years have promoted the basic idea of dark matter in the form of cold, dense gas clouds. First Walker & Wardle (1998) were able to explain the enigmatic “Extreme Scattering Events” (Fiedler et al 1987) as radio-wave lensing events caused by the photoionised surfaces of cold clouds. This model requires “lens” radii of order 2 AU, individual masses in the planetary range, and a total mass which dominates the mass of the Galaxy. Secondly, Dixon et al (1998) found that the -ray background contains a substantial component attributable to the Galactic halo; given that the diffuse gas in the Galactic plane is the principal feature of the -ray sky (e.g. Bloemen 1989), this is prima facie evidence for unseen gas in the Galactic halo (de Paolis et al 1995). Thirdly, Walker (1999: W99) showed that the cold-cloud model predicts a relation between visible mass and halo velocity dispersion, , which agrees extraordinarily well with data on spiral galaxies. Indeed this result appears to underlie the Tully-Fisher relation, with the latter following when most of the visible mass is in stellar form. In the model of W99 these results arise from consideration of the collisions which must occur between clouds (Gerhard & Silk 1996); such collisions destroy the colliding pair, and in this picture the visible content of any halo increases with time as dark matter is converted to visible forms.
The success of this simple picture of (visible) galaxy assembly encourages further investigation into the physics of cloud-cloud collisions. One of the most basic features of the collision process is that it involves strong shocks in the cold gas. By virtue of the high particle densities () within the clouds, the post-shock radiative cooling time-scales are very short and the shocks are radiative. This means that the bulk of the kinetic energy dissipated during a collision goes into radiation, implying a minimum level of emission from “dark” halos. This is a key prediction which must be squared with the data: is the model in conflict with observations? Here we investigate that question and answer in the negative.
The model does lead to a highly unconventional picture of the origin of X-ray emission in clusters of galaxies, and some readers will regard this as intrinsically problematic because they believe the phenomenon to be well understood. However, in both the proposed picture and the conventional one, X-ray emission arises from a two-body collision process acting in an isothermal gas in virial equilibrium in the cluster potential; consequently the two theories are degenerate in many respects, as will be evident in §3. One aspect of the new theory is, however, so strikingly different from the accepted interpretation that there will be no difficulty in deciding between the two, once new data are acquired. Because of the simplicity with which this issue will be decided, no attempt is made here to model anything other than the fundamental properties of the X-ray emission. These properties are consistent with existing data and, bearing in mind that the new theory has no free parameters, it seems appropriate to accept the model as a bona fide alternative for the time being, pending the outcome of the test described in §4.
We follow W99 in modelling dark halos as isothermal spheres which are entirely composed of dense gas clouds; we adopt a Maxwellian distribution function, and for simplicity we assume that all clouds have the same mass and radius. The expected properties of the emission are presented in the next section. Because the predicted luminosity is a steep function of halo velocity dispersion, we then (§3) focus on the application to clusters of galaxies, where intense X-radiation is expected. Implications of the theory and ways in which it can be tested are given in §4.
2 Basic properties of the emission
In order to calculate the emissivity, , of a halo we need to estimate the rate at which kinetic energy is dissipated in collisions between clouds. Essentially all collisions are highly supersonic, so we can apply conservation of momentum to each element of area, , of the two colliding clouds, with local surface density (these surface densities being measured parallel to the relative velocity vector). If each cloud has speed , in the frame of the centre-of-mass, before the collision, then for a fully inelastic collision the final speed is just . The change in kinetic energy in each elemental area is thus . If we define to be the total kinetic energy dissipated as a fraction of the total initial kinetic energy (in the centre-of-mass frame), then we have
where is mass of a cloud. Evidently is a function of impact parameter, , for the collision, and depends on the density profile within the cloud. We shall be primarily concerned with the average value :
where is the cloud radius. We have evaluated for polytropic cloud models of indices , with the results respectively.
A firm model for the density profile of the putative dark clouds has not yet been constructed. Wardle & Walker (1999) suggest that solid molecular hydrogen plays a key rôle in their thermal regulation, in which case most of the radiative losses are likely to occur from a thin surface layer because the precipitation/sublimation balance is very temperature sensitive. Beneath this radiative layer the dominant cooling is expected to come from spectral lines which are very optically thick, and we anticipate that these regions are thus unstable to convection (Clarke & Pringle 1997). We therefore adopt a polytropic model with as an approximation to the likely cloud density structure, leading to .
In deriving the rate of collisions between clouds, , we assume that the cloud population follows a Maxwellian velocity distribution with total density , leading to (W99)
( is henceforth the average surface density of a cloud), with a mean kinetic energy of dissipated per collision. (Note that the numerical coefficient in eq. 3 differs slightly from W99’s eq. 1, because we have specified a Maxwellian distribution function. Similar, slight differences will be evident when comparing some of our subsequent results with those of W99.) It is now trivial to determine the local emissivity of the halo: . We employ W99’s eq. 3 for the halo density distribution – implicitly assuming that the dark halo is entirely made up of cold clouds – whence the intensity
where is the projected distance of the line-of-sight from the centre of the halo, in units of the core radius, , and . Here is the time which has elapsed since the halo virialised; we adopt Gyr, corresponding to halos which virialised at redshifts . The total luminosity can be found simply by integrating eq. 4, leading to
This result may also be written as , where , emphasising the connection with the pseudo-Tully-Fisher relation derived by W99. The average column density of the individual clouds can be measured by fitting the theoretical relation to data for spiral galaxies (W99); for our Maxwellian distribution function this yields for Gyr. We can now evaluate eq. 5 numerically:
where ; this implies very luminous halos for clusters of galaxies ().
The equality is important because it demonstrates a close tie between the predicted luminosity and the observed Tully-Fisher relation. That is, if W99’s theory is a correct explanation for the Tully-Fisher relation, then a result very similar to equation (6) must follow for the bolometric luminosity of the halo; this is independent of the value of , or the number density and spatial distribution of the clouds.
What about the spectrum of the radiation? For the present it suffices to note two general points. First, the radiation is thermal; and secondly, a fiducial temperature for the radiation is that of the shocked gas. This temperature can be estimated from the jump conditions for a strong shock: , where is the mean molecular mass. There is no unique value of the shock speed, , but so keV, and this gives us a crude measure of the typical photon energy. In this way we see that the halos of dwarf galaxies () should emit mostly in the optical and near-IR; this radiation is observable in principle, but we note the low luminosities implied by eq. 6 (). Normal and giant-galaxy halos should emit mainly far- and extreme-UV, which is not ordinarily observable because of the large opacity of the Galactic interstellar medium in these bands. The halos of clusters of galaxies should emit X-radiation which is both observable and at a level which is easy to detect. Consequently we expect that clusters offer the best prospects for testing our theory, and we now focus our attention on these systems.
3 X-ray emission from clusters of galaxies
The first question we must address is whether the predicted luminosity is consistent with the data for clusters. Conventionally the observations are interpreted in terms of two components: one due to hot gas spread throughout the cluster, and another due to a central “cooling flow” (e.g. Fabian 1994). Cooling flows introduce a large scatter in the observed luminosity-temperature correlation (Fabian et al 1994). Our model involves X-ray emission arising from cloud collisions throughout the cluster, not just the central regions, and must be compared with the cluster-wide component; it is this component which is meant henceforth when we refer to the data.
The systematic trend of luminosity with X-ray spectral temperature, , has been the subject of several recent studies (Markevitch 1998; Arnaud & Evrard 1999; Reichart, Castander & Nichol 1999), with very similar results: (Reichart et al 1999). In our model all temperatures scale with , so eq. 5 implies a close parallel with the data: . We note also the study of Wu, Xue & Fang (1999) which, although it did not exclude the cooling flow contribution to , employed such a large sample of clusters that the deduced correlation was nevertheless very precisely determined: , in agreement with the theory we have presented.
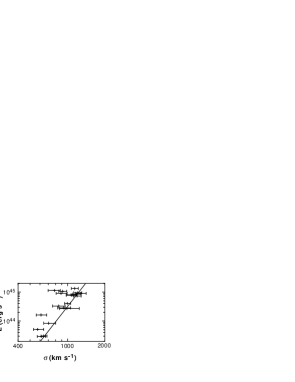
For clusters which have detailed optical spectroscopy in addition to the X-ray data, we can assess the dependence of directly on , as measured from cluster galaxy velocity dispersions. Contamination by field galaxies, small sample sizes, sub-clustering and anisotropic velocity distributions all mean that measuring is not easy. Girardi et al (1996) have made careful estimates of in 38 rich clusters; their sample has 13 and 6 clusters in common with the samples of Markevitch (1998) and Arnaud & Evrard (1999), respectively. Taking bolometric luminosities (for ) from the latter data sets, and the velocity dispersions determined by Girardi et al (1996), we arrive at the points shown in figure 1. Also shown is the theoretical prediction given by eq. 6, from which we see that the data are all consistent with or in excess of the prediction. In the context of our model, a measured luminosity which is significantly in excess of the prediction must be interpreted in one of two ways: as emission from diffuse hot gas, spread throughout the cluster (see §4), or as a halo which virialised relatively recently (cf. eq. 5), e.g. in a cluster merger event.
Is the spatial distribution of emission within clusters consistent with our theory? Our model has a mean intensity profile (eq. 4) which is identical to the standard model profile (e.g. Sarazin 1988) with ; this is an adequate approximation for many clusters (Jones & Forman 1984). Exact agreement should not be expected because an isothermal sphere is only a crude approximation to the likely dark halo density distribution. A more realistic model distribution might include many smaller halos, perhaps associated with individual cluster galaxies (cf. Moore et al 1999) and these would give local enhancements in the mean X-ray intensity, with modest attendant spectral changes. An important aspect of the present model is that it predicts a graininess in the intensity profile, at any instant, because the total cluster emission is contributed by a large number of discrete sources. This feature is fundamental to the theory and admits an unequivocal test with high resolution imaging data, as discussed in §4.
Attempting to predict the spectra resulting from cloud collisions is a formidable task. Consider first that the unshocked gas (density , and temperature of several Kelvin) is, initially, entirely opaque to X-rays as a result of the bound-free opacities of hydrogen and helium. Because of the high temperature of the shocked gas, the resultant photons ionise the upstream material (cf. Shull & McKee 1979), thus erasing the principal source of opacity. For collisions occurring in clusters the mean energy dissipated per unit cloud mass is so large, roughly times the total chemical binding energy of the cold gas, that we expect the ionisation fronts to break out of the clouds very quickly. Thereafter the primary opacity presented by the unshocked gas is due to electron scattering. Each X-ray photon is expected to scatter hundreds of times before escaping, with a few eV exchanged between electron and photon on each scattering. Thus, although the thermal coupling is loose, in total there is a significant exchange of energy between the escaping photons and the upstream gas. Add to this the complex, time-dependent geometry associated with shocks in a pair of colliding clouds, and we see that it will not be easy to arrive at reliable quantitative predictions of the spectra even for single collisions. The observed spectrum is, of course, a sum of the spectra of a large number of collisions, with a spread in collision speed; but this aspect of the calculation is more straightforward, as the cloud kinetics are likely to be reasonably well approximated by a Maxwellian distribution function.
It is beyond the scope of this paper to attempt a prediction of the spectrum, instead we confine our attention to a single qualitative point: the observed spectra should exhibit a strong low-energy component. One can easily see that such a component should be present because the post-shock gas cools as it flows downstream, and emission from this gas will be predominantly in the soft X-ray and EUV bands. To illustrate this point we have calculated an idealised spectrum which neglects radiative transfer through the upstream gas. This calculation assumes: a Maxwellian cloud distribution function; the strong shock limit (cold upstream gas); pure bremsstrahlung emission; and the optically thin limit. The resulting spectral form is given by
where , , , and
The spectrum of eq. 7 is shown in figure 2, along with a bremsstrahlung spectrum from isothermal gas with , representing the conventional theory of cluster X-ray emission. Relative to the standard theory it can be seen that this calculation predicts a much broader spectrum which peaks at lower energies, with a much larger fraction of the power emerging at .
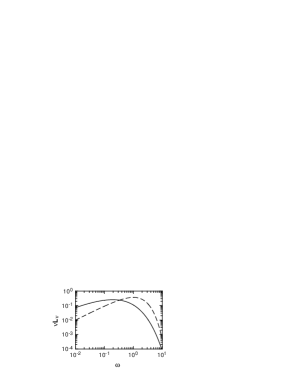
We emphasise that this calculation is only intended to be illustrative; the assumptions employed are not good approximations to the actual physical conditions, and the computed spectrum is therefore not quantitatively correct. However, the qualitative point that a high EUV luminosity is expected, relative to the X-ray luminosity, should be model independent. This result is of particular current interest as it has recently become apparent that some clusters have EUV luminosities which are much higher than expected on the basis of an isothermal bremsstrahlung model for the X-ray emission (Mittaz, Lieu & Lockman 1998; Lieu, Bonamente & Mittaz 1999). It is not currently known whether this difficulty extends to all clusters. Various models have been proposed specifically to account for these EUV data (e.g. Sarazin & Lieu 1998), but dark matter in the form of cold clouds may be able to explain this emission without the need for such ad hoc introductions.
The implication of a relatively large luminosity at low energies raises the question of whether the proposed model is consistent with the known X-ray spectra of clusters, which for the most part are well described by optically thin emission from a single-temperature hot gas. In particular, the model demands a somewhat surprising coincidence whereby a complex amalgam of physics leads to apparently simple X-ray spectra. Unfortunately this issue is difficult to address because it requires a detailed computation of the spectral shape. By contrast one can confidently assert a high EUV luminosity, because even a modest difference in spectral index, over a large range in photon energy, will manifest itself as a significant difference in flux. One should, therefore, also expect real clusters to show significant departures from the conventional model at very high X-ray energies, although it is not clear whether an “excess” or a “deficit” is to be expected at these energies. (One would, for example, need to know the precise form of the the dark matter distribution function in order to decide this question.) Observationally, studies at very high X-ray energies are difficult because of the paucity of photons, but in at least some cases, e.g. the cluster A2199 (Kaastra et al 1999), there is evidence of an excess relative to the conventional model. We emphasise that for the model we have presented, the issue of the detailed spectral shape is not a critical one at present, because a powerful test of the theory is available via the predicted spatial distribution (see §4).
4 Discussion
It is important to recognise that the theory presented in §§2,3 is not incompatible with hot, diffuse gas contributing to the observed X-ray emission, rather the opposite in fact. W99 computed the total visible mass which should accumulate within a halo of given velocity dispersion, as a consequence of cloud-cloud collisions (all of which disrupt the cold clouds): after an interval of 10 Gyr. W99 gave no predictions as to what form this visible material should take (e.g. stars vs. diffuse gas). The material released by collisions is initially just gas in free, near-adiabatic expansion, with a centre-of-mass moving on a ballistic trajectory in the cluster potential. As it interacts with the intracluster medium, this gas can be shock heated to high temperatures. We note that in a cluster the mean particle densities are very low, implying long cooling times and a large fraction of could therefore be in the form of hot, diffuse gas. In consequence, phenomena such as the Sunyaev-Zel’dovich (SZ) effect, which are contingent on the existence of tenuous hot gas, are expected to be present in our theory. Because we are ascribing a substantial fraction of the observed X-ray emission to cloud collisions, it is clear that the expected magnitude of the SZ effect is diminished relative to the standard theory of cluster X-ray emission. However, accurate measurements would be necessary to distinguish between our theory and the standard model, whereas the SZ effect has only recently been convincingly detected at all (e.g. Rephaeli 1995). A referee has brought to my attention the point that the spatial distribution of SZ decrement can be used to test the proposed model. The theory predicts that the diffuse, hot gas should lie mostly within a radius of order of the cluster centre — i.e. more compact than is conventionally assumed. Existing images (e.g. Carlstrom et al 1999) appear to be consistent with the proposed model, in that they indicate characteristic radii comparable to for the underlying gas distribution. We note that if the theory presented here is correct then the SZ effect is unlikely to prove useful as a technique for measuring the distances to clusters.
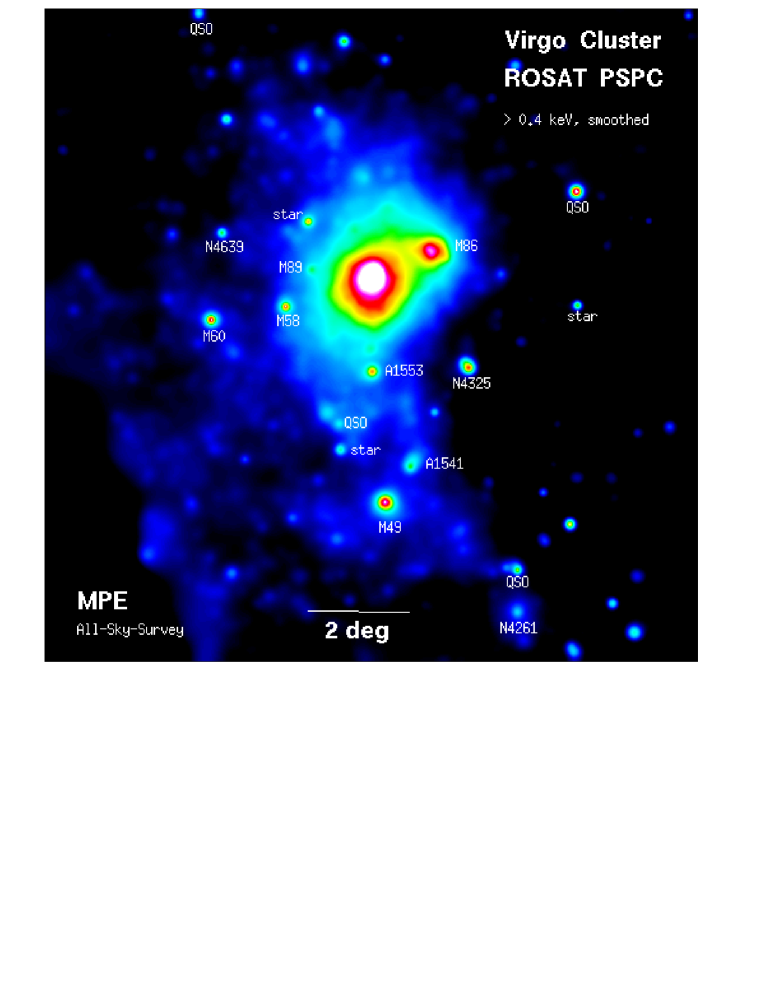
Although our theory predicts a similar mean intensity profile (eq. 4) to that of the conventional model, the instantaneous distribution consists of a large number of point-like sources, and the most fundamental test of the theory would be to attempt to resolve the emission from a cluster into its component sources. Each of these sources should be transient, with a characteristic time-scale , and for AU this is days. The mean luminosity is (this estimate assumes a virial temperature of order 10 K for the clouds, cf. Wardle & Walker 1999); in turn this implies a total number of sources contributing to the cluster luminosity. In the case of the Virgo cluster, the nearest rich cluster of galaxies (, Mpc), we deduce: a mean flux of roughly ; days; a total number of order 16,000 sources; and a peak source density (in the cluster core) of . These estimates should be interpreted as order-of-magnitude estimates only; nevertheless they indicate that the X-ray satellite Chandra should easily detect individual transients within the Virgo cluster, even in relatively short observations of an hour or so. By virtue of Chandra’s high resolution imaging, source confusion should not be a problem even in the core of the cluster. The ROSAT satellite was less sensitive than Chandra, and had much poorer angular resolution, but even the ROSAT All Sky Survey (RASS) should have revealed the brightest of the ongoing collisions at the periphery of the Virgo cluster, where source confusion is expected to be less of a problem than in the core. Inspection of the publicly available RASS image of Virgo (reproduced in figure 3) suggests that this is indeed the case, as the outer regions of the cluster appear to possess a great deal of compact substructure. These data are discussed in Böhringer et al (1994).
What are the implications of non-detection of the predicted population of transient sources in Virgo? Chandra’s resolution and sensitivity are such that the predicted sources should be detectable, and not confused with each other, even if their fluxes are an order of magnitude lower than the predicted value. This is a sufficiently wide margin for error (in the modelling) that observations with Chandra should be definitive: if Chandra does not detect these sources, then clouds of the type we have discussed make only a small contribution to the dark matter in the Virgo cluster. As the collision rate, and hence the expected number of detectable sources, is proportional to the square of the number of clouds per unit volume, if no collisions are observed where are expected, then the putative clouds comprise % of all the matter in Virgo. Entities as large as clusters are widely regarded as representative samples of the Universe as a whole, so in turn this can be taken as a limit on the contribution of cold clouds to the total matter density of the Universe.
In principle, non-detection by Chandra admits another possible interpretation: collisions which are so brief that less than five photons are collected by Chandra from each event; this circumstance would require cloud masses . This, however, is not a self-consistent model: the condition , from the Tully-Fisher relation (§2; W99), with the simultaneous requirement that the cloud temperature be greater than the temperature of the microwave background (3K), fixes a lower limit on the cloud mass of . Neither of these requirements can be relaxed without compromising the model, so Chandra will provide a strong test of the theory. We also note that the thermodynamic (temperature) requirement alone demands very small radii, , for , making it difficult to explain the extreme scattering events (Walker & Wardle 1998) if low-mass clouds are invoked.
An interesting qualitative point is that the X-ray spectra of galaxy clusters typically exhibit iron abundances of order 0.3 (in solar units: Mushotzky & Loewenstein 1997). If a large fraction of the X-ray emission does indeed arise from cloud-cloud collisions, then these clouds presumably contain iron and other heavy elements. (This conclusion can also be tested by Chandra observations.) The simplest interpretation of this point is that it indicates primordial non-zero heavy element abundances. This is highly unconventional, but no more so than the idea that all of the dark matter might be in the form of cold gas clouds. Indeed, as emphasised by Walker & Wardle (1999), the two ideas are linked: if all of the dark matter is baryonic, then consistency of the Big Bang nucleosynthesis calculations with the observed light element abundances requires that the Universe was inhomogeneous at the epoch of cosmic nucleosynthesis, and in turn this admits the possibility of primordial heavy element nucleosynthesis. This logic led Walker & Wardle (1999) to propose that the genesis of the (proto-)clouds involved a phase transition in the very early Universe (i.e. prior to the epoch of cosmic nucleosynthesis) – cf. Hogan (1978). The abundant iron in cluster X-ray spectra underlines this interpretation, thereby connecting the cold-cloud model directly to the physics of elementary particles.
5 Conclusions
We have shown that if the dark matter is entirely composed of cold gas clouds, then a substantial fraction of the observed X-ray emission from clusters should be due to physical collisions between these clouds. This possibility appears to be consistent with existing data. Indeed the form of the observed cluster luminosity-temperature correlation, and the measurement of high EUV luminosities for some clusters, both suggest that this process may well be occurring. If so then high-resolution images of the Virgo cluster should reveal a large number of point-like, transient X-ray sources contributing to the emission. Conversely, if these sources are not seen, then cold clouds of cannot contribute more than about 1% of the dark matter, either in clusters or, by extension, in the Universe as a whole.
Acknowledgements
I thank Mark Wardle for providing numerical polytropic density profiles, and for several useful discussions. Andy Fabian, Ron Ekers and Haida Liang contributed helpful advice on clusters.
References
Arnaud M., Evrard A.E. 1999, MNRAS, 305, 631
Bloemen H. 1989, ARAA, 27, 469
Böhringer H., Briel U.G., Schwarz R.A., Voges W., Hartner G., Trümper J. 1994 Nature 368, 828
Carlstrom J.E., Joy M.K., Grego L., Holder G.P., Holzapfel W.L., Mohr J.J., Patel S., Reese E.D. 1999 “Particle physics and the universe” eds L. Bergstrom, P. Carlson, C. Fransson (In press, astro-ph/9905255)
Clarke C.J., Pringle J.E. 1997, MNRAS, 288, 674
de Paolis F., Ingrosso G., Jetzer Ph., Roncadelli M. 1995, Phys. Rev. Lett., 74, 14
Dixon D.D., Hartmann D.H., Kolaczyk E.D., Samimi J.,
Diehl R., Kanbach G.,
Mayer-Hasselwander H.,
Strong A.W. 1998, New Ast., 3, 539
Draine B.T. 1998 ApJL 509, L41
Fabian A.C 1994, ARAA, 32, 277
Fabian A.C., Crawford C.S., Edge A.C., Mushotzky R.F. 1994, MNRAS, 267, 779
Fiedler R.L., Dennison B., Johnston K.J., Hewish A. 1987, Nature, 326, 675
Gerhard O., Silk J. 1996, ApJ, 472, 34
Girardi M., Fadda D., Giuricin G., Mardirossian F., Mezzetti M., Biviano A. 1996, ApJ, 457, 61
Henriksen R.N., Widrow L.M. 1995 ApJ 441, 70
Hogan C.J. 1978 MNRAS 185, 889
Jones C., Forman W. 1984, ApJ, 276, 38
Kaastra J.S., Lieu R., Mittaz J.P.D., Bleeker J.A.M.,
Mewe R., Colafrancesco S.,
Lockman F.J. 1999, ApJL, 519, L119
Kalberla P.M.W., Shchekinov Yu.A., Dettmar R.J. 1999, A&A, 350, L9
Lieu R., Bonamente M., Mittaz J.P.D. 1999, ApJ, 517, L91
Markevitch M. 1998, ApJ, 504, 27
Mittaz J.P.D., Lieu R., Lockman F.J 1998, ApJ, 498, L17
Moore B., Ghigna S., Governato F., Lake G., Quinn T, Stadel J., Tozzi P. 1999 ApJL 524, L19
Mushotzky R.F., Loewenstein M. 1997, ApJ, 481, L63
Peebles P.J.E. 1993 “Principles of Physical Cosmology” (Princeton Univ. Press: Princeton)
Pfenniger D., Combes F., Martinet L. 1994, A&A, 285, 79
Rafikov R.R., Draine B.T. 2000 ApJ (submitted) astro-ph/0006320
Reichart D.E., Castander F.J., Nichol R.C. 1999, ApJ, 516, 1
Rephaeli Y. 1995, ARAA, 33, 541
Sarazin C.L. 1988 “X-ray emissions from clusters of galaxies” (CUP: Cambridge)
Sarazin C.L., Lieu R. 1998, ApJ, 494, L177
Shull J.M., McKee C.F. 1979, ApJ, 227, 131
Walker M. 1999, MNRAS 308, 551 (W99)
Walker M., Wardle M. 1998, ApJ, 498, L125
Walker M., Wardle M. 1999, PASA, 16 (3), 262
Wardle M., Walker M. 1999, ApJL, 527, L109
Wu X.P., Xue Y.J., Fang L.Z. 1999, ApJ, 524, 22