2Department of Physics and Astronomy, University of Leicester, University Road, Leicester LE1 7RH
3American Association of Variable Star Observers, 25 Birch Street, Cambridge USA, MA 02138-1205
4Astronomical Institute, P.O.Box 80000, NL-3508 TA Utrecht, the Netherlands
The X–ray spectra of VW Hydri during the outburst cycle
Abstract
We report six BeppoSAX X–ray observations of VW Hyi during and after the outburst of Sep 23 1998. The outburst flux is lower than the quiescent flux in the entire observed energy band (0.1–10 keV), in agreement with earlier observations. The X–ray spectra are fitted with two-temperature plasma and cooling flow spectral models. These fits show a clear spectral evolution in X–rays for the first time in VW Hyi: the hard X–ray turn-up after the outburst is reflected in the emission measure and the temperature. Moreover, during outburst the 1.5–10 keV flux decreases significantly. We argue that this is not consistent with the constant flux during a ROSAT outburst observation made eight years earlier. We conclude from this observation that there are significant differences between outburst X–ray lightcurves of VW Hyi.
Key Words.:
accretion, accretion disks – Stars: individual: VW Hyi – Stars: novae, cataclysmic variables1 Introduction
X–rays from dwarf novae arise very near the white dwarf, presumably in a boundary layer between the white dwarf and the accretion disk surrounding it. Information on the properties of the X–ray emitting gas as a function of the mass transfer rate through the accretion disk is provided by observations through the outburst cycle of dwarf novae. It may be hoped that such observations help to elucidate the nature of the X–ray emission in cataclysmic variables, and by extension in accretion disks in general.
VW Hyi is a dwarf nova that has been extensively studied during outbursts and in quiescence, at wavelengths from optical to hard X–rays. It is a dwarf nova of the SU UMa type, i.e. in addition to ordinary dwarf nova outbursts it occasionally shows brighter and longer outbursts, which are called superoutbursts. Ordinary outbursts of VW Hyi occur every 20–30 d and last 3–5 days; superoutbursts occur roughly every 180 d and last 10–14 d (Bateson bateson77 (1977)).
A multi-wavelength campaign combining data obtained with EXOSAT, Voyager, the International Ultraviolet Explorer, and by ground based optical observers covered three ordinary outbursts, one superoutburst, and the three quiescent intervals between these outbursts (Pringle et al. pringle87 (1987), Van Amerongen et al. amerongen87 (1987), Verbunt et al. verbunt87 (1987), Polidan, Holberg polidan87 (1987), van der Woerd & Heise woerd87 (1987)). The EXOSAT data show that the flux in the 0.05–1.8 keV range decreases during the quiescent interval; the flux evolution at lower energies and at higher energies (1–6 keV) are compatible with this, but the count rates provided by EXOSAT are insufficient to show this independently. Folding the EXOSAT data of three outbursts showed that a very soft component appears early in the outbursts and decays faster than the optical flux (Wheatley et al. wheatley96 (1996)).
The ROSAT Position Sensitive Proportional Counter (PSPC) and Wide Field Camera (WFC) covered a dwarf nova outburst of VW Hyi during the ROSAT All Sky Survey (Wheatley et al. wheatley96 (1996)). The PSPC data show that the flux in the 0.1–2.5 keV range is lower during outburst. The ROSAT data showed no significant difference between outburst and quiescent X–ray spectrum. The best spectral constraints are obtained for the quiescent X–ray spectrum by combining ROSAT WFC from the All Sky Survey with data from ROSAT PSPC and GINGA pointings. A single temperature fit is not acceptable, the sum of two optically thin plasma spectra, at temperatures of 6 keV and 0.7 keV is somewhat better. The spectrum of a plasma which cools from 11 keV and has emission measures at lower temperatures proportional to the cooling time, provides an acceptable fit of the spectrum in the 0.05–10 keV energy range (Wheatley et al. wheatley96 (1996)).
In this paper we report on a series of BeppoSAX observations of VW Hyi, which cover an ordinary outburst and a substantial part of the subsequent quiescent interval. The observations and data reduction are described in Sect. 2, the results in Sect. 3 and a discussion and comparison with earlier work is given in Sect. 4.
2 Observations and data reduction
VW Hyi is monitored at optical wavelengths by the American Association of Variable Star Observers (AAVSO). On Sep 23 1998 the optical magnitude of VW Hyi started to decrease. The outburst lasted for 5–6 days and reached a peak magnitude of 9.2. This outburst served as a trigger for a sequence of six observations by BeppoSAX between Sep 24 and Oct 18. As a result we have obtained one X–ray observation during outburst and five observations during quiescence.

Since VW Hyi appears as an on-axis source, the Low Energy Concentrator Spectrometer (LECS, Parmar et al. parmar97 (1997)) source counts are extracted from a circular region with a 35 pixel radius centered at the source. We use the Sep 1997 LECS response matrices centered at the mean raw pixel coordinates (130,124) for the channel-to-energy conversion and to fold the model spectra when fitted to the data. The combined Medium Energy Concentrator Spectrometer (MECS2 and MECS3, Boella et al. boella97 (1997)) source counts are extracted from a circular region with a 4′ (30 pixel) radius. The September 1997 MECS2 and MECS3 response matrices have been used. These matrices are added together. The background has been subtracted using an annular region with inner and outer radii of 35 and 49.5 pixels for the LECS and 30 and 42.5 pixels for the MECS, around the source region.
We ignore the data of the High Pressure Gas Scintillation Proportional Counter (HPGSPC, Manzo et al. manzo97 (1997)) and the Phoswitch Detection System (PDS, Frontera et al. frontera97 (1997)) since their background subtracted spectra have a very low signal to noise ratio.
The LECS and MECS data products are obtained by running the BeppoSAX Data Analysis System pipeline (Fiore et al. fiore99 (1999)). We rebin the energy channels of all four instruments to of the spectral resolution and require a minimum of 20 counts per energy bin to allow the use of the chi-squared statistic. The total LECS and MECS net exposure times are 82.5 ksec. and 181.4 ksec. respectively. The factor 2.2 between the LECS and MECS exposure times is due to non-operability of the LECS on the daytime side of the earth.
3 Results
| Obs. | Obs. date | LECS | MECS | ||
|---|---|---|---|---|---|
| cnt. rate | cnt. rate | ||||
| ksec | cts s-1 | ksec | cts s-1 | ||
| 1 | 24–26/09/1998 | 34.1 | 0.024(3) | 76.6 | 0.016(2) |
| 2 | 27–28/09/1998 | 7.2 | 0.098(8) | 20.2 | 0.109(8) |
| 3 | 3–4/10/1998 | 9.1 | 0.089(8) | 17.4 | 0.094(6) |
| 4 | 10–11/10/1998 | 9.4 | 0.072(7) | 20.0 | 0.075(5) |
| 5 | 12/10/1998 | 11.1 | 0.072(6) | 21.6 | 0.085(5) |
| 6 | 17–18/10/1998 | 11.6 | 0.077(6) | 25.6 | 0.078(5) |
| Total | 82.5 | 181.4 | |||

In Fig. 1 we show the optical lightcurve, provided by the American Association of Variable Star Observers and the Variable Star Network, of VW Hyi at the time of our X–ray observations. These optical observations show that our first BeppoSAX observation was obtained during an ordinary outburst that peaked on Sep 24, whereas observations 2–6 were obtained in quiescence. The last ordinary outbursts preceding our first BeppoSAX observation was observed by the AAVSO to peak on Sep 8; the first outburst observed after our last BeppoSAX observation was a superoutburst that started on Nov 5 and lasted until Nov 19.
3.1 Lightcurve
In Fig. 1 we also show the count rates detected with the BeppoSAX LECS and MECS. For the latter instrument we show the count rates separately for the full energy range 1.5-10 keV, and for the hard energies only in the range 5-10 keV. In both LECS and MECS the count rate is lower during the outburst than in quiescence. In quiescence the count rate decreases significantly between our second and third (only in the MECS data), and between the third and fourth observations (both LECS and MECS data), but is constant after that (see Table 1).
The MECS count rate decreases during our first observation, when VW Hyi was in outburst, as is shown in more detail in Fig. 2. This decrease can be described as exponential decline with d. The count rates in the LECS are compatible with the same decline, but the errors are too large for an independent confirmation. The count rates at lower energies, 0.1–1.5 keV, are compatible with both a constant value and the exponential decay during our first observation.
3.2 Spectral fits
| Two-temperature | ||||||||
| Obs. | T1 | T2 | E.M.1 | E.M.2 | L1 | L2 | (d.o.f.) | |
| keV | keV | |||||||
| 1 | 65 (61) | |||||||
| 2 | 92 (70) | |||||||
| 3 | 103 (75) | |||||||
| 4 | 75 (66) | |||||||
| 5 | 84 (74) | |||||||
| 6 | 78 (77) | |||||||
| 3–6 | 149 (113) | |||||||
| Cooling flow | ||||||||
| Obs. | Normalization | L | (d.o.f.) | |||||
| keV | keV | |||||||
| 1 | 76 (62) | |||||||
| 2 | 92 (71) | |||||||
| 3–6 | 153 (115) | |||||||
∗ Fixed parameter c.f. the value obtained from the combined observations 3–6
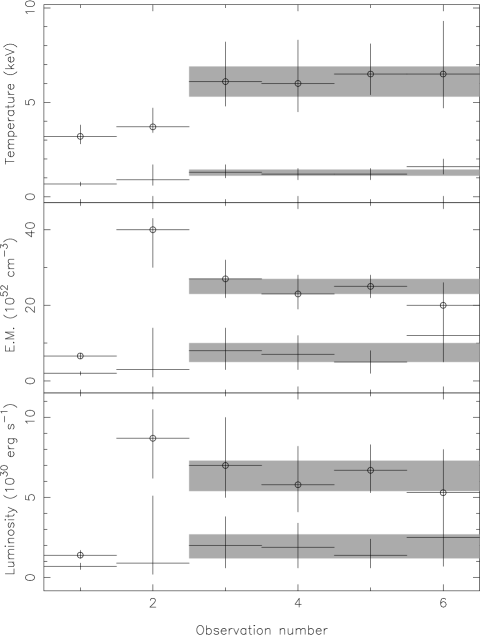
We have made spectral fits to the combined MECS and LECS data for each of the six separate BeppoSAX observations and computed the luminosities assuming a distance of 65 pc to VW Hyi (see Warner warner87 (1987)). As expected on the basis of earlier work, described in the introduction, we find that the observed spectra cannot be fitted with a single-temperature plasma. The combination of spectra of optically thin plasmas at two different temperatures does provide acceptable fits. The parameters of these fits are listed in Table 2, and their variation between the separate observations is illustrated in Fig. 3. The need for a two-temperature fit is illustrated in Figs. 4 and 5 for the outburst spectrum of observation 1 and for the quiescent spectrum of the combined observations 3–6: the low temperature component is required to explain the excess flux near 1 keV. The Fe-K emission line near is clearly present in our data, and is due to hydrogen or helium like iron from the hot component of the plasma. The LECS data in observations 3–6 are poorly fitted above keV which is probably due to calibration uncertainties of the instrument (Fiore et al. fiore99 (1999)). We fix at , the best-fit value of the combined observation 3–6. (Fixing at , which was found by Polidan et al. (polidan90 (1990)), does not change the fit parameters, except for the chi-squared values of observations 2, 3 and 3–6 which become slightly worse; 98, 111 and 158 respectively.)
The temperature of both the cool and the hot component of the two-temperature plasma is higher during quiescence than during the outburst, increasing from respectively 0.7 keV and 3.2 keV in outburst to 1.3 keV and 6 keV in quiescence. The temperatures immediately after outburst – in our second observation – are intermediate between those of outburst and quiescence. The emission measure (i.e. the integral of the square of the electron density over the emission volume, ) of both the cool and the hot component of the two-temperature plasma is also higher in quiescence; immediately after outburst the emission measure of the hot component is higher than during the later phases of quiescence. The temperatures and emission measures of the two-temperature plasma are constant, within the errors, in the later phases of quiescence of our observations 3–6. For that reason, we have also fitted the combined data of these four observations to obtain better constraints on the fit parameters (see Table 2). Note that the decrease of the count rate between observations 3 and 4, mentioned in Sect. 3.1, is significant even though it is not reflected in the emission measures and luminosities of the two components separately. This is due to the combined spectral fitting of the LECS and the MECS, since the decrease in count rate is less significant for the LECS. Moreover, the errors on the count rates are much smaller than those on the emission measures ( respectively).
| Obs. | T2 | E.M.2 | MECS | PSPC |
|---|---|---|---|---|
| keV | cts s-1 | cts s-1 | ||
| 1a | ||||
| 1b |
We fit the first 31 ksec and the next 46 ksec of the outburst spectrum (1a and 1b) separately. Both fits are good with . From the fit results we compute the MECS and ROSAT PSPC count rates. The results are shown in Table 3. We have only indicated the temperature and emission measure of the hot component since the cool component is responsible for the iron line emission outside the MECS bandwidth and does not have a large impact upon the continuum emission. Note from Table 3 that the decay in count rate is entirely due to the decrease of the emission measure.


To compare our observations with the results obtained by Wheatley et al. (wheatley96 (1996)) we consider next the cooling flow model (cf. Mushotzky, Szymkowiak mushotzky88 (1988)) for our observations 1, 2 and 3–6. In this model the emission measure for each temperature is restricted by the demand that it is proportional to the cooling time of the plasma. The results of the fits are shown in Table 2. Note that these results are not better than the two-temperature model fits. Due to the poor statistics of the LECS outburst observation we cannot constrain the lower temperature limit. The MECS is not sensitive to this temperature regime at all. A contour plot of the upper and lower temperature limits for the combined quiescent observations 3–6 is shown in Fig. 6. The boundaries of the low temperature in Fig. 6 are entirely determined by the Fe-L and Fe-M line emission; for a low temperature of keV the contributions to the line flux integrated over all higher temperatures exceeds the observed line flux. For a low temperature of keV there is not sufficient line flux left in the model. The boundaries of the high temperature are determined by the continuum slope; for a high temperature of and keV the model spectrum is too soft and too hard respectively to fit the data.
4 Comparison with previous X–ray observations
4.1 Time variability

We predict the ROSAT count rates of VW Hyi during outburst and quiescence with the observed BeppoSAX flux from the two-temperature fit (see Table 2). Here we do apply (Polidan et al. polidan90 (1990)) since ROSAT is probably more sensitive to than BeppoSAX. The predicted count rates during outburst and quiescence are 0.31 and . The ROSAT observed count rates are 0.4 and respectively (Belloni et al. belloni91 (1991); Wheatley et al. wheatley96 (1996)). Both predictions appear to be different from the observations by a factor .
From Fig. 2, we observe a decrease in MECS count rate by a factor of during outburst. This is inconsistent with the constant 0.4 observed by the ROSAT PSPC during outburst (Wheatley et al. wheatley96 (1996)). Using the LECS data during the outburst in a bandwidth (0.1–1.5 keV) comparable to the ROSAT PSPC we cannot discriminate observationally between a constant flux and the exponential decay observed by the MECS. However, our spectral fits to the data require that the 0.1-2.5 keV flux decreases in tandem with the hard flux. Thus the difference between the ROSAT PSPC and the BeppoSAX MECS lightcurves during outburst may either be due to variations between individual outbursts or to the different spectral bandwidths of the observing instruments. The predicted decay of the count rate significantly exceeds the range allowed by the ROSAT observations of the Nov 1990 outburst.
We interpret the time variability of the count rate shown in Figs. 2 and 3, as a change mainly in the amount of gas in the inner disk that emits keV photons. At the end of the outburst, while the inner disk is still predominantly optically thick, the mass accretion rate onto the white dwarf is decreasing. As a result, the amount of hot optically thin gas drops gradually. This is observed in Fig. 2. The transition to a predominantly optically thin inner disk occurs just before observation 2. As a result the amount of optically thin emitting material in the disk increases strongly. This is shown by the increase of the emission measure of the hot component in Fig. 3, observation 2, which even peaks above the quiescent value. The settling of the accretion rate towards quiescence is shown in Fig. 3, observations 3–6 for both the temperature and the emission measure. In contrast to the emission measure, the temperature of the hot component increases only gradually throughout observations 1–6 as it reflects the slowly decreasing accretion rate rather than the amount of optically thin emitting material in the disk.
4.2 Spectral variability
Both a two-temperature plasma model and a cooling flow model fit the spectrum of our BeppoSAX observations of VW Hyi better than a one-temperature model. The contribution of the cool component lies mainly in the presence of strong Fe-L line emission around 1 keV. The hot component contributes the continuum and the Fe-K line emission at keV. Adding a soft atmospheric component in the form of a eV blackbody model does not improve our fits. This blackbody component, reported by Van der Woerd et al. (woerd86 (1986)) and Van Teeseling et al. (teeseling93 (1993)), is too soft to be detected by BeppoSAX LECS.
Based upon the -values, the BeppoSAX observation of VW Hyi does not discriminate between a continuous temperature distribution (the cooling flow model) and a discrete temperature distribution (the two-component model) of the X–ray emitting region. Wheatley et al. (wheatley96 (1996)) derive a lower and upper temperature of keV respectively for a cooling flow fit to the combined ROSAT PSPC and GINGA LAC data during quiescence. These temperatures are consistent with our cooling flow fits to BeppoSAX data during quiescence; there is a small overlap between the 2 and 3 contours shown in Fig. 6 by Wheatley et al. and the contours of our Fig. 6.
5 Conclusions
BeppoSAX does not discriminate between a continuous (cooling flow) and a discrete temperature distribution. Our observation of a decreasing count rate, followed by a constant count rate during quiescence is in contradiction with the disk instability models. These models predict a slightly increasing mass transfer onto the white dwarf which must show up as an increase in the X–ray flux. Ad hoc modifications to disk instability models, such as interaction of the inner disk with a magnetic field of the white dwarf (Livio, Pringle livio92 (1992)), evaporation of the inner disk (Meyer, Meyer-Hofmeister meyer94 (1994)), or irradiation of the inner disk by the white dwarf (King king97 (1997)), possibly are compatible with the decrease of ultraviolet flux (e.g. Van Amerongen et al. amerongen90 (1990)) and X–ray flux during quiescence.
If we assume a continuous temperature distribution the upper temperature limit of our quiescence spectrum is consistent with the observations by Wheatley et al. (wheatley96 (1996)). The cooling flow model requires an accretion rate of to explain the X–ray luminosity late in quiescence. A similar result is obtained when we convert the luminosity derived from the two-temperature model to an accretion rate. Any outburst model must accommodate this accretion rate.
BeppoSAX MECS observes a significant decrease in the count rate during outburst. Our simulations show a similar decrease for the ROSAT PSPC which would have been significantly detected. The fact that the ROSAT count rate during outburst was constant (Wheatley et al. wheatley96 (1996)) and the results from our cooling flow model fits suggest that the outburst of Sep 24 1998 behaved differently from the outburst of Nov 3 1990.
Acknowledgements.
This work has been supported by funds of the Netherlands Organization for Scientific Research (NWO).References
- (1) Bateson F.M. 1977, N.Z.J.Sci 20, 73
- (2) Belloni T., Verbunt F., Beuermann K. et al., 1991, A&A 246, L44
- (3) Boella G., Chiappetti L., Conti G. et al., 1997, A&AS 122, 327
- (4) Fiore F., Guainazzi M., Grandi P. 1999, Cookbook for BeppoSAX NFI spectral analysis
- (5) Frontera F., Costa E., Dal Fiume D. et al., 1997, A&AS 122, 357
- (6) King A. 1997, MNRAS 288, L16
- (7) Livio M., Pringle J.E. 1992, MNRAS 259, 23P
- (8) Manzo G., Giarrusso S., Santangelo A. et al., 1997, A&AS 122, 341
- (9) Meyer F., Meyer-Hofmeister E. 1994, A&A 288, 175
- (10) Mushotzky R.F., Szymkowiak A.E. 1988, in: Cooling flows in clusters and galaxies, ed: Fabian A.C., Kluwer Dordrecht, the Netherlands, 53
- (11) Parmar A.N., Martin D.D.E., Bavdaz M. et al., 1997, A&AS 122, 309
- (12) Polidan R.S., Holberg J.B. 1987, MNRAS 225, 131
- (13) Polidan R.S., Mauche C.W., Wade R.A. 1990, ApJ 356, 211
- (14) Pringle J.E., Bateson F.M., Hassall B.J.M. et al., 1987, MNRAS 225, 73
- (15) Van Amerongen S., Damen E., Groot M., Kraakman H., Van Paradijs J. 1987, MNRAS 225, 93
- (16) Van Amerongen S., Kuulkers E., van Paradijs J. 1990, MNRAS 242, 522
- (17) Van der Woerd H., Heise J., Bateson F. 1986, A&A 156, 252
- (18) Van der Woerd H., Heise J. 1987, MNRAS 225, 141
- (19) Van Teeseling A., Verbunt F., Heise J. 1993, A&A 270, 159
- (20) Verbunt F., Hassall B.J.M., Pringle J.E., Warner B., Marang F. 1987, MNRAS 225, 113
- (21) Warner B. 1987, MNRAS 227, 23
- (22) Wheatley P.J., Verbunt F., Belloni T. et al., 1996, A&A 307, 137