NICMOS and VLA Observations of the Gravitatonally Lensed
Ultraluminous BAL Quasar APM 08279+5255:
Detection of a Third Image
Abstract
We present a suite of observations of the recently identified ultraluminous BAL quasar APM 08279+5255, taken both in the infra-red with the NICMOS high resolution camera on board the Hubble Space Telescope, and at 3.5cm with the Very Large Array. With an inferred luminosity of , APM 08279+5255 is apparently the most luminous system known. Extant ground-based images show that APM 08279+5255 is not point-like, but is instead separated into two components, indicative of gravitational lensing. The much higher resolution images presented here also reveal two point sources, A and B, of almost equal brightness (), separated by , as well as a third, previously unknown, fainter image, C, seen between the brighter images. While the nature of C is not fully determined, several lines of evidence point to it being a third gravitationally lensed image of the quasar, rather than being the lensing galaxy. Simple models which recover the relative image configuration and brightnesses are presented. While proving to be substantially amplified, APM 08279+5255 possesses an intrinsic bolometric luminosity of and remains amongst the most luminous objects known.
1 Introduction
Discovered serendipitously in a survey of carbon stars within the Galactic halo, the bright z=3.87 broad absorption line quasar APM 08279+5255 was found to be positionally coincident with a source in the IRAS Faint Source Catalog (Irwin et al. (1998)). The bolometric luminosity, inferred from these optical and far-IR fluxes, exceeds , making APM 08279+5255 the most luminous object currently known. Submillimeter photometry is consistent with thermal emission from a massive , warm dust component (Lewis et al. (1998)), with APM 08279+5255 displaying an overall spectral energy distribution which is similar to other ultraluminous systems at high redshift (e.g. H1413+117 Barvainis et al. (1995)). Recent observations with the 30m IRAM telescope have also detected a massive quantity of molecular gas; such an environment is ripe for star formation, and this process may indeed be responsible for a substantial fraction of APM 08279+5255’s phenomenal luminosity (Downes et al. (1998)). From their CO observations, Downes et al. (1998) determined a redshift of 3.911 for APM 08279+5255. This differs by from that determined from the high ionization broad emission lines (Irwin et al. (1998)). Since it is essentially impossible to measure accurately the systemic redshift of a complex BAL QSO like APM 08279+5255 from optical spectra, we have chosen to adopt the value of z=3.911 throughout this work.
Gravitational lensing can distort our view of the distant universe, enhancing the flux of galaxies and AGN, giving them the appearance of extraordinary systems. This has been the case for several ultraluminous systems discovered in recent years [e.g. H1413+117 (Magain et al. (1988); Kneib et al. (1998)), IRAS FSC 10214+4724 (Rowan-Robinson et al. (1991); Broadhurst & Lehár (1995); Eisenhardt et al. (1996)) and the proto-galaxy candidate MS1512-cB58 (Yee et al. (1996); Williams & Lewis (1996); Seitz et al. (1998))]. Given the extreme inferred luminosity of APM 08279+5255, the possibility that gravitational lensing is influencing the observed properties must also be considered.
Analysis of the point spread function (PSF) derived from the first ground-based observations, obtained with the Jacobus Kapteyn Telescope (JKT), revealed that APM 08279+5255 possesses a non-stellar profile. Rather, its profile was found to be better represented by a pair of point-like sources, separated by (Irwin et al. (1998)). This was interpreted as indicative of multiple imaging of APM 08279+5255 by a massive system along the line-of-sight, probably one or both of the strong Mg II absorbers seen at z=1.18 and z=1.81. The two components were found to possess very similar brightnesses, within 10%; with this, the magnification of the optical continuum was estimated to be . Follow-up observations with the adaptive optics bonnette at the Canada-France-Hawaii telescope confirmed the existence of multiple components in APM 08279+5255, with a separation of (Ledoux et al. (1998)). The relative brightness of the two images was found to be , consistent with the JKT observations. The submillimeter-infrared flux, which arises in a larger emission region, is subject to less enhancement [for IRAS FSC 10214+4724 the optical flux is thought to be magnified a factor of times that of the dominant infrared emission (Eisenhardt et al. (1996))].
While the above observations revealed that APM 08279+5255 is a good candidate for gravitational lensing, the scale of the PSF in the images is comparable to the image separation, and no detection of the lensing galaxy was made. The uncertainty of the relative image/lens configuration leads to uncertainty in the lens model and hence the inferred lensing magnification, without which the intrinsic properties of APM 08279+5255 cannot be determined. In an effort to confirm the lensing hypothesis and identify the lensing lensing galaxy, APM 08279+5255 was observed with NICMOS on the Hubble Space Telescope and with the VLA, and the results of these observations are presented here. In Section 2 the details of the observations are presented, while a lens model for APM 08279+5255 is presented in Section 3. The conclusions of this study are presented in Section 4.
2 Observations
2.1 NICMOS
On the 11th of October 1998, we observed APM 08279+5255 with the NICMOS111 Based on observations with the NASA/ESA Hubble Space Telescope, obtained at the Space Telescope Science Institute, which is operated by the Association of Universities for Research in Astronomy, Inc. under NASA contract No. NAS5-26555. infra-red camera on board the Hubble Space Telescope (HST). The highest spatial resolution NICMOS camera NIC1 was used to obtain 12 exposures of 14 sec each in the J-band (F110W), and 12 exposures of 40 sec each in the H-band (F160W). A further 12 exposures of 10 sec each were secured in the K-band (F205W) with the NIC2 camera (as a K-band filter is not available on NIC1). Each set of exposures were taken with 1” offset pointings in a spiral dither pattern. The main difference, for the present purposes, between the NIC1 and NIC2 cameras is the pixel scale: the pixel scale is on NIC1 and on NIC2. The orientation of the instrument was such that the position angle of the CCD y-axis on all exposures with the NIC1 camera was E of N, and all exposures with the NIC2 camera have the CCD y-axis E of N.
The raw frames were pre-reduced with the package CALNICA, using the appropriate calibration files from the STScI archive. This processing includes bias subtraction, flat fielding, dark correction, and a photometric calibration for converting detector counts to physical flux units.
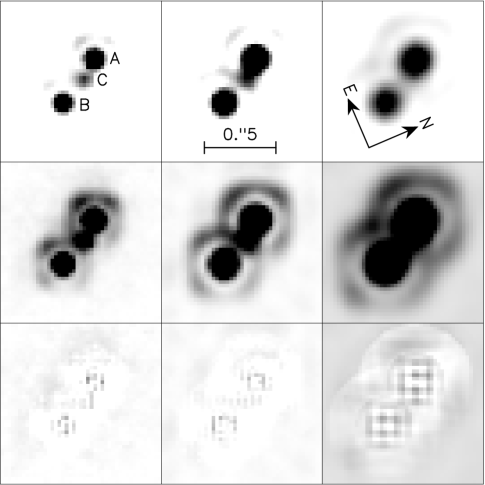
A visual inspection of the preprocessed frames (see the top row of Figure 1) revealed two bright images separated by –, as previously inferred from ground-based images. The brightest image, which we hereafter refer to as component “A”, is located towards the NE; the slightly fainter component “B” is on the SW end of the system. Clearly visible on the preprocessed F110W and F160W frames is a third, previously undetected, image. This component (which we shall label “C”), is substantially fainter than components A and B, and is located between those two bright images.
The gravitational lensing models which are compared to the data in §3 below require an accurate description of the observations in terms of relative fluxes and positions of the components of this system. To this end we have analyzed the data in two alternate ways, measuring magnitudes and positions on individual preprocessed frames, and on a combined image stack in each passband.
Since the three components are at best pixels separated from each other, it is necessary to perform a careful point-spread function fitting analysis, a requirement of which is the determination of a good PSF model for each camera and passband. The NICMOS PSF depends on many factors. The factors that arise from spacecraft settings include: the chosen camera and filter, the focus setting, and the position of the source on the detector. The PSF is wavelength dependent, so the source spectrum also affects its PSF. It was for this last reason that we adopted PSFs simulated with the TINYTIM algorithm (which models the effects of all of the above constraints), instead of picking stars from the STScI archive of NICMOS observations to construct a PSF. We assumed that APM 08279+5255 has a flat spectrum in over the region from , as suggested by the spectral energy distribution displayed in Lewis et al. (1998), their Figure 2. This choice is supported by the photometric results of the present study, listed in Table 1 below.
In the first pass of data-reductions, we constructed a TINYTIM PSF appropriate for the camera, filter, focus position and assumed source spectrum, and used the approximate location of component A in each frame as the PSF position. This PSF was then fit to the data on each data frame using the ALLSTAR PSF fitting program (Stetson 1987) to measure the magnitudes and positions of the three components. These position measurements are accurate to typically better than pixels (judging from the RMS scatter in ). This information enables us to use TINYTIM to construct better PSFs, taking into account the actual sub-pixel location of each component on each frame. Refined magnitudes and positions were subsequently obtained by re-running the ALLSTAR program; the mean and RMS values of these measurements are listed in Table 1.
A combined stacked frame was constructed, using the positions of components A and B on each frame to define the frame registration. The individual preprocessed data frames were resampled onto a finer grid at a scale of , using the STSDAS “DRIZZLE” algorithm, and then medianed to give a combined frame in each of the F110W, F160W and F205W passbands; these high resolution frames are reproduced in Figure 1, and are shown as a color-composite map in Figure 2.
In the middle-row panels of Figure 1 we have chosen image brightness cuts that emphasize a peculiarity of our dataset: the first Airy ring is not uniform, but instead appears brighter on the higher row number side of the object centers. This feature of the PSF is not predicted by the TINYTIM software222The anonymous referee brought to our attention that other NICMOS data (e.g. the F160W NIC2 exposures of RXJ0911.4+0551) also display a non-uniform Airy ring.. Note that it cannot be due to some structure of the source, as it is coincident with the Airy ring in each passband. The deviation away from the model PSF is significant — a normal TINYTIM PSF model that fits the core of component A in the F110W filter underestimates the flux in the first Airy ring by approximately 10% of the total flux (i.e. the first Airy ring is approximately 50% brighter than expected). We implemented a simple fix of this problem by altering the model PSFs: we applied a linear ramp to the first Airy ring, while leaving the central region of the PSFs ( pixels in F110W, pixels in F160W, and pixels in F205W) unaltered. The form of the linear ramp was chosen to be , where is the slope of the ramp, and is the PSF center. As can be seen from the middle-row panels Figure 1, the region above (towards high row number) component A is free of contamination from other components, as is the region below component B; it was to the data in these two regions that we fit the multiplicative slope , which gave in F110W, in F110W, and in F205W.
| quantity | Image | F110W | F160W | F205W |
|---|---|---|---|---|
| Magnitude | A | |||
| B | ||||
| C | ||||
| Color () | A | |||
| B | ||||
| C | ||||
| Flux (mJy) | A | |||
| B | ||||
| C | ||||
| A | ||||
| B | ||||
| C | ||||
| Relative Flux | A | |||
| B | ||||
| C | ||||
| B | ||||
| B | ||||
| B | ||||
| C | ||||
| C | ||||
| C | ||||
| B | ||||
| B | ||||
| C | ||||
| C |
Using these PSF models with an improved estimate of the brightness distribution around the first Airy ring, we obtained ALLSTAR measurements of the magnitudes and positions of the three components A, B and C on the median-combined image stacks in each color. These measurements are listed in Table 1.
We now summarize the observational results.
-
•
The reduced chi-squared value of the PSF fits to the three components in the median-combined stacked frame is , indicating that to good approximation, the three components are point sources. The residuals of these PSF fits are displayed in the bottom-row panels of Figure 1.
-
•
The colors of components A and B are identical to within the uncertainties. If we accept that the measurements from the stacked frames are more reliable than the mean value of the measurements from individual frames, then the colors of component C are also consistent with those of A and B. The simplest hypothesis is therefore that the components A, B and C have identical colors.
-
•
Given that the colors of the components are identical, we can average their relative brightnesses over the three passbands. We find then that the relative brightness of components A and B is (), where the value in brackets is the mean of the measurements on unstacked frames, and the uncertainties are the RMS scatter in the three measurements. The relative brightness of components A and C is , (). Thus, we find good consistency between the measurement methods, which indicates that the relative brightnesses of components A, B and C are well constrained by the data.
-
•
The fluxes of the components in are approximately constant as a function of wavelength (slightly brighter in H).
-
•
Averaging over the position measurements in each passband, the distance from A to B is (), and the distance from A to C is (). The location of component C is not on the straight line connecting A and B. This can be seen by measuring the position of component C in a new coordinate system , where points from A to B, and is orthogonal to (and points in a north-westerly direction). In these coordinates, () and (). While these RMS uncertainties in the positions likely underestimate the true uncertainty, it is clear that to a high confidence level, the three components of APM 08279+5255 are not co-linear.
2.2 VLA
We obtained 3.6 cm radio observations of APM 08279+5255, using the hybrid BnA configuration of the NRAO333The National Radio Astronomy Observatory is a Facility of the National Science Foundation, operated under cooperative agreement by Associated Universities, Inc. Very Large Array (VLA), on 18th June, 1998. We integrated on the target for about 2.5 hours, divided into half-hour scans, interleaved with a nearby phase calibrator (B0820+560). The interferometer data were calibrated and mapped using standard AIPS444 AIPS (Astronomical Image Processing System) is distributed by NRAO. procedures, and the flux densities were calibrated to 3C 147 (Baars et al. 1977). The target proved to be very faint in the radio, and no significant polarized emission was detected. Thus only a single iteration of CLEAN mapping was performed, without self-calibration.
The resulting radio map (see Figure 3) shows a very faint source, with a peak flux density of only 0.26 mJy/beam, where the off-source map RMS was 0.013 mJy/beam, close to the expected thermal noise. The peak of the radio emission is at =08:27:58.00, =+52:55:26.9 (B1950), displaced by from the HST A-image position, probably due to a combination of HST and VLA astrometric errors. The total VLA flux of the source is mJy, integrated over a square aperture. There is also a marginally detected source (peak SNR), roughly to the southwest, with a total flux density of mJy. To best display the radio structure, given the elliptical natural beam, we used a FWHM circular restoring beam.
The radio source is clearly resolved along the A–B image axis. We fitted two Gaussian components to a square region enclosing the radio source, with a relative offset fixed to the HST A–B offset, and widths matched to the convolving beam. The two components had an A/B flux density ratio of 0.6, consistent with the HST image brightness ratio of 0.7, but with a noticeable residual between them. Adding a third component at the C-image offset decreased the fit by , and yielded B/A and C/A flux ratios of 0.9 and 0.5 respectively. However, we could not definitively confirm the C-image: the fit remained less than twice the best value provided that the C image contained less than twice the A image flux density.
3 Gravitational Lensing
3.1 Image Configuration
Using ground-based data, both Irwin et al. (1998) and Ledoux et al. (1998) determined that APM 08279+5255 comprised a pair of point-like images separated by . With the limited information available, namely the image separation and relative brightnesses, both modeled the lensing configuration as a singular isothermal sphere and this suggested that the quasar source in APM 08279+5255 is magnified by a factor of 20–40. Taking this into account, intrinsically APM 08279+5255 still ranks amongst the brightest systems known.
The data presented here greatly enhances our view of APM 08279+5255, clearly resolving the system into a pair of bright point-like images either side of a fainter third image. But before the degree of gravitational lensing in this system can be fully explored, the nature of the third image must be investigated. Two possibilities present themselves; either it is the lensing galaxy which is responsible for splitting the bright image pair, or it represents a true ‘third’ image of the quasar source.
Several lines of argument point towards the latter possibility. First, morphologically image C is point-like and it possesses identical colors to the brighter components. The spectra of APM 08279+5255 with both the 2.5m Isaac Newton Telescope (Irwin et al. (1998)) and the 10m Keck I Telescope (Ellison et al. 1999a ; Ellison et al. (1999)) reveal the presence for two Mg II absorption systems at z=1.18 and z=1.81. If we adopt the lower of these redshifts as the potential redshift of the lensing galaxy, then its distance modulus is (, ). Thus if image C is the lens, its absolute magnitude would be have to be prodigious, (note that the K-correction is approximately zero, as the SED of component C is flat in ). This is inconsistent with the expected Faber-Jackson luminosity of the lens given its small velocity dispersion (Irwin et al. 1998), predicted by a simple isothermal sphere lensing model. Finally, examination of the Keck I HIRES spectra (Ellison et al. 1999a ; Ellison et al. (1999)), which have a resolution of (0.04Å/pixel), reveals a number of absorption systems both along the line-of-sight to the quasar, the Lyα forest, and associated with the quasar source, the broad absorption lines. In large spectral intervals, through regions of significant optical depth, Lyα absorption is saturated, and the spectrum is effectively black with a signal that is consistent with zero. Since flux from the (foreground) lensing galaxy must fill in these troughs, their darkness can be used to place an upper limit to the brightness of the lens. Indeed, between 5500Å to 5900Å, the darkest 200 pixel-wide region is centered at 5769.2Å, and the upper limit to the mean flux in this 200 pixel region is 600 times fainter than the mean flux over the interval 5500Å to 5900Å (we have adopted the Ellison et al. 1999a error spectrum as a reasonable estimate of all sources of noise in the spectrum, including the uncertainty arising from scattered light in the HIRES spectrograph). This implies that the – as yet undetected – lensing galaxy must be at least magnitudes fainter than the quasar, that is, . Thus, the hypothesis that image C is the lensing galaxy leads to an unrealistically red color: . These facts provide compelling evidence that C is a third image of the high redshift quasar source. This, however, can not be conclusively demonstrated without further observations of APM 08279+5255, and in the following sections, which deal with gravitational lens modeling, both the third image and lensing galaxy possibilities as a source for C will be considered.
3.2 Modeling
Given APM 08279+5255’s apparent position as the most luminous object currently known, it is important to determine how much the action of gravitational lensing is enhancing our view of this distant source. The excellent resolution of the NICMOS images reveals a third point-like source between the brighter quasar image, and while available evidence points to this being a third image of the quasar source, the possibility that this emission arises in the lensing galaxy is not ruled out. In terms of modeling the gravitational lensing in APM 08279+5255 both possibilities are considered.
3.2.1 C as a Third Quasar Image
If image C represents a third image of the quasar source, then extant observations have failed to detect the lensing galaxy and hence its characteristics and position relative to the quasar images remains unknown to us. However, due to the fact that the image positions are not co-linear, we know that this lens must possess some degree of asymmetry, either due to some intrinsic ellipticity or shearing from a nearby companion. Similarly, to produce the relatively bright third image, a finite core radius is required (Wallington & Narayan (1993)). We would wish, therefore, to employ a finite core, and an elliptical mass distribution in modeling the gravitational lensing in this system. Any such model, however, requires a minimum of 7 parameters (two source positions, an ellipticity, core radius, mass orientation, slope and normalization), while the data only offer 5 constraints (three relative positions and two relative image brightnesses). To this end, we constructed a simple model with a general search of parameter space.
To reduce parameter space, the mass distribution is taken as being isothermal at large radii, turning over in the inner regions to give a core. Sampling the image characteristics for a range of source positions, ellipticities and core radii, resulted in the model presented in Figure 4. The left-hand panel presents the position of the source relative to the caustic distribution in the source plane. The right-hand panel presents the image plane with the corresponding critical lines. The small circles represent the resultant positions of the images; these are superimposed on the NICMOS image. Both the relative image positions and magnitudes match those outlined in Table 1. The lensing mass is oriented 76o east of north, with a small deviation from circular symmetry . The core radius of the lens is , and assuming that this galaxy is at a redshift of z=1.18, its mass interior to the Einstein ring is . While this recovers the observed image plane characteristics it is, of course, highly degenerate, but it does demonstrate that APM 08279+5255 is consistent with being a gravitational lensed system.
We do note, however, that more complex lens models are possible and APM 08279+5255 may represent lensing by a ‘naked cusp’ (Wallington & Narayan (1993)). Similarly, the location of at least one other lensing system along the line-of-sight to APM 08279+5255 can lead to a more complex caustic network in the source plane. With either of these, the observed image configuration can be reproduced with quite different degrees of magnification. The true nature of the gravitational lensing configuration in this system will remain uncertain until the lensing galaxy has been detected.
3.2.2 C as the Lensing Galaxy
The observed three image configuration is consistent with a fundamental theorem of gravitational lensing which dictates that an odd number of images are always formed by non-singular mass distributions (Burke (1981)). It is, however, at odds with observations of most gravitationally lensed systems, as these are seen to possess an even number of images (c.f. http://cfa-www.harvard.edu/castles/); this seemingly incompatibility between gravitational lens theory and observations is usually solved by invoking a (near-)singular core in the lensing galaxy which can drive the magnification of one of the images to zero (Narasimha Subramanian & Chitre (1986)). The inverse of this suggests that the lensing mass distribution must contain a finite core radius if the image at C is to be appreciably magnified; this is exactly the situation with the previous model (Section 3.2.1).
Unless this is the first true bona-fide three image lensed system, however, we must also consider the case that C represents the lensing galaxy and the ‘true’ third image has been demagnified by an almost singular core. With this, the lensing potential of C was modeled as an elliptical, isothermal potential (c.f. Kochanek, Blandford, Lawrence & Narayan (1989)). The lensing configuration offers 5 constraints: two positions, relative to the lens, for each image, and the relative image brightnesses. The model has 3 free parameters, the ellipticity, orientation and normalization of the mass distribution. Using C as the position of the lens is not used as a constraint, rather it is also considered another pair of free parameters. With 5 free parameters and 5 constraints a search for an exact model fit can be made.
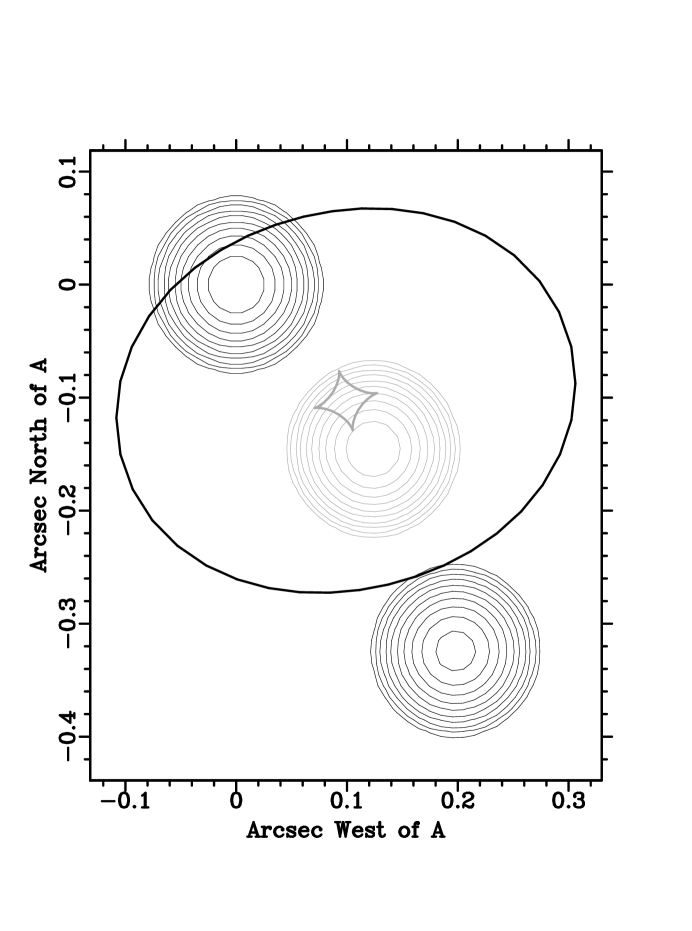
The resulting minimized model lensing configuration for this model is presented in Figure 5; here the grey represents the position of the source relative to the lensing caustics, while the observed images and critical lines are solid. The best position for the lens is West and South of image A, consistent with the position of image C (Table 1). The mass has a 1-D velocity dispersion of 126 and is oriented at 104∘ east of north, an offset of from the model presented in Section 3.2.1, although the ellipticity of the mass profile is substantial, with ; the differences in the models are understandable given the different interpretations of the nature of C. The source has an impact parameter, relative to the lens, of (SSW). Again, the location of the source is similar to that seen in Section 3.2.1. This analysis illustrates, from a gravitational lensing point of view, that C could represent the lensing galaxy.
But what of the nature of C? As discussed previously, if it is the lensing system then its brightness indicates that it is not a ‘normal’ galactic system. One possibility is that C is itself a luminous quasar, explaining both its apparent brightness and point-like appearance. Such quasar-quasar lensing has been addressed (Wampler (1997)), although only high resolution imaging and spectroscopy will uncover C’s true nature.
3.3 The Intrinsic Luminosity of APM 08279+5255
Using the models described above, the degree to which the quasar source is magnified can be determined. Considering the first model of Section 3.2.1, which assumes image C is a third image of the quasar, the total magnification of the quasar source is . Similarly, the model described in Section 3.2.2, in which image C represents the lensing galaxy responsible for splitting the quasar light into the A and B images, the corresponding magnification of the quasar continuum source is . We expect the magnification of the far-IR continuum source to be a factor of 2–3 times lower than the magnification of the quasar continuum source, due to the larger size of the emission region. Taking these into account, the intrinsic luminosity of APM 08279+5255 is and it retains its place amongst the most luminous systems currently known.
4 Conclusions
We have presented new observations of the ultraluminous BAL quasar APM 08279+5255, using both NICMOS on the Hubble Space Telescope and the VLA at 3.5cm. These clearly demonstrate the composite nature of the system, separating APM 08279+5255 into a pair of images, A and B, of comparable brightness. The NICMOS images also reveal the presence of a third point-source, C, between the brighter two. The VLA image shows structure corresponding to the background quasar being a faint radio source and we conclude that intrinsically APM 08279+5255 is a radio quiet quasar with ordinary radio properties. Although the radio source is resolved along A–B, we can not determine from these radio data whether it comprises the A+B images or the A+B+C images.
There are two possible interpretations of the source of C: either this central image is a detection of the foreground lensing galaxy, or it represents a third image of the high redshift quasar. Several arguments indicate that this latter proposition is a more likely description of the available data. A lensing model in which the three observed images are true images of the quasar source was presented. This recovers both the image configuration and and relative brightnesses with a total lensing magnification of .
An alternative model in which image C is the lensing galaxy, was also explored. The position of C was found to be coincident with the position of the lensing galaxy predicted from a simple lensing model, indicating that this scenario may not be implausible. However, to account for its apparent brightness, C must also be an intrinsically luminous source. If this latter model is correct, the simple lensing configuration it offers, with a corresponding time delay of 5 days, provides an ideal example of a “golden lens” (Williams & Schecter 1997) with which can be determined from photometric monitoring.
Considering the magnification of the above models, the intrinsic luminosity of APM 08279+5255 is , placing it amongst the most luminous systems currently known, and its apparent brightness makes it ideal to study aspects of the high redshift Universe (Hines et al. (1999); Ellison et al. (1999); Ellison et al. 1999a ).
Recent near and mid-IR KECK images were brought to our attention just prior to submitting this article (Egami et al. 1999). Taken in excellent seeing, these also clearly reveal the presence of the third image in the same location and with a similar brightness to that found in the the NICMOS images. Given its apparent brightness, they also conclude that this represents a third image of the quasar, rather than the lensing galaxy. They also construct a very similar lensing model to the one presented in this paper, although ours possesses a slightly higher total magnification (90 compared to their 71). Overall, our conclusions are in excellent agreement with theirs.
References
- Barvainis et al. (1995) Barvainis, R., Antonucci, R., Hurt, T., Coleman, P. & Reuter, H.-P., 1995, ApJ 451, 9
- Broadhurst & Lehár (1995) Broadhurst, T. & Lehár, J., 1995, ApJ 450, 41
- Burke (1981) Burke, W.L., 1981, ApJ 244, L1
- Downes et al. (1998) Downes, D., Neri, R., Wikland, T., Wilner, D.J. & Shaver, P., 1998, ApJ 513, L1
- Egami et al. (1999) Egami, E., Neugebauer, G., Soifer, B. T., Matthews, K., Ressler, M. & Becklin, E. E., 1999, ApJ Submitted
- Eisenhardt et al. (1996) Eisenhardt, P. R., Armus, L., Hogg, D. W., Soifer, B. T., Neugebauer, G. & Werner, M. W., 1996, ApJ 461, 72
- (7) Ellison, S. L., Lewis, G. F., Pettini, M., Sargent, W. L. W., Chaffee, F. H., Foltz, C. B., Rauch, M. & Irwin, M. J. 1999a, PASP, In Press
- Ellison et al. (1999) Ellison, S. L., Lewis, G. F., Pettini, M., Chaffee, F. H. & Irwin, M. J. 1999, ApJ, 520, 456
- Hines et al. (1999) Hines, D. C., Schmidt, G. D. & Smith, P. S., 1999, ApJ, 514, L91
- Irwin et al. (1998) Irwin, M. J., Ibata, R. A., Lewis, G. F. & Totten, E. J., 1998, ApJ 505, 529
- Kneib et al. (1998) Kneib, J.-P., Alloin, D., Mellier, Y., Guilloteau, S., Barvanis, R. & Antonucci, R., 1998, A&A 329, 827
- Kochanek, Blandford, Lawrence & Narayan (1989) Kochanek, C. S., Blandford, R. D., Lawrence, C. R. & Narayan, R., 1989,MNRAS, 238, 43
- Ledoux et al. (1998) Ledoux, C., Theodore, B., Petitjean, P., Bremer, M.N., Lewis, G.F., Ibata, R.A., Irwin, M.J. & Totten, E.J., 1998, A&A 339, L77
- Lewis et al. (1998) Lewis, G.F., Chapman, S.C., Ibata, R.A., Irwin, M.J. & Totten, E.J., 1998, ApJ 505, L1
- Magain et al. (1988) Magain, P., Surdej, J., Swings, J.-P., Borgeest, U. & Kayser, R., 1988, Nature 334, 325
- Narasimha Subramanian & Chitre (1986) Narasimha, D., Subramanian, K. & Chitre, S. M., 1986, Nature, 321, 45
- Rowan-Robinson et al. (1991) Rowan-Robinson, M., Broadhurst, T., Oliver, S.J., Taylor, A.N., Lawrence, A., McMahon, R.G., Lonsdale, C.J., Hacking, P.B. & Conrow, T., 1991, Nature 351, 719
- Seitz et al. (1998) Seitz, S., Saglia, R. P., Bender, R., Hopp, U., Belloni, P. & Ziegler, B., 1998, MNRAS 298, 945
- Stetson (1987) Stetson, P. B., 1987, PASP, 99, 191
- Wallington & Narayan (1993) Wallington, S. & Narayan, R., 1993, ApJ 403, 517
- Wampler (1997) Wampler, E. J., 1997, ApJ, 476, L55
- Williams & Lewis (1996) Williams, L. L. R. & Lewis, G. F., 1996, MNRAS 381, L35
- Williams & Schecter (1997) Williams, L. L. R. & Schecter, P. L., 1997, Astronomy & Geophysics, 38, 10
- Yee et al. (1996) Yee, H. K. C., Ellingson, E., Bechtold, J., Carlberg, R. G. & Cuillandre, J.-C., 1996, AJ 111, 1883