A subarcsecond resolution near-infrared study of Seyfert and ‘normal’ galaxies: II. Morphology
Abstract
We present a detailed study of the bar fraction in the CfA sample of Seyfert galaxies, and in a carefully selected control sample of non-active galaxies, to investigate the relation between the presence of bars and of nuclear activity. To avoid the problems related to bar classification in the RC3, e.g., subjectivity, low resolution and contamination by dust, we have developed an objective bar classification method, which we conservatively apply to our new sub-arcsecond resolution near-infrared imaging data set (Peletier et al. 1999). We are able to use stringent criteria based on radial profiles of ellipticity and major axis position angle to determine the presence of a bar and its axial ratio. Concentrating on non-interacting galaxies in our sample for which morphological information can be obtained, we find that Seyfert hosts are barred more often (79%7.5%) than the non-active galaxies in our control sample (59%9%), a result which is at the significance level. The fraction of non-axisymmetric hosts becomes even larger when interacting galaxies are taken into account. We discuss the implications of this result for the fueling of central activity by large-scale bars. This paper improves on previous work by means of imaging at higher spatial resolution and by the use of a set of stringent criteria for bar presence, and confirms that the use of NIR is superior to optical imaging for detection of bars in disk galaxies.
1Department of Physical Sciences, University of Hertfordshire, Hatfield, Herts AL10 9AB, UK, E-mail: knapen@star.herts.ac.uk
2 Department of Physics & Astronomy, University of Kentucky, Lexington, KY 40506-0055, USA, E-mail: shlosman@pa.uky.edu
3Dept. of Physics, University of Durham, South Road, Durham, DH1 3LE, UK
4School of Physics and Astronomy, University of Nottingham, Nottingham, NG7 2RD, UK, E-mail: Reynier.Peletier@Nottingham.ac.uk
Subject headings: Galaxies: Evolution — Galaxies: Nuclei — Galaxies: Seyfert — Galaxies: Spiral — Galaxies: Statistics — Infrared: Galaxies
1. Introduction
The study of fueling processes in active galactic nuclei (AGNs) is an issue important for our understanding of structure and evolution both of central engines in AGNs and of their host galaxies. Although fuel is plentiful in the disk, it needs to overcome the centrifugal barrier to reach the innermost regions in disk and elliptical galaxies. Large-scale non-axisymmetries, such as galactic bars, are thought to be related to starburst activity within the central kpc, which preferentially occurs in barred hosts (e.g., Heckman 1980; Balzano 1983; Devereux 1987; Kennicutt 1994). In a number of early optical surveys, the fueling of Seyfert (Sy) activity in disk galaxies was linked to non-axisymmetric distortions of galactic gravitational potentials by large-scale stellar bars and tidal interactions (Adams 1977; Heckman 1978; Simkin, Su & Schwarz 1980; Dahari 1984). This was supported by a more superficial argument that gravitational torques are able to remove the excess angular momentum from gas, which falls inwards, giving rise to different types of activity at the center (see reviews by Shlosman 1992; Sellwood & Wilkinson 1993; Phinney 1994). However, a criticism was leveled on observational results because the control samples were not matched to the Sy sample in properties like morphological distribution (Balick & Heckman 1982; Fuentes-Williams & Stocke 1988; Shlosman, Begelman & Frank 1990). More recent studies by Moles, Márquez & Pérez (1995) and Ho, Filippenko & Sargent (1997) conclude that the fraction of barred galaxies is equal among AGN hosts and the general population. However, these studies, like the ones in the past, continue to rely on (a) the morphological classification from optical catalogs (e.g., RC3; de Vaucouleurs et al. 1991), or (b) the use of control samples that are not matched to the “active” samples, e.g., the general population of spirals in the RC3.
A combination of dust obscuration, stellar populations and inadequate spatial resolution can hide even a strong bar in the optical (Thronson et al. 1989, Block & Wainscoat 1991; Spillar et al. 1992). High-quality near-infrared (NIR) imaging is much more reliable in determining the overall mass distribution in galaxies. Mulchaey & Regan (1997) much improved the observational basis of this area of study, using NIR imaging of matched Sy and control samples of galaxies. Although their use of NIR imaging results in slightly higher bar fractions than, e.g., Ho et al. (1997), Mulchaey & Regan do not find evidence for a significant excess of bars in Sy galaxies. Recent work by Regan & Mulchaey (1999) involving HST color maps to search for the dust lane signatures of small-scale bars is potentially promising, but employs a very small and statistically insignificant sample. It is also unclear whether nuclear bars have similar properties (e.g., dust lanes) to large-scale stellar bars, and, hence, whether the criterion used is reliable.
The present paper aims to improve on past work through a combination of the following factors:
-
1.
use of NIR observations of a consistently high (sub-arcsecond) spatial resolution
-
2.
use of a carefully selected control sample of non-active galaxies
-
3.
use of objective and stringent criteria for assigning bars, and for determining bar axial ratio
-
4.
publication of our complete set of images and profiles (Peletier et al. 1999, hereafter Paper I), to allow intercomparison with samples of other workers.
This paper is the second in a series analyzing the circumnuclear morphology and colors of a sample of Sy galaxies. Paper I describes the sample, the observations, data reduction and photometric calibration, and an analysis of the circumnuclear regions and host galaxy disks through color index maps. Paper III (Shlosman, Peletier & Knapen 1999) focuses on the distribution of bar axial ratios in Sy and non-active galaxies. In the present paper (Paper II) we compare the morphology of the Sy sample with that of a control sample of non-active galaxies, determining the fraction of non-axisymmetric structures in AGN hosts.
In Sect. 2, we analyze the statistics of bars as determined from the RC3, and use that analysis in Sect. 3 to describe our Sy and control samples. Sect. 4 reviews the images and profiles of sample objects, as published in detail in Paper I, and describes our criteria for recognizing a bar in a given galaxy, and for determining the bar’s ellipticity. We present our results on bar fractions in Sect. 5, and compare them with other published work in Sect. 6. Finally, our results are discussed in terms of scenarios describing fueling of central activity by large-scale stellar bars in Sect. 7.
2. Bar statistics from the RC3
Before studying in detail the occurrence of bars in galaxies as determined from high-resolution NIR images, we consider statistics of bars as obtained from the RC3 catalogue. Although NIR imaging has a better sensitivity to barred potentials, which we exploit in the rest of the paper, use of the RC3 catalogue has the advantage of sample size. Classifications for literally thousands of galaxies can be used to obtain indications on how bar fractions in galaxy populations vary as a function of various parameters.
Fig. 1 shows how many galaxies are classified as ‘barred’ (type X or B) in the RC3 by displaying the fraction of barred galaxies as a function of morphological type (Fig. 1a), of ellipticity (equivalent to inclination,Fig. 1b), and of recessional velocity (or redshift, Fig. 1c). All parameters are directly obtained from the RC3.
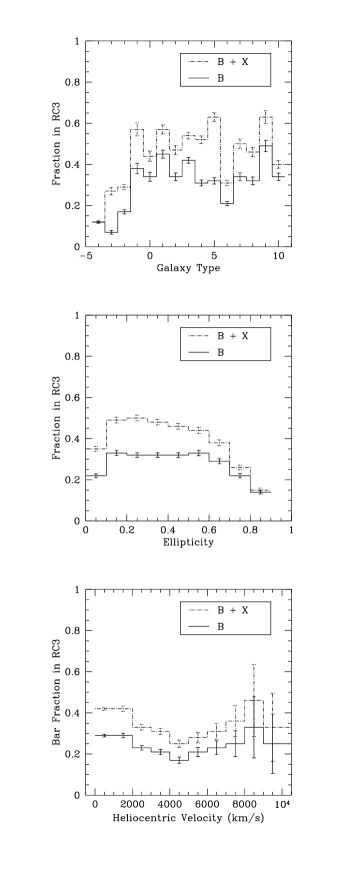
Fig. 1 confirms an overall bar fraction of % (e.g., Sellwood & Wilkinson 1993), but also shows that the bar fraction hardly varies with (1) morphological type for lenticular and spiral galaxies, (2) observed (i.e., not deprojected) ellipticity , within the range of , and even 0.6 for the ‘B’ galaxies, and (3) heliocentric velocity or . Due to the small numbers of galaxies at , the results on the distribution with recessional velocity are not conclusive, but do not show large systematic effects. As expected, the bar fraction is substantially lower for galaxies of extremely early type, and for highly inclined galaxies (), where a bar will be much harder to recognize or classify.
Using the morphological classification of the complete set of galaxies in the RC3, we can determine the RC3 bar fractions in our Sy sample (see Section 3 for a description of the sample selection), and of a synthetic sub-sample of normal galaxies. The latter sub-sample was constructed from the RC3, with a distribution in terms of morphological type, ellipticity, and absolute magnitude similar to that of the Sy sample.
Since we have not encountered significant systematic effects in the RC3 classification within the parameter space under consideration here (see above), we will not at this stage correct the RC3 morphologies for systematic effects. We match the RC3 sub-sample to the Sy sample in the following way. For each CfA Sy galaxy of type ti, ellipticity and absolute magnitude Mi, we select the galaxies in the RC3 with these parameters, and determine the barred fraction (). The fraction of barred and mixed type galaxies for the synthetic RC3 sub-sample thus constructed is given by , where is the number of Sy’s.
Using the criteria outlined in more detail in Sect. 4, we excluded all galaxies for which one can not perform a reliable bar classification. The CfA sample thus reduces from 48 to 29 Sy’s. Of these 29, 8 objects (28 8%) have been classified in the RC3 as type B, and 7 (24 8%) of type X (total B+X 52 9%). For the corresponding synthetic RC3 sub-sample the fraction of B-type galaxies is 40 2%, and of mixed type 22 2% (total BX 62 2%). Although there is no clear correspondence for individual galaxies between the RC3 morphological types and the bar axial ratios (Paper III; also R.J. Buta, private communication), these numbers do indicate a tendency for B-type bars to be underabundant in the Sy sample, a finding which is upheld by studying other samples (Paper III).
We conclude that based solely on the RC3 optical classification, there is a slight, and not necessarily significant, deficiency of barred galaxies among the Sy sample as compared to a synthetic control sub-sample with the same properties. This cannot be caused by any of the selection effects in morphological type, ellipticity, or absolute magnitude, as outlined above, because the two samples were explicitly matched using those criteria.
3. Observations and sample selection
We use the set of NIR imaging observations of the (CfA) sample of Huchra & Burg (1992) for the Sy’s, as described in Paper I. We only summarize the basic details here. We observed the complete CfA sample in the NIR and bands, apart from 3C 273 which was not included because of its high redshift (0.16 vs. 0.07 for the second highest). Observations were made under good seeing conditions (spatial resolution of , best seeing , with median over all images ). The galaxy exposures were interleaved with sky exposures, and standard stars were observed for the photometric calibration.
The data of our sample of 48 Sy galaxies are compared with -band images of the same quality of a control sample of 34 galaxies, selected from the RC3 to mimic the Sy sample in terms of morphological type and ellipticity. Full details of the observations and data reduction can be found in Paper I, where we also publish all the images and derived surface brightness, color, ellipticity and position angle profiles for both Sy and non-Sy samples. We made sure none of our control galaxies is active by cross-checking with different sources of AGN classification. In Fig. 2 we provide the distribution of both samples as a function of morphological type, galaxy ellipticity and redshift. One important difference between the two samples, obvious in these figures, is that a significant fraction of the Sy galaxies does not have a well-defined type in the RC3. For such galaxies, as well as for those at high inclination, or large , determination of the presence and axial ratios of bars will be difficult or impossible, and we thus proceeded by removing those galaxies from our sample.

We exclude from our analysis those galaxies that are
-
•
too small to study their morphology, as determined from their radius (in arcsec) at a surface brightness level of 19 -mag arcsec-1: if , the galaxy is disqualified. Such galaxies have been marked with code 1 in Tables 1 and 2.
-
•
strongly interacting, as evident either by a severely distorted morphology, or by the presence of a companion within 1′ (code 2).
-
•
highly inclined, with (see Fig. 1b) (code 3).
We chose the limits in such a way as to disqualify those galaxies for which the information on the isophote shapes as derived from the imaging would not lead to reliable statements on the presence of a bar. The final statistical results do not critically depend on fine-tuning these numerical limits.
In Fig. 3 we show the distributions for the reduced sample, which we use in the statistical analysis (Sect. 5). Although there are still some minor differences between the reduced Sy and non-Sy samples in terms of morphological type, ellipticity and redshift, such differences are small. In any case, the remaining differences are unlikely to affect our statistical results on bar fractions, because we have shown in Fig. 1 that there are no systematic trends of bar fraction as a function of these parameters, over the range spanned in type, ellipticity and .

4. Bar criteria and determination of axial ratios
Our main criterion for the presence of a bar is a significant rise in the radial ellipticity profile of a galaxy (Paper I), followed by a significant fall, over a range in radius where the position angle of the major axis is roughly constant. The amplitude of the ellipticity variation must be at least 0.1.
We also classify galaxies as barred if their radial major axis position angle profile (Paper I) shows a change of more than 75∘, accompanied by ellipticity values above roughly 0.1. Such NIR isophote twists are characteristic of the inner disk resonance region where nuclear rings are found (Shaw et al. 1993; Knapen et al. 1995; Heller & Shlosman 1996). Furthermore, large isophote twists ( 50o) are very uncommon in elliptical galaxies, and hence it is very unlikely that they are related to the possible triaxiality of the central bulges in disk galaxies (Peletier et al. 1990).
We primarily used our NIR imaging, but since most galaxies are larger than our field of view, we extended the radial range of the ellipticity and position angle profiles by using images from the digitized sky survey (see Paper I). This allows the detection of large-scale bars, for which our NIR data alone would not be sufficient to confirm the decrease in ellipticity beyond the range of the bar.
In a number of cases, we suspect the presence of a bar in a galaxy, but the results obtained from our data do not satisfy our stringent bar criteria. We have thus counted these galaxies as non-barred in our statistics, but data of higher quality may well lead to its re-classification as barred galaxies. This group includes as most prominent members Mrk 461 and UGC 8621 in the Sy sample, and NGC 3455 and NGC 4966 in the control sample.
We determined axial ratios of the bars from the ellipticity profiles using the criterion put forward by Martin (1995), where , thus ‘no bar’ means , and a very ‘strong’ bar . is read off from the profile as the maximum at the bar position, and is subsequently corrected for the inclination of the galaxy. The bar ellipticity is used here in a narrow sense, namely to define the axial ratios. Realistic bars of course can differ substantially from ideal elliptical shapes.
Tables 1 and 2 contain information on the presence of bars in our sample galaxies, and on the maximum axial ratios of those bars. An entry in the “Bar ‘strength’ ” column indicates the presence of a bar, a blank in that column accompanied by a blank in the last column (8, “Code”) means the galaxy is non-barred in our imaging study.
5. Results
5.1. CfA Sy sample
After disqualifying galaxies due to their small angular size, interaction, or high inclination, our Sy sample is reduced from 48 galaxies to 29. Of these 29 galaxies, 20 have a bar as determined from the ellipticity profile, and for all of these we can determine the bar axial ratio. Another 3 galaxies are barred as determined from their position angle twist, but for these the bar axial ratios cannot be determined. We conclude that 23 out of 29 galaxies are barred, or 79%7.5% ( Poisson error).
Mrk 270 has a small bar at , but since this lies at the edge of our resolution limit (about three times the seeing value) we have taken the convincing position angle twist at larger radii as prime evidence for the presence of a bar.
5.2. Control sample
Following the same approach as for the Sy galaxies, we first exclude 5 of our 34 galaxies due to interactions or high inclination. Of the remaining 29, 17 are found to be barred, or 59%9%. We could determine the bar axial ratios for all but two of these galaxies.
6. Comparison with published results
As outlined in the introduction, the methodology used in the present paper is very different from that used in most related published studies, with the exception of Mulchaey & Regan (1997). All other authors used morphological classifications as taken at face value from one of the main galaxy catalogues. Furthermore, in many studies, an active galaxy population is compared with a control population which is not matched in detail.
Ho et al. (1997) use the results from their spectrocopic survey of a large magnitude-limited sample of galaxies to study the relations between bar fraction and nuclear activity. Information on activity in their sample galaxies is obtained from this spectral survey, whereas morphological information on the host galaxy is taken from the RC3. Ho et al. consider an “AGN” subsample, which includes LINER/H ii transition objects, LINERs and Sy’s, and compare its bar fraction with that of the complete sample. They find that the bar fraction in the AGN sample is slightly lower, but not significantly so (574% for the AGN sample vs. 614%).
Mulchaey & Regan (1997) invoked a similar (but not identical in details) approach to the one described by us here, namely analyzing NIR images of matching samples of Sy and non-active galaxies. To determine the presence and axial ratios of the bars, they use in the first instance radial ellipticity and position angle profiles (as published by Mulchaey, Regan & Kundu 1997), but, unlike in the present study, add a few cases where the bar is “visible” on the image, but not in the profiles. Mulchaey & Regan (1997) conclude that the galaxies in both their Sy and control samples are barred in just over 70% of all cases. Based on the size of their samples, the errors in these numbers should be around 8%. Considering these uncertainties, their result is not in contradiction with results of this study.
The main improvement in our work is the use of images at consistently higher resolution than Mulchaey & Regan (median seeing of our data 07 , vs. 10 , with variations between 08 and 18 , for Mulchaey & Regan 1997). Some other differences between the study of Mulchaey & Regan (1997) and ours, that might influence the resulting bar fractions, can be identified. Firstly, Mulchaey & Regan use a subset of the incomplete sample of Maiolino et al. (1995), essentially all known Sy’s in the RSA (Sandage & Tammann 1981). The CfA sample, on the other hand, is considered to be an optically complete set of Sy’s in a region of the sky. Secondly, Mulchaey & Regan match their active and control samples using, among other parameters, the absolute blue magnitude, whereas we chose not to. The advantage of Mulchaey & Regans approach is that the two samples would be better matched in distance, but the uncertainty about the fraction of total blue light attributed to the galaxy by the AGN, and the, potentially related, fact that Sy host galaxies tend to be more luminous than average spirals (Mulchaey & Regan 1997), in our opinion offset this advantage. Thirdly, whereas Mulchaey & Regan, in a few cases, update their bar classification on the basis of a visual inspection, even if the ellipticity and position angle profiles do not convincingly show the presence of a bar, we have stubbornly maintained our stringent criteria for bar presence based upon the behavior of the radial profiles. This may result in a lower bar fraction than that found by Mulchaey & Regan, as is in fact the case in the control sample. Our higher bar fraction in the Sy sample, then, is further proof of the power of a modest increase in spatial resolution in the NIR imaging.
We adjust the classification given by McLeod & Rieke (1995) in two cases: NGC 3982, classified as .SXR3*. (or SAB(r)b) in the RC3 (but not barred according to McLeod & Rieke) does in fact have a bar inside a region of well-defined spiral arms; and Mrk 817 has a nice but angularly small bar.
We have cross-checked our results for the presence of bars in the Sy host galaxies with those presented by Malkan et al. (1998). The following galaxies in our CfA sample were classified as barred by Malkan et al.: Mrk 993 (disqualified by us due to its high inclination), Mrk 766, NGC 5674, Mrk 817, NGC 5940, NGC 6104 (disqualified by us for interaction), UGC 12138, Mrk 533 (disqualified by us for interaction), and NGC 7682. Apart from the three galaxies we disqualified, all these galaxies are confirmed to be barred in our study.
An extensive comparison of bar axial ratios as determined by us and taken from the literature, statistically and in individual cases, is presented in Paper III.
7. Concluding remarks: large-scale stellar bars and fueling of AGNs
Based on our new sub-arcsec resolution NIR imaging survey of the CfA sample of Sy’s and of a control sample of normal galaxies, and excluding objects for which reliable morphological information cannot be obtained, we find that Sy hosts are barred more often than normal galaxies (79%7.5% barred for the Sy’s, vs. 59%9% for the control sample). This result stands at the 2.5 level.
Taking the bar classification from the RC3, we find that Sy’s are barred just as often as normal galaxies, in general agreement with previous work (e.g., Simkin et al. 1980; Moles et al. 1995; Ho et al. 1997), also based upon the RC3. The classification in the RC3 was done by eye on the basis of photographic plates taken in the optical and at relatively poor angular resolution, and although performed by experts, the classification remains difficult to reproducible for individual galaxies. This is illustrated, for example, by Sellwood & Wilkinson (1993), who compare bar fractions based on several catalogues, and by the present work (see Tables 1 and 2).
In contrast, in our new study we observe the morphology of active and non-active galaxies in the NIR, unhampered by dust, and at a much higher resolution than previous work, including the other NIR studies in this field, by McLeod & Rieke (1995) and Mulchaey & Regan (1997). Our result, at a significance level of , suggests that there is an underlying morphological difference between Sy and non-Sy galaxies. Since the large error margins are a direct result of the sample size, it is now imperative to check the validity of our observational conclusion with larger samples.
A few comments follow from the above statistics. Firstly, these results emphasize the prevalence of barred morphologies in disk galaxies in general, and in active galaxies in particular. It is known from extensive theoretical studies that non-axisymmetric potentials induce radial gas flows and elevate dramatically the rate of star formation within the central kpc of barred galaxies. A straightforward extrapolation towards much smaller spatial scales characterizing the non-stellar AGN-type activity is not warranted however. The absence of AGNs in many barred galaxies can be interpreted in terms of additional factors, besides the large-scale stellar bars, which are required to trigger the nuclear nonstellar activity – a point emphasized already by Shlosman, Frank & Begelman (1989). These additional factors should include the availability of fuel, efficiency of star formation and global self-gravitating effects in the circumnuclear gas, underlining the increasingly important role the gas plays in galactic dynamics at progressively smaller radii (Shlosman 1996).
To summarize, our new NIR data set improves on earlier published surveys of the CfA Sy sample in the following aspects: (1) complete coverage of the sample, (2) observations in the NIR , and bands of all objects, (3) improved spatial resolution: for all our images, best seeing , with median over all images , and (4) observations of a matched control sample in the band. In addition, there is no reliance on optically selected galaxy catalogues, and the morphology of both the CfA and the control samples galaxies was critically revised. At the resolution level of RC3 optical catalog, there is an agreement between our results and those of past and recent surveys (e.g., Simkin et al. 1980; Moles et al. 1995; Ho et al. 1997). It is the high NIR resolution used here that led us to our main conclusion.
ACKNOWLEDGEMENTS. We thank Ron Buta, Françoise Combes and Bill Keel for helpful communications. We made use of the NASA/IPAC Extragalactic Database (NED) which is operated by JPL, CalTech, under contract with NASA. IS is supported in part by NASA grants NAGW-3841, WKU-522762-98-06, and HST AR-07982.01-96A.
REFERENCES
Adams, T.F. 1977, ApJS, 33, 19
Balick, B. & Heckman, T.M. 1982, ARAA, 20, 431
Balzano, V.A. 1983, ApJ, 268, 602
Block, D. & Wainscoat, R.J. 1991, Nature, 353, 48
Dahari, O. 1984, Ph.D. Thesis, University of California at Santa Cruz
de Vaucouleurs, G., de Vaucouleurs, A., Corwin, H.G., Buta, R.J., Paturel, G., Fouqué, P. 1991, 3rd Reference Catalogue of Bright Galaxies (RC3), Springer, New York
Devereux, N.A. 1987, ApJ, 323, 91
Fuentes-Williams, T. & Stocke, J.T. 1988, AJ, 96, 1235
Heckman, T. 1978, PASP, 90, 241
Heckman, T. 1980, A&A 88, 365
Heller, C.H. & Shlosman, I. 1996, ApJ, 471, 143
Ho. L.C., Filippenko, A.V. & Sargent, W.L.W. 1997, ApJ, 487, 591
Huchra, J.P., & Burg, R. 1992, ApJ, 393, 90
Kennicutt, R.C. 1994, in “Mass-Transfer Induced Activity in Galaxies,” I. Shlosman, ed. (Cambridge Univ. Press), p. 131
Knapen, J.H., Beckman, J.E., Heller, C.H., Shlosman, I. & de Jong, R.S. 1995, ApJ, 454, 623
Mailino, R., Ruiz, M. & Rieke, G.H. 1995, ApJ 446, 561
Malkan, M.A., Gorjian, V. & Tam, R., 1998, ApJS, 117, 25
Martin, P., 1995, AJ, 109, 2428
McLeod, K.K. & Rieke, G.H. 1995, ApJ, 441, 96
Moles, M., Márquez, I. & Pérez, E. 1995, ApJ, 438, 604
Mulchaey, J. & Regan, M., 1997, ApJ, 482, L135
Mulchaey, J., Regan, M. & Kundu, A., 1997, ApJS, 110, 299
Peletier, R.F., Davies, R.L., Illingworth, G., Davis, L. & Cawson, M. 1990, AJ, 100, 1091
Peletier, R.F., Knapen, J.H., Shlosman, I., Pérez-Ramirez, D., Nadeau, D., Doyon, R., Rodriguez-Espinosa, J.M. & Pérez-García, A.M. 1999, ApJS, in press (Paper I)
Phinney, E.S.P. 1994, in “Mass-Transfer Induced Activity in Galaxies,” I. Shlosman, ed. (Cambridge Univ. Press), p. 1
Regan, M.W. & Mulchaey, J.S. 1999, ApJ, in press
Sandage, A. & Tammann, G. A. 1981, A Revised Shapley-Ames Catalog of Bright Galaxies (Publ. 635; 1st ed.; Washington: Carnegie Institution of Washington)
Sellwood, J.A. & Wilkinson, A. 1993, Rep. Prog. Phys., 56, 173
Shaw, M.A., Combes, F., Axon, D.J. & Wright, G.S. 1993, A&A, 273, 31
Shlosman, I. 1996, in Proc. Nobel Symp. on “Barred Galaxies & Circumnuclear Activity”, A. Sandqvist & P.O. Lindblad, eds. (Springer-Verlag), p. 141
Shlosman, I. 1992, in “Relationships Between Active Galactic Nuclei & Starburst Galaxies,” A.V. Filippenko, ed. (ASP Conf. Series), p. 335
Shlosman, I., Begelman, M.C. & Frank, J. 1990, Nature, 345, 679
Shlosman, I., Frank, J. & Begelman, M.C. 1989, Nature, 338, 45
Shlosman, I., Peletier, R.F. & Knapen, J.H., 1999, in preparation (Paper III)
Simkin, S.M., Su, H.J. & Schwarz, M.P. 1980, ApJ, 237, 404
Spillar, E.J., Oh, S.P., Johnson, P.E. & Wenz, M. 1992, AJ 103, 793
Thronson, H. Jr., Hereld, M., Majewski, S., Greenhouse, M., Johnson, P., Spillar, E., Woodward, C.E., Harper, D.A. & Rauscher, B.J. 1989, ApJ, 343, 158
| Galaxy | vhel | Sy | T | Class. | Bar ‘strength’ | Bar ‘strength’ | Code |
| Projected | Deprojected | ||||||
| Mrk 334 | 6582 | 1.8 | N | .P….. | 2 | ||
| Mrk 335 | 7688 | 1 | N | .P….. | 1 | ||
| UGC 524 | 10763 | 1 | 3.0 | PSBS3.. | 6 | 6 | |
| I Zw 1 | 18330 | 1 | N | .S?…. | 1 | ||
| Mrk 993 | 4658 | 2 | 1.0 | .S..1.. | 3 | ||
| Mrk 573 | 5174 | 2 | -1.0 | RLXT+*. | ND | ND | 4 |
| UGC 1395 | 5208 | 1.9 | 3.0 | .SAT3.. | 6 | 5 | |
| Mrk 590 | 7910 | 1.2 | 1.0 | .SAS1*. | ND | ND | 4 |
| NGC 1068 | 1136 | 2 | 3.0 | RSAT3.. | 5 | 4 | |
| NGC 1144 | 8648 | 2 | N | .RING.B | 2 | ||
| Mrk 1243 | 10602 | 1 | 1.0 | .S..1.. | 1 | ||
| NGC 3227 | 1157 | 1.5 | 1.0 | .SXS1P. | 2,3 | ||
| NGC 3362 | 8318 | 2 | 5.0 | .SX.5.. | 4 | 2 | |
| UGC 6100 | 8778 | 2 | 1.0 | .S..1?. | |||
| NGC 3516 | 2649 | 1.5 | -2.0 | RLBS0*. | 3 | 4 | |
| Mrk 744 | 2674 | 1.8 | 1.0 | .SXT1P. | 2,3 | ||
| NGC 3982 | 1109 | 2 | 3.0 | .SXR3*. | 4 | 3 | |
| NGC 4051 | 725 | 1 | 4.0 | .SXT4.. | 7 | 6 | |
| NGC 4151 | 995 | 1.5 | 2.0 | PSXT2*. | 5 | 3 | |
| NGC 4235 | 2410 | 1 | 1.0 | .SAS1./ | 3 | ||
| Mrk 766 | 3876 | 1.5 | 1.0 | PSBS1*. | 6 | 6 | |
| Mrk 205 | 21239 | 1 | N | .P….. | 1 | ||
| NGC 4388 | 2524 | 2 | 3.0 | .SAS3*/ | 3 | ||
| NGC 4395 | 319 | 1.8 | 9.0 | .SAS9*. | 7 | 7 | |
| Mrk 231 | 12642 | 1 | 5.0 | .SAT5$P | 2 | ||
| NGC 5033 | 875 | 1.9 | 5.0 | .SAS5.. | 3 | ||
| Mrk 789 | 9476 | 1 | N | .P….. | 1,2 | ||
| UGC 8621 | 6023 | 1.8 | N | .S?…. | |||
| NGC 5252 | 6926 | 1.9 | -2.0 | .L….. | 6 | 4 | |
| Mrk 266 | 8353 | 2 | N | .P….. | 2 | ||
| Mrk 270 | 2700 | 2 | -2.0 | .L…?. | ND | ND | 4 |
| NGC 5273 | 1089 | 1.9 | -2.0 | .LAS0.. | |||
| Mrk 461 | 4856 | 2 | N | .S….. | |||
| NGC 5347 | 2335 | 2 | 2.0 | PSBT2.. | 7 | 6 | |
| Mrk 279 | 8814 | 1 | -2.0 | .L….. | 4 | 2 | |
| NGC 5548 | 5149 | 1.5 | 0.0 | PSAS0.. | |||
| NGC 5674 | 7474 | 1.9 | 5.0 | .SX.5.. | 6 | 6 | |
| Mrk 817 | 9430 | 1.5 | N | .S?…. | 5 | 5 | |
| Mrk 686 | 4225 | 2 | 3.0 | .SB.3.. | 5 | 4 | |
| Mrk 841 | 10852 | 1 | N | ……. | 1 | ||
| NGC 5929 | 2492 | 2 | 2.0 | .S..2*P | 2 | ||
| NGC 5940 | 10115 | 1 | 2.0 | .SB.2.. | 5 | 5 | |
| NGC 6104 | 8382 | 1.5 | N | .S?…. | 2 | ||
| UGC 12138 | 7375 | 1.8 | 1.0 | .SB.1.. | 6 | 5 | |
| NGC 7469 | 4892 | 1 | 1.0 | PSXT1.. | 4 | 2 | |
| Mrk 530 | 8851 | 1.5 | 3.0 | .SAT3*P | |||
| Mrk 533 | 8713 | 2 | 4.0 | .SAR4P. | 2 | ||
| NGC 7682 | 5107 | 2 | 2.0 | .SBR2.. | 6 | 6 |
| Galaxy | vhel | T | Class. | Bar ‘strength’ | Bar ‘strength’ | Code |
|---|---|---|---|---|---|---|
| Projected | Deprojected | |||||
| NGC 1093 | 6282 | 2.0 | .SX.2?. | 7 | 6 | |
| UGC 3247 | 3371 | N | .S?…. | 5 | 5 | |
| UGC 3407 | 3604 | 1.0 | .S..1.. | 4 | 4 | |
| UGC 3463 | 2693 | 4.0 | .SXS4.. | |||
| UGC 3536 | 4689 | -3.0 | .L…. | 6 | 2 | |
| UGC 3576 | 5966 | 3.0 | .SBS3.. | 6 | 3 | |
| UGC 3592 | 13160 | 1.0 | RSBS1.. | 7 | 8 | |
| UGC 3789 | 3325 | 2.0 | RSAR2.. | 6 | 6 | |
| UGC 3850 | 4709 | 1.0 | PSXS1.. | 5 | 5 | |
| NGC 2347 | 4421 | 3.0 | PSAR3*. | |||
| NGC 2365 | 2278 | 1.0 | .SX.1.. | |||
| NGC 2431 | 5679 | 1.0 | PSBS1*. | ND | ND | 4 |
| NGC 2460 | 1442 | 1.0 | .SAS1.. | |||
| NGC 2487 | 4841 | 3.0 | .SB.3.. | 6 | 5 | |
| NGC 2599 | 4741 | 1.0 | .SA.1.. | |||
| NGC 2855 | 1910 | 0.0 | RSAT0.. | 3 | 2 | |
| NGC 3066 | 2049 | 4.0 | PSXS4P. | 5 | 5 | |
| NGC 3188 | 7769 | 2.0 | RSBR2.. | 6 | 6 | |
| NGC 3455 | 1102 | 3.0 | PSXT3.. | |||
| NGC 4146 | 6520 | 1.5 | RSXS2.. | 5 | 5 | |
| NGC 4369 | 1045 | 1.0 | RSAT1.. | 7 | 7 | |
| NGC 4956 | 4750 | -2.0 | .L….. | |||
| NGC 4966 | 7036 | N | .S….. | |||
| NGC 5434 | 5638 | 5.0 | .SA.5.. | 2,4 | ||
| NGC 5534 | 2633 | 1.7 | PSXS2P* | 2 | ||
| NGC 5832 | 447 | 3.0 | .SBT3$. | |||
| NGC 5869 | 2087 | -2.0 | .L..0*. | ND | ND | 4 |
| UGC 9965 | 4528 | 5.0 | .SAT5.. | 5 | 4 | |
| NGC 5992 | 9518 | N | .S….. | 2 | ||
| NGC 6085 | 10195 | 1.0 | .S..1.. | |||
| NGC 6278 | 2790 | -2.0 | .L….. | |||
| NGC 6504 | 4788 | N | .S….. | 3 | ||
| NGC 6635 | 5038 | -2.0 | .L…P* | |||
| NGC 6922 | 5665 | 5.3 | .SAT5P* | 2 |