Detection of Exceptional X-Ray Spectral Variability in the TeV BL Lac 1ES 2344+514
Abstract
We present the results of six BeppoSAX observations of 1ES 2344+514, five of which were taken within a week. 1ES 2344+514, one of the few known TeV BL Lac objects, was detected by the BeppoSAX Narrow Field Instruments between 0.1 to keV. During the first five closely spaced observations 1ES 2344+514 showed large amplitude luminosity variability, associated with spectacular spectral changes, particularly when compared to the last observation when the source was found to be several times fainter, with a much steeper X-ray spectrum. The energy dependent shape of the lightcurve and the spectral changes imply a large shift (factor of 30 or more in frequency) of the peak of the synchrotron emission. At maximum flux the peak was located at or above 10 keV, making 1ES 2344+514 the second blazar (after MKN501) with the synchrotron peak in the hard X-ray band. The shift, and the corresponding increase in luminosity, might be due to the onset of a second synchrotron component extending from the soft to the hard X-ray band where most of the power is emitted. Rapid variability on a timescale of approximately 5000 seconds has also been detected when the source was brightest.
keywords:
BL Lacertae objects: individual (1ES 2344+514) - galaxies, Active1 Introduction
BL Lac objects are an extreme and rare type of AGN emitting highly variable non-thermal radiation over a very wide energy range encompassing almost 20 orders of magnitude, from radio to TeV energies. Synchrotron emission followed by Inverse Compton scattering is generally thought to be the mechanism responsible for the production of radiation over such a wide energy range (e.g., Bregman 1994). Relativistic beaming is necessary to explain some of the extreme properties of these objects such as rapid variability, high gamma-ray luminosities and superluminal motion (Urry & Padovani 1995). Over a dozen BL Lacs have now been detected at GeV energies (Mukherjee et al. 1997), but only a few nearby BL Lacs have been so far detected at TeV energies: MKN 421, MKN 501, 1ES 2344+514 (Catanese et al. 1997,1998), and PKS2155-304 (Chadwick et al. 1999).
The unique capabilities of the BeppoSAX satellite (Boella et al. 1997a) to perform broad-band X-ray (0.1-200keV) studies are particularly well suited for the detailed study of the X-ray energy spectrum of 1ES 2344+514 and its evolution in time. In this paper we present 6 BeppoSAX observations of 1ES 2344+514, five of which were carried out over a period of about one week in December 1996 when a sizable flare accompanied by large spectral variations occurred.
2 Observations
The BeppoSAX payload (Boella et al. 1997a) comprises four co-aligned X-ray experiments called NFI (Narrow Field Instruments) and two Wide-Field-Cameras (WFC) each pointing 90 degrees away from the NFI pointing direction. The NFI include four X-ray telescopes with one Low Energy Concentrator Spectrometer (LECS, Parmar et al. 1997) sensitive in the 0.1-10 keV band, and three identical Medium Energy Concentrator Spectrometers (MECS, Boella et al. 1997b) covering the 1.5-10. keV band. At higher energy the NFI also include two collimated experiments (PDS and HPGSPC) extending the BeppoSAX sensitivity range to approximately 200 keV. The PDS instrument (Frontera et al. 1997) is made up of four units, and is normally operated in collimator rocking mode, that is with a pair of units pointings to the source and the other pair pointing at the background, the two pairs switching on and off source every 96 seconds. The net source spectra are obtained by subtracting the ‘off’ from the ‘on’ counts. The HPGSPC (Manzo et al. 1997) instrument is sensitive to the keV energy band and provides better energy resolution than the PDS but at the expense of sensitivity. This instrument is generally used for the study of bright Galactic sources.
A log of the six BeppoSAX NFI observations of 1ES 2344+514 together with the count-rates in the LECS, MECS and PDS instruments is given in Table 1.
| date | LECS | count rate | MECS (three units) | count rate | PDS | count rate |
|---|---|---|---|---|---|---|
| exposure (s) | exposure (s) | exposure (s) | ||||
| 3-DEC-1996 | 4719 | 13109 | 5993 | |||
| 4-DEC-1996 | 5264 | 13300 | 6518 | |||
| 5-DEC-1996 | 3516 | 8040 | 3779 | |||
| 7-DEC-1996 | 5563 | 14069 | 6448 | |||
| 11-DEC-1996 | 2992 | 13062 | 5833 | |||
| 26-JUN-1998 | 13460 | 50558a | 21388 |
a 2 MECS units
3 Data analysis
The analysis of the LECS and MECS data was based on the linearized, cleaned event files obtained from the BeppoSAX Science Data Center (SDC) on-line archive (Giommi & Fiore 1997) and on the XIMAGE package (Giommi et al. 1991) upgraded to support the analysis of BeppoSAX data. The LECS data above 4 keV were not used due to calibration uncertainties in this band that have not been completely solved at this time. LECS data have been then fitted only in the keV range, while MECS data were fitted in the keV range.
Spectra were accumulated for each observation using the SAXSELECT tool, with 8.5 and 4 arcmin extraction radii for the LECS and MECS respectively, which include more than 90% of the flux. The count rates given in Table 1 were obtained using XIMAGE and refer to channels 10 to 950 (0.1-9.5 keV) for the LECS and 36 to 220 (1.8-10.5 keV) for the MECS. The PDS spectra were taken from the BeppoSAX on-line archive which is based on the results of the Supervised Standard Analysis, a standard procedure routinely run at the SDC on every BeppoSAX observation. The very stable PDS background (due to the very low inclination orbit) and the background subtraction technique used ensure that the systematic uncertainties in the net count-rate are well below both statistical errors and the confusion limit (Guainazzi & Matteuzzi, 1997).
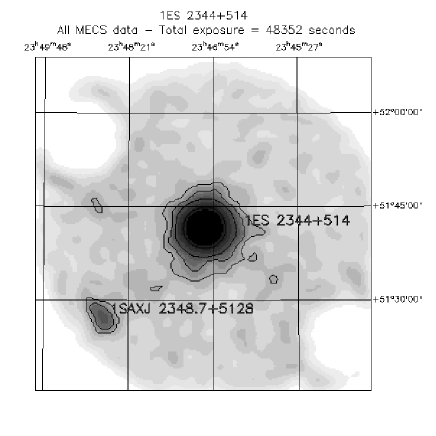
The BeppoSAX X-Ray images were checked for the presence of serendipitous sources which could affect the data analysis in the PDS. Only one weak serendipitous source (1SAXJ2348.7+5127) is present near the edge of the MECS field of view (see figure 1). No significant excess is instead present in the (smaller) field of view of the LECS instrument. 1SAXJ2348.7+5127 was detected in all six MECS observations at a nearly constant flux of approximately erg cm-2 s. This count-rate takes into account telescope vignetting and PSF corrections and is over a factor 10 fainter than that of 1ES 2344+514 in its lowest state.
1SAXJ2348.7+5127 spatially coincides with the dwarf nova V630 CAS at a distance of about 20 arcminutes from the target of the observation. Given its low flux, flat light-curve and off-axis position, we can safely assume that 1SAXJ2348.7+5127 does not contribute in any significant way to the PDS flux of 1ES 2344+514.
4 X-Ray Luminosity and spectral variability
4.1 December 1996 observations
Figure 2 shows the LECS-MECS lightcurve of 1ES 2344+514 in three energy bands: 0.1-2 keV, 2-5 keV, and 5-10 keV during the five December 1996 observations. 1ES 2344+514 doubled its X-ray luminosity in a few days at all energies but followed different evolutions in different energy bands. A visual inspection of Figure 2 shows that the source brightening seems to start one day earlier (on December 4) in the hardest band where it also seems to last longer. Interestingly, the 0.1-2.0 keV lightcurve appears to peak on December 5, two days earlier than the harder bands. The source was clearly detected in the PDS instrument only on December 4 and December 7, when the target was bright. A somewhat weaker detection is also present in the PDS data of December 5 when the exposure time was shortened to only 3779 seconds due to a satellite problem.
Luminosity variability on short timescales was searched for in all six observations. A single significant event was found during the observation of December 7 when the source was in its brightest state. Figure 3 plots the MECS lightcurve during that observation where a flux increase of the order of 40% on a timescale of seconds is clearly visible.
4.2 June 1998 observations
1ES 2344+514 was re-observed by BeppoSAX in June 1998 for approximately 50,000 seconds (Table 1). At the time of this observation only two MECS units were operational and therefore the count-rates reported in Table 1 refer to this reduced MECS configuration. The source was found to be significantly fainter than in December 1996 and showed no rapid variability. Despite the lower flux a significant PDS detection was achieved in the low energy channels (up to keV) thanks to the much longer exposure compared to the 1996 observations.
4.3 X-ray spectra


To quantify the evolution of the spectrum of 1ES 2344+514 we fitted each day’s dataset individually in XSPEC (v. 9.00). The LECS and MECS background is low, although not uniformly distributed across the detectors, and rather stable. For this reason, and in particular for the spectral analysis, it is better to evaluate the background from blank fields, rather than in annuli around the source. Background files accumulated from blank fields, obtained from the SDC public ftp site, were then used. Due to some residual uncertainties in the relative calibration of the imaging instruments, we allowed the LECS/MECS normalization to vary freely. This procedure produced values of , consistent with the expected value (see the BeppoSAX cookbook for details).
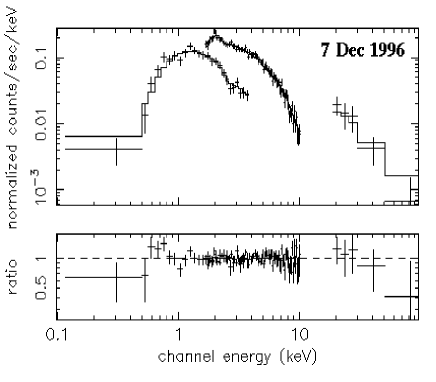
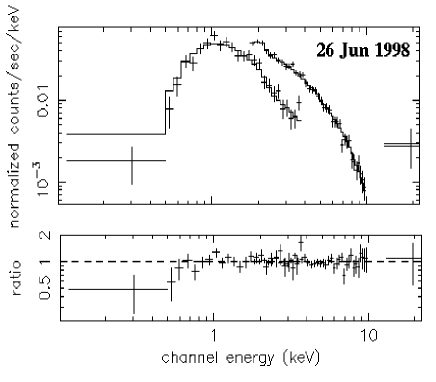
At first, we fitted the LECS and MECS data with a single power-law model modified at low energies by absorption due to neutral gas in the Galaxy. The absorbing column was parameterized in terms of NH, the HI column density, with heavier elements fixed at solar abundances. Cross sections were taken from Morrison and McCammon (1983). For one set of fits, Nwas fixed at the Galactic value of cm-2 derived from the data of Dickey & Lockman (1990). The data and the best fit for the December 7 1996 and the June 1998 observations are shown in figure 4 and 5. In another set of fits, we allowed Nto vary to check for internal absorption and/or indications of a “soft excess.” The results of the fits are presented in Table 2, which gives the observing date in column (1), the unabsorbed keV flux in column (2), the energy index and the reduced chi-squared and number of degrees of freedom d.o.f. for the LECS plus MECS fits in columns (3)-(4), and the same parameters including the PDS data for the two observations with PDS detections. The errors quoted on the fit parameters are the 90% uncertainties for one interesting parameter.
The main results of Table 2 are the following:
-
1.
A single power-law model with Galactic absorption is a good representation of most data, apart from the December 4 (). In the this case a free-Nfit improves significantly the fit ( according to the -test), resulting in a factor of 2 excess absorption above the Galactic value. Of course this could also mean that the spectrum exhibits a flattening at low energies (see below); however, we stress that no evidence of a soft excess was detected.
-
2.
The source is clearly variable.
-
3.
The fitted energy indices also show variability: the weighted mean is but the six observations are clearly inconsistent with a constant value (at the level). Note that the hardest spectrum corresponds to the brightest state of the source, although there is not a clear correlation between flux and spectral index. This is most likely due to the fact that the flux change between the lowest state and the second highest one is relatively small ().
-
4.
The addition of the PDS does not change significantly the best fit parameters. This is likely because most of the weight in the fit is carried by the LECS and MECS instruments.
| date | Flux (2-10 keV) | Spectral slopea | /d.o.f. | Spectral slopea,b | /d.o.f. |
|---|---|---|---|---|---|
| erg cm-2 s | (energy index) | (energy index) | |||
| 3-DEC-1996 | 1.13/57 | … | … | ||
| 4-DEC-1996 | 1.59/68 | 1.53/83 | |||
| 5-DEC-1996 | 1.23/69 | 1.22/81 | |||
| 7-DEC-1996 | 0.85/75 | 0.83/90 | |||
| 11-DEC-1996 | 1.00/68 | … | … | ||
| 26-JUN-1998 | 0.83/68 | 0.83/71 |
a fixed to the Galactic value of cm-2
b PDS included
As some of the single power-law fits were not acceptable, we also tried to fit a broken power-law model to our LECS and MECS data (the best-fit parameters are unchanged if one includes the PDS). Our results are reported in Table 3, which gives the observing date in column (1), the soft and hard energy indices, and , in columns (2)-(3), the break energy in keV in column (4), the reduced chi-squared and number of degrees of freedom d.o.f. in column (5). Column (6) gives the -test probability that the addition of two free parameters results in a significant improvement in the values. Note that the errors quoted on the fit parameters are the 68% uncertainties for three interesting parameters. As can be seen, all the fits are now satisfactory. Interestingly, an improvement in the fit was obtained for all observations (not just the two where the single power-law fit was not acceptable!) and this was highly significant ( level) for all observations. Moreover, with a broken power-law model there is no need for absorption above the Galactic value for any of the data.
| date | /d.o.f. | P-test) | |||
|---|---|---|---|---|---|
| keV | |||||
| 3-DEC-1996 | 1.01/55 | 99.9% | |||
| 4-DEC-1996 | 1.17/66 | ||||
| 5-DEC-1996 | 1.00/67 | % | |||
| 7-DEC-1996 | 0.81/73 | 99.6% | |||
| 11-DEC-1996 | 0.85/66 | ||||
| 26-JUN-1998 | 0.66/65 |
fixed to the Galactic value of cm-2
In all but two observations (that of December 4 and 5), the overall X-ray spectrum is convex, that is the spectrum steepens at higher energies, and the break energy ranges between 1 and 7 keV, with relatively large errors. The Dec. 4 and 5 fits, which have both large errors on , can be explained by the poor signal below keV, the relatively short LECS exposure (for the Dec. 5 data), and more generally by the inadequacy of even a broken power-law model to fit the data. For example, we fitted the Dec. 4 observations excluding the data at keV. The resulting fit, with keV and is indeed suggestive, again within the rather large errors, of a flatter component emerging at high energies. The same spectral analysis has been carried out on the 1998 data and the results are reported in Table 2 and 3. During this last observation 1ES2344+514 was significantly fainter and steeper than in 1996. Again significant improvement in the fit is obtained going from a single power law to a (convex) broken power law model, with spectral flattening at energies lower than 1 keV.
We have combined the LECS, MECS and PDS data to produce spectral energy distributions () for all six observations (Figure 6). As can be seen, we observed spectacular spectral variability in the highest energy bins. Particularly on December 4 and 7, the progression of the hard () component from dominating only above 10 keV (in the December 4 observation) until it becomes dominant in the full 1-10 keV band (in the December 7 observation) can easily be seen. Also apparent in this figure is the inhomogeneity in the flare. While the hard bands ( keV) exhibit a gradual brightening during December 4-7, the soft bands peak more suddenly, and considerable brightening is only seen in the December 5 and 7 data (see figure 2). The amplitude of the variability we observed is clearly largest above 5-10 keV, where it amounts to at least a factor 3-4.
5 Discussion
During the five 1996 BeppoSAX observations 1ES 2344+514 varied by about a factor 2 in the 0.1-10 keV band and by a larger factor in the PDS band. Relative to the 1998 observation the flux change was even larger, reaching a factor at 10 keV (see Figure 6).
Our spectral analysis (Tables 2 and 3) reveals that the overall X-ray spectral shape of 1ES 2344+514 varied with intensity in a way that is typical of BL Lacs with the peak of their emission in the ultraviolet/X-ray band (HBL; Padovani & Giommi 1996), namely the spectrum hardens when the source brightens (e.g. Giommi et al. 1990, Sambruna et al. 1994). Moreover the comparison between the 1996 and 1998 data implies that a large shift (factor ) in synchrotron peak frequencies occurred, similarly to the case of MKN 501 (Pian et al. 1998).
As shown by Figure 6, the progression of the December 1996 flare seems to be dominated by the onset of a variable hard component with peak emission at very high energy (above 10 keV) on December 4. By December 7, this hard component dominates the entire X-ray band. From figure 6 we see that the peak of the synchrotron emission (that is where the spectrum is flat in space) during the lowest 1996 state was at frequencies of a few times Hz while when the intensity was maximum the peak shifted to Hz. This peak frequency at maximum intensity was a factor 30 or higher than at the time of the 1998 observation when the source was seen at its faintest. Such a large shift has only been observed once before in MKN501 (Pian et al. 1998) despite the many multi-wavelength campaigns that led to the detection of several large X-ray variability events (e.g. MKN 421, Takahashi et al. 1996, 1999, Malizia et al. 1999, PKS2005-489, Perlman et al. 1999a, S50716+714 Giommi et al. 1999, PKS2155-304, Chiappetti et al. 1999). A shift of this magnitude implies a significant increase in the maximum electron energy or a change in the magnetic field which could be caused by a compression of the jet magnetic field at a shock. Evidence for such compression has been seen in recent HST polarimetric observations of the M87 jet (Perlman et al. 1999b). Kirk, Rieger & Mastichiadis (1998) postulate a mechanism for explaining the spectral variability in synchrotron sources whereby a hardening with intensity is to be expected at energies below the synchrotron peak. Kirk et al. (1998) also predict a softening at the location of the peak if the magnetic field remains constant. This is contrary to what is observed here, as well as in Pian et al. (1998). A model that includes a change in magnetic field combined with the fresh injection of electrons (as postulated by Kirk et al. 1998) is probably necessary to explain both the 1ES2344+514 and MKN 501 flares (Pian et al. 1998).
We think that the second component cannot be due to a variable Inverse Compton emission since the ratio of 1ES 2344+514 during the high state is . This value is typical of BL Lacs with synchrotron peak in the X-ray band (i.e. 1ES 2344+514 is an extreme HBL) and at least two orders of magnitudes higher than values typical of LBL BL Lacs (with peak emission in the infrared/optical band) where the X-rays are thought to be dominated by inverse Compton radiation (Padovani & Giommi 1995, 1996).
The interpretation involving two synchrotron components also explains in a simple way most of the differences in the 1996 light-curves in the soft (0.1-2.0 keV), medium (3.-5. keV) and hard (5.-10. keV) energy bands. The flare starts in the 5-10 keV band because as soon as the second component emerges its high energy part easily dominates the flux above 5 keV where the steep continuum of the first component quickly drops. At lower energies the flux is dominated by the first (possibly steady) component until the normalization of the second component is comparable or larger than that of the first one. Physically this can be explained in the context of reacceleration of synchrotron emitting electrons in the jet. The part of the continuum which would respond most sensitively to such acceleration would be the portion just beyond the peak (in ). Inspection of Figure 6 shows that it is in exactly this region of the spectrum where the most drastic changes are seen.
This simple explanation cannot, however, account for the fact that the flux in the softest band peaks on December 5, two days before the peak in the harder band. As shown in Figure 2, the increase in this band is also far more sudden. This indicates that a more complex explanation for the flare may be required; however, it may also be that the true peak of the SED prior to the flare was somewhat below 1 keV, or that the peak is quite broad. If indeed the physical explanation of the flare involves reacceleration of jet electrons by e.g. a shock, one would expect that the reacceleration would be gradual and one might see a quick response at energies near the high end of a broad peak as well as just above the peak. Unfortunately due to the high it is not possible to discern with these data whether the quiescent peak of the SED is at energies keV. Analysis of the multiwavelength data gathered during this campaign may enable us to resolve these questions (Perlman et al. , in preparation).
BeppoSAX observations of Mkn 501 during May-June 1997 revealed a flare which appears similar in nature to the one described here, but was even more spectacular in amplitude (Pian et al. 1998). Large shifts of the synchrotron peak energy (implying very large changes in the bolometric luminosity) might therefore be relatively frequent in the hard X-ray band for HBL BL Lacs. Similar behavior should be expected in LBL or intermediate BL Lacs in the optical/UV band. One such event has indeed been observed in ON 231 in spring 1998 (Massaro et al. 1999). Simultaneous multi-wavelength observations in the optical and UV band might reveal large changes in the synchrotron activity in LBL similar to those found in MKN501 and 1ES 2344+514. Along these lines, however, it is important to note the fact that the variability of LBLs in the optical is much larger in amplitude than that of HBLs (Jannuzi et al. 1994), since one would naturally expect the largest amplitude variability very near the peak of the synchrotron component (Padovani & Giommi 1996).
The rapid X-ray variability of 1ES 2344+514 (Figure 3) is similar to an event observed in a long BeppoSAX observation of PKS2155-304 where rise time was approximately equal to decay time (Giommi et al. 1998). This event has been interpreted as evidence for observed variability driven by the size of the emitting region, which would be of the order of a few thousands light seconds, rather than to an intrinsically symmetrical physical process. Under this hypothesis, and assuming SSC as the emission mechanism, it is possible to derive the maximum energy of the photons produced in the Inverse Compton component (, Giommi et al. 1998). Since the peak of the synchrotron emission () in 1ES 23444+514 is in the medium-hard X-rays compared to a synchrotron peak in the optical/UV band for PKS2155-304 and the time variability scale () is similar in the two objects, for 1ES 2344+514 is about a factor of 20 higher than that of PKS2155-304 and well within the TeV range. Emission at TeV energies in 1ES 2344+514 is therefore fully consistent with the SSC mechanism (see Pian et al. 1998 for details of a SSC model predicting emission at TeV energies applied to MKN 501; we will explore the SSC model in more depth in Perlman et al. (in preparation) in the context of the multiwavelength variability of 1ES2344+514 during the flare). The fact that simultaneous Whipple observations did not result in a positive detection of 1ES 2344+514 during the BeppoSAX monitoring could simply be due to a still too low luminosity level during these observations. The firm detection by Whipple in 1995 (Catanese et al. 1998) would then suggest that the X-ray flux of 1ES 2344+514 can reach even higher intensity levels than during the 1996 BeppoSAX observations, probably combined with a large shift of the position of the synchrotron peak.
As in the case of MKN501 (Pian et al. 1998) and 1ES1426+428 (Ghisellini et al. 1999) the results reported here demonstrate that most of the power emitted by HBL BL Lacs may be in the hard X-Rays ( keV) an energy band poorly explored by previous satellites. The detection of large and energy-dependent luminosity variations contribute to make the hard X-rays a promising new window for the study of the physics of BL Lacs and of Blazars in general.
Acknowledgments
We wish to thank Fabrizio Fiore for useful discussions and for providing the software to combine deabsorbed LECS, MECS and PDS data into a representation.
References
- [1] Boella G. et al. 1997a A&AS, 122, 299
- [2] Boella G. et al. 1997b A&AS, 122, 327
- [3] Bregman J. 1994, in Multi-Wavelength Continuum Emission of AGN, T.J.L. Courvoisier and A. Blecha eds., IAU Symp no. 159, p. 5
- [4] Catanese, M. et al. 1997, preprint (astro-ph/9706136)
- [5] Catanese, M. et al. 1998, ApJ, 501, 616
- [6] Chadwick, P.M. et al. 1999, ApJ, in press (astro-ph/9810209)
- [7] Chiappetti et al. 1999, ApJ, in press (astro-ph/9903321)
- [8] Dickey, J.M. & Lockman, F. J. 1990, ARAA, 28, 215
- [9] Frontera F. et al. 1997 A&AS, 122, 357
- [10] Ghisellini G., Tagliaferri G., & Giommi P., 1999, IAUC 7116
- [11] Giommi, P., Angelini, L., Jacobs, P. & . Tagliaferri G. 1991 in ”Astronomical Data Analysis Software and Systems I”, D.M.Worrall, C. Biemesderfer and J. Barnes eds, 1991, A.S.P. Conf. Ser. 25, 100
- [12] Giommi P., Barr P., Garilli B., Maccagni D., Pollock A. 1990, ApJ,356, 455
- [13] Giommi P., Ansari, S.G., & Micol, A. 1995, A&AS 109, 267
- [14] Giommi P.,& Fiore F. 1997, Proc. of ”5th International Workshop on Data Analysis in Astronomy, Erice.
- [15] Giommi, P., et al. 1998, A&A, 333 L 5
- [16] Giommi, P., et al. 1999, A&A, submitted
- [17] Guainazzi, M., & Matteuzzi A., 1997, BeppoSAX SDC Technical Report, TR-011
- [18] Jannuzi B. T., Smith P. S., & Elston, R. 1994, ApJ, 428, 130
- [19] Kirk J.G., Rieger F.M., & Mastichiadis A., 1998 A&A, 333,452
- [20] Malizia A., et al. , 1999 MNRAS, submitted
- [21] Manzo G. et al. 1997 A&AS, 122, 341
- [22] Massaro E., et al. 1999 A&A 342, L49
- [23] Morrison R. & McCammon, D., 1983, APJ, 270, 119
- [24] Mukherjee R. et al. 1997, ApJ, 490, 116
- [25] Padovani P., Giommi, P. 1995 ApJ, 444, 567
- [26] Padovani P., Giommi, P. 1996, MNRAS, 279, 526
- [27] Parmar A. et al. 1997 A&AS, 122, 309
- [28] Perlman, E.S, Madejski G., Stocke J.T., & Rector T., 1999a ApJL, in press (astro-ph/9906351)
- [29] Perlman, E.S, Biretta, J.A, Zhou, F., Sparks, W.B., and Macchetto, F.D., 1999b, AJ, 117,2185
- [30] Pian E. et al. 1998, ApJ, 492, L17,
- [31] Sambruna R., Barr P., Giommi P., Maraschi L., Tagliaferri G., Treves A., 1994, ApJS, 95, 371
- [32] Takahashi et al. 1996, APJ 470, L89
- [33] Takahashi, T., Madejski, G., & Kubo, 1999, VERITAS Conference, in press (astro-ph/9903099)
- [34] Urry, C.M. & Padovani, P. 1995, PASP, 107, 803