Two new quasars at = 1.90 and = 0.15 from the Calán–Tololo Survey ††thanks: Based on observations collected at the European Southern Observatory, La Silla, Chile
Abstract
We present the discovery of two new quasars, that initially appeared as candidate cataclysmic variables (CVs) in a list of the Calán–Tololo objective prism survey. However, additional spectroscopic and photometric observations revealed their true nature. Furthermore we present data for a third quasar, CTCV J0322–4653, which has also been found in our study, but which has already been included in the list of Maza et al. (Ma96 (1996)) as CTS 0639. Here we present the spectra for the first time.
Key Words.:
galaxies: active – (Galaxies): quasars: general – (Galaxies): quasars: emission lines – (Galaxies): quasars: individual: CTS 06391 Introduction
Although large surveys aiming at the detection of bright QSOs have been undertaken such as the photographic Palomar-Green survey (Green et al. Gr86 (1986)), which was carried out in the early seventies, and the more recent Hamburg/ESO survey (e.g., Wisotzki et al. Wi (1996)) and the Calán–Tololo survey (e.g., Maza et al. Ma96 (1996)), serendipitous discoveries are being reported from time to time. The recent discovery of a bright and nearby QSO less than away from 3C273, one of the best studied quasars (Read et al. ReMi (1998)) is such a case.
Here we present the spectra of three new quasars from the Calán–Tololo Survey. Somewhat ironically, these objects were initially selected as candidate cataclysmic variables on the basis of their visual appearance on the objective prism plates (Augusteijn et al. Au99 (1999)). Their blue fluxes and a strong emission line near the H rest wavelength led to such misidentifications. The follow–up observations, however, revealed their true nature.
2 Observations and Data Reduction
The spectroscopic and photometric observations have been carried out with various telescopes at ESO, La Silla, Chile (see Tab. 1). The data reduction was performed in the usual manner including bias level subtraction and flatfielding using the various IRAF packages.
| Object designation | Date | Telescope | Instrument | [Å] | [Å] | [sec] |
|---|---|---|---|---|---|---|
| CTCV J0322–4653 | 31/07/96 | ESO/MPI 2.2m | EFOSC2 | 3250–10250 | 30 | 1800 |
| 02/10/96 | Dutch 0.9m | Direct | B Bessel | – | 2200 | |
| Dutch 0.9m | V Bessel | – | 11390 | |||
| Dutch 0.9m | R Bessel | – | 290 | |||
| CTCV J1322–2101 | 12/04/96 | Danish 1.5m | DFOSC | 5250–9250 | 13 | 600 |
| 25/04/98 | ESO/MPI 2.2m | IRAC2b | – | 600 | ||
| CTCV J1329–1920 | 03/08/96 | ESO/MPI 2.2m | EFOSC2 | 3500–10000 | 30 | 3600 |
3 Results
| Object name | R.A. (J2000) | Dec. (J2000) | Magnitude | Method | |||
|---|---|---|---|---|---|---|---|
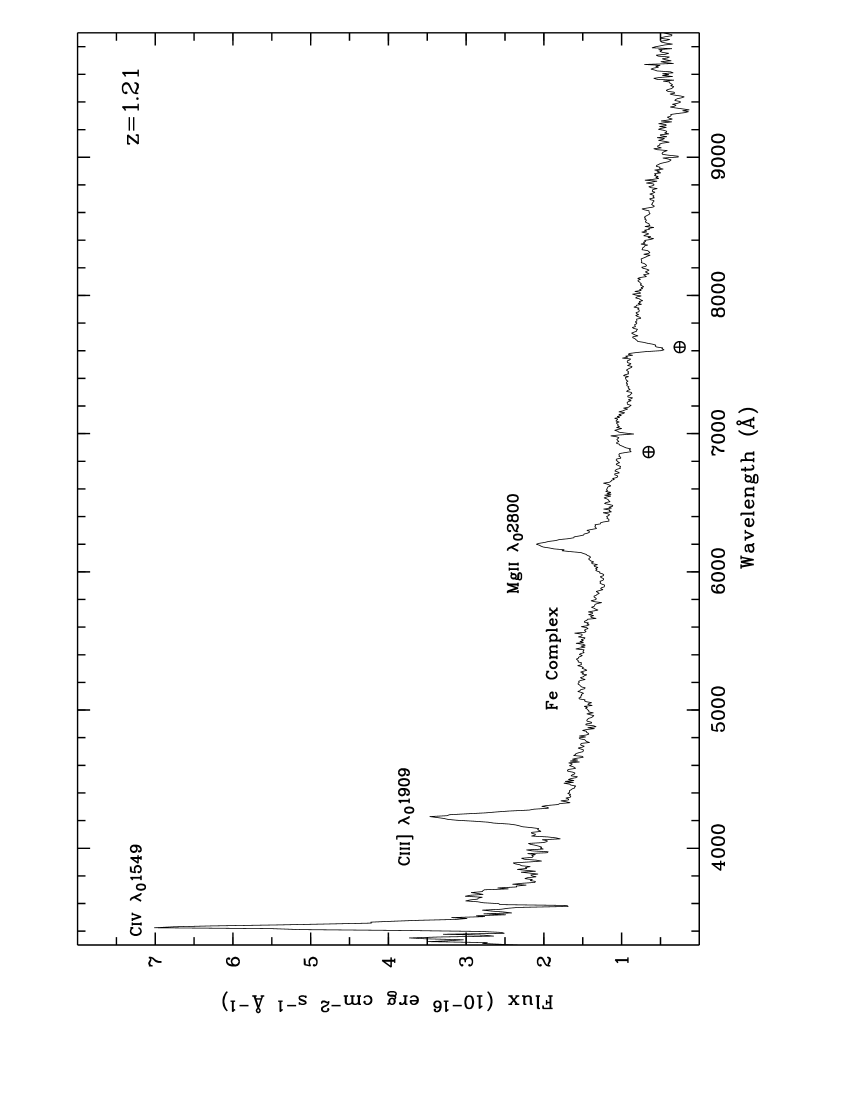
| CTCV J0322–4653 | 03h22m2853 | 46°53′018 | 17.890.02 | 0.370.01 | 0.310.01 | phot | 1.21 |
| 17.840.06 | 0.370.01 | 0.290.01 | spec | ||||
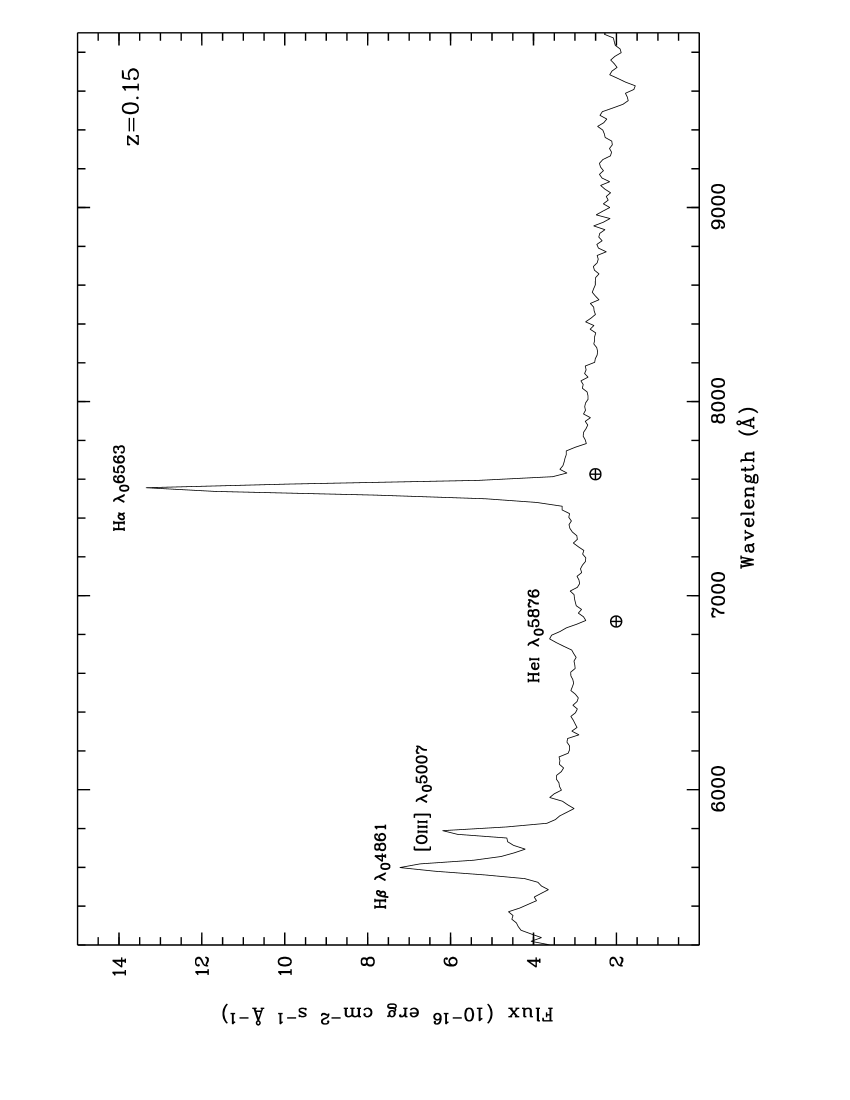
| CTCV J1322–2101 | 13h22m1803 | 21°01′419 | 16.390.06 | – | – | spec | 0.15 |
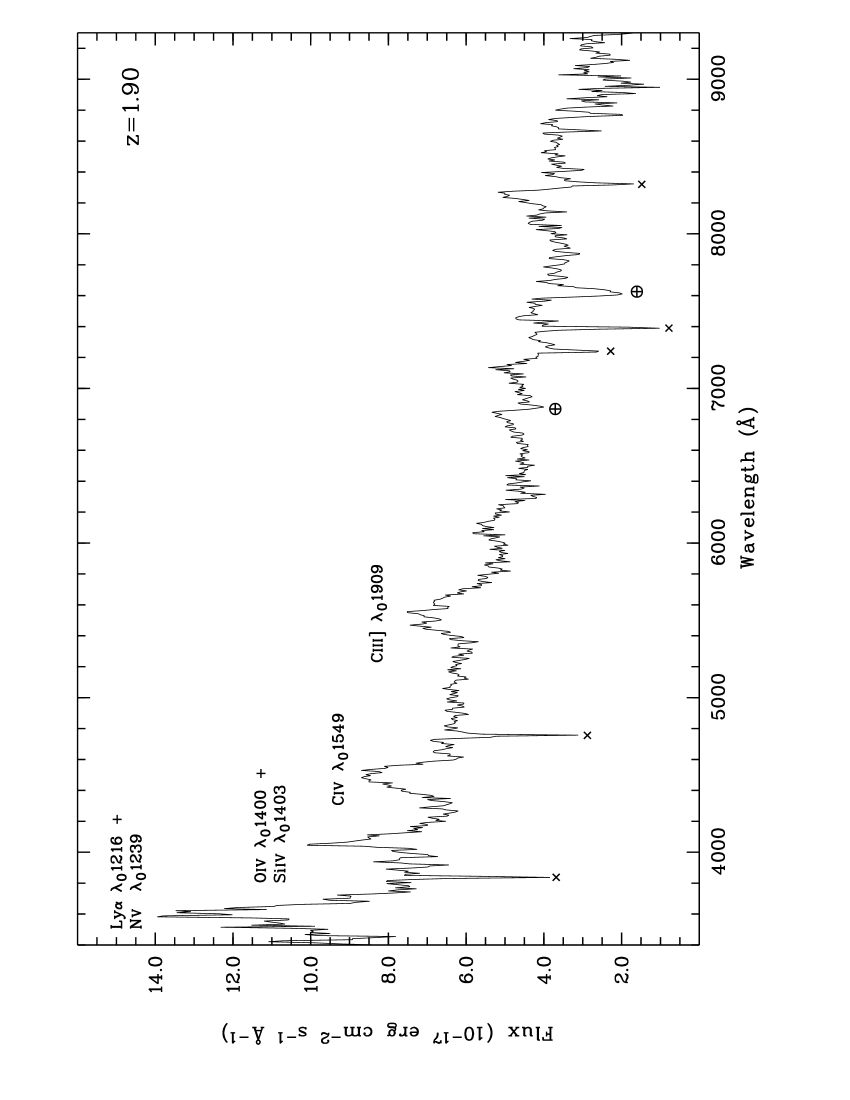
| CTCV J1329–1920 | 13h29m1691 | 19°20′028 | 18.780.06 | 0.480.01 | 0.240.01 | spec | 1.90 |
| 1) Spectrophotometric magnitudes have been corrected for an average slit loss of 0.65 mag | |||||||
The inspection of our spectra revealed broad emission lines typical for non–stellar objects (Fig. 1–3). However, an analysis of the FWHMs, in both the DSS frames and our photometric data, yielded point source characteristics for all three targets, letting us suspect a QSO nature. Also the measured color indices (Tab. 2) show values typical for quasars. The redshifts have been measured from several emission lines after identifying one reference emission line in each spectrum. The remaining lines were identified afterwards based on the comparison with the known rest wavelengths for the one low– and the two intermediate–redshifted objects (see Tab. 2).
For the low redshift QSO, CTCV J1322–2101, only an R magnitude could be determined due to the limited spectral range covered. However, assuming an upper color limit of 0.4, this indicates that the object is probably brighter than 23.
Motivated by the low redshift value of CTCV J 1322–2101, additional near–infrared data were obtained in the K′ band in order to check whether the host galaxy could be detected. No evidence for any extended emission around the object at the level of sensitivity was found. Furthermore, the measured FWHM from the photometry was consistent with stellar values and much smaller than the FWHM of the faint galaxy that is located SE of the QSO.
From all studied quasars discovered by the Calán–Tololo objective prism survey, only very few quasars with redshifts 0.3 have been found. Our finding would be the only high–luminosity quasar () with 0.2 in this survey (Maza et al. Ma96 (1996), and references therein).
Acknowledgements.
Some of the data were obtained, and reduced during a research stay of CT at the Universidad Católica, Santiago, Chile. This was financially supported by the Deutscher Akademischer Austauschdienst (DAAD) under grant D/94/14720. We would also like to thank the referee, Dr. Lutz Wisotzki, for helpful comments.References
- (1) Augusteijn Th., Tappert C. & Maza J. 1999, in preparation
- (2) Green R. F., Schmidt M. & Liebert J. 1986, ApJS 61, 305
- (3) Maza J. et al. 1996, Rev. Mex. Astron. Astrof. 32, 35
- (4) Read M. A., Miller L. & Hasinger G. 1998, A&A 335, 121
- (5) Wisotzki L., Koehler T., Groote D. & Reimers D. 1996, A&AS 115, 227