Interstellar Dust Emission as a CMBR Foreground
Abstract
This chapter discusses Galactic dust and how its thermal emission confuses CMBR measurements. Interstellar dust grains are composed of many differing species, and observational evidence has only begun to disentagle their composition and sizes. Fortunately, their far-IR/millimeter emission is less complex. We describe how a very simple two-species model can describe the emission at to high precision. At lower frequencies, other non-thermal processes may dominate the emission from dust.
University of California at Berkeley, Departments of Physics & Astronomy, 601 Campbell Hall, Berkeley CA 94720
Princeton University, Department of Astrophysical Sciences, Peyton Hall, Princeton, NJ 08544
1. Introduction
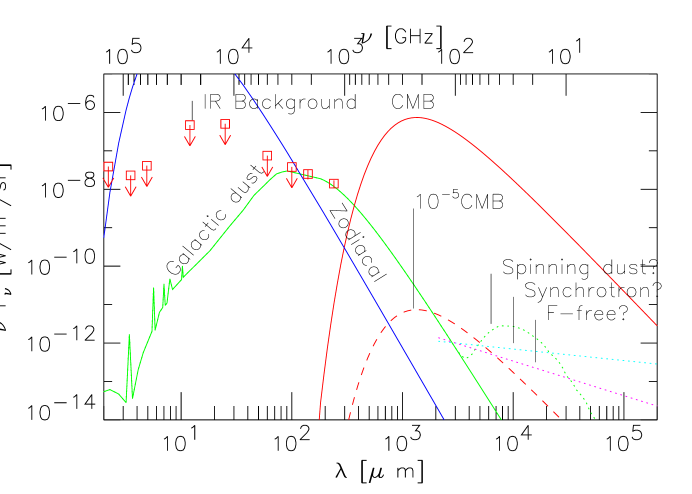
The different sources of radiation in the night sky from the near-infrared through radio are shown in Figure 1. These are to be compared with the CMBR at a temperature of , and the fluctuations in the CMBR which have an amplitude lower by (dashed line). On the Wien tail of the CMBR, thermal emission from Galactic dust is the main source of confusion. This emission is now well-understood, thanks to the COBE/FIRAS experiment (Fixsen et al. 1996). We can predict the thermal emission at all frequencies to a precision of (Finkbeiner, Schlegel & Davis 1999). This work builds upon the maps of dust column density produced by Schlegel, Finkbeiner, & Davis (1998; hereafter SFD98).
At frequencies below , there are more possible sources of confusion with the CMBR. Galactic dust may be one such source if it is rotating supra-thermally, as has been proposed by Draine & Lazarian (1998). Other possible sources are synchrotron emission, free-free emission from ionized hydrogen, and radio emission from extragalactic sources. We briefly discuss all as possible sources for anomalous emission seen at by CMBR experiments.
1.1. Observational Evidence
Dark clouds are apparent to any observer who looks at the Milky Way from a dark site. These dark regions are especially conspicuous in the Southern hemisphere where one sees the utter darkness of the Coal Sack and dark bands across Centaurus and Sagittarius. William Herschel regarded these regions as curious voids in the distribution of stars. In the early 20th century, detailed studies by Trumpler convincingly demonstrated that interstellar dust was responsible. Starlight passing through a dusty medium is subjected to both absorption and scattering. The combination of these effects is termed extinction, denoted for the magnitudes of visual-band extinction. Both processes are wavelength-dependent, resulting in an apparent reddening of the light. Reddening is usually parameterized by its differential extinction between - and -band, .
Advances in infrared astronomy since 1980 have dramatically improved our understanding of interstellar dust. Dust scatters some light in the optical, as can be seen in the Pleiades star cluster. In our solar system, a thick disk of dust in the zodiacal plane scatters some sunlight. However, more energy is absorbed and then re-radiated in the infrared. The zodiacal dust re-radiates most of its energy at . The energetics of this zodiacal dust would be uninteresting except that it dominates the sky (above the atmosphere) at wavelengths . This zodiacal emission has been extensively modeled by Kelsall et al. 1998. Interstellar dust is heated to a lower temperature, radiating its energy at . Approximately of the energy from starlight in our Galaxy is re-processed this way by interstellar dust.
Dust Composition
The diffuse ISM is known to contain many different types of molecules and dust grains whose optical properties are dissimilar. Identifications for some of these constituents have been made from UV absorption features and mid-IR emission features. The ubiquitous bump (in absorption from background stars) is most widely attributed to small () graphite particles (c.f., Draine 1989). Carbon in another form, that of polycyclic aromatic hydrocarbons (PAHs), is probably responsible for strong emission features at , , , and (e.g., Allamandola, Tielens, & Barker 1985; Desert et al. 1990). A review by Henning & Salama (1998) contains the latest information on carbon-based grains. Other mid-IR emission features are attributed to silicates and troilites. For a coherent and only somewhat dated review, see Whittet (1992).
Grain Sizes
Along with the composition of dust grains, their size distribution also impacts their extinction and emission properties. The UV/optical extinction, , is neatly described by a one-parameter family of curves (Cardelli, Clayton, & Mathis 1989). That one parameter is usually chosen as an observable ratio,
| (1) |
Clayton & Cardelli (1988) have measured the extinction curve for 76 lines-of-sight in our Galaxy. Most diffuse clouds favor an extinction curve. However, there are variations in from to , where the larger values correspond to some dense cloud environments. Changes in grain size distribution is presumed responsible for these variations. On average, interstellar dust grains are thought to follow a power law distribution of grain sizes (Mathis, Rumpl, & Nordsieck 1977) from about (the size at which absorption of a single photon can sublimate mass away from the grain) to . The large-size cutoff at is necessary to be consistent with the measurements of (Kim, Martin & Hendry 1994). Larger grains would be relatively gray absorbers, increasing the value of beyond that observed. So provides crucial information on the grain size distribution, and may be found in the future to correlate with some aspect of the far-IR emission from dust.
Polarization Effects
Besides attenuating starlight, dust grains are known to polarize that light. To date, polarization of optical light has been measured towards stars (Mathewson & Ford 1970; Korhonen & Reiz 1986), some high above the Galactic plane (Berdyugin & Teerikorpi 1997). Regions of higher polarization are correlated with regions of higher extinction (e.g., Larson, Whittet, & Hough 1996). One expects polarization only if the dust grains are non-spherical and have a preferential axis of alignment. For this reason, polarization studies have been used to argue for coherent, large-scale magnetic fields in the Galaxy (e.g., Heiles 1996). The magnetic moments of the dust grains will preferentially align with the ambient magnetic field. As these aligned grains rotate, they emit polarized radiation that may interfere with attempts to measure the polarization of the CMBR anisotropy.
Dust Distribution
The morphology of the interstellar dust is quite complex, consisting of dark clouds and long filamentary structures arching across the sky. The diffuse, wispy parts of this emission are known as cirrus, to differentiate them from more compact features (often associated with individual objects). Not surprisingly, the dust emission is concentrated in the Galactic plane, but significant cirrus is observed in every part of the sky at (Low et al. 1984). SFD98 have computed the power spectrum of this dust at latitudes , finding a reasonable fit to . However, as this cirrus is in coherent structures, a 1-D power spectrum is not statistically sufficient to describe its distribution. This morphology is another obstacle to CMBR measurements since it is not at all reminiscent of gaussian random-fields that CMBR pundits usually model. However, this phase coherence provides avenues that may prove helpful in determining the quality of a dust foreground model as applied to real microwave data. For example, we can easily measure the 3-point function of the Galactic dust. If the CMBR is presumed to be gaussian, a non-zero 3-point function in a foreground-subtracted CMBR map will measure the level of residual contamination (Spergel 1998).
1.2. Far-IR Emission
In spite of the expected melange of dust grains, it was originally expected that in the far-IR/submillimeter bands, all dust would have similar optical properties. For example, Draine & Lee (1984) predicted emissivity for both silicate and graphite grains whereby the emission is described by
| (2) |
The theoretical motivation for this emissivity is based on the fact that the response of a damped harmonic oscillator to a driving force varies as in the low frequency limit (far below resonance). Even though microwave frequencies are below all of the phonon modes in the smallest crystals, this is not true for grains bigger than , and these bigger grains are expected to dominate the emission. More recent laboratory measurements (see Pollack et al. 1994 for a review) suggest that this is an oversimplication, with different species of grains having differing emissivity laws in the far-IR. In particular, glassy materials (e.g. amorphous silicates) in some cases radiate more efficiently than their crystalline counterparts, and are more closely characterized by a emissivity (Agladze et al. 1996). As we show below, these silicates probably dominate the millimeter/microwave emission relevant to CMBR studies.
Fortunately, complete knowledge of the size and composition of interstellar dust grains is not necessary to predict their impact upon CMBR studies. Since the long wavelength emissivity of a grain scales as its size times the surface area, or volume , the larger grains dominate the submillimeter emission (Draine & Anderson 1985) The very small grains (VSGs) are transiently heated to higher temperatures and dominate the dust emission at , but do not contribute significantly to submillimeter emission. The opacities of dust grains are exceedingly complicated in the UV/optical where they absorb energy, and slight changes in composition can significantly alter them. However, their far-IR opacities are not nearly as sensitive. Both laboratory and astronomical measurements are well-fit at () using power-law emissivities with indices in the range from to (see Pollack et al. 1994).
2. Microwave Foregrounds
Interstellar dust is only one of the many foregrounds that complicate measurement of the CMBR anisotropy. An analysis of the relative importance of the various foregrounds is given by Tegmark & Efstathiou (1996). In this section, we provide a brief overveiw of the most important foregrounds.
At low frequencies, the dominant diffuse Galactic emission is due to synchrotron radiation produced by relativistic electrons interacting with the Galactic magnetic field. A map at 408 MHz by Haslam et al. (1981) is the only full-sky synchrotron template in existence. Reich & Reich (1986) cover the northern sky in the continuum, and are complemented by the new Rhodes/HartRAO survey at in the south (Jonas, Baart, & Nicolson 1998). Where these maps all overlap, they allow examination of the synchrotron radiation at 3 frequencies – and indicate significant spectral index variation across the sky. The synchrotron radiation is usually characterized by a spectral index in units of brightness temperature, or in units of flux (e.g., MJy/sr). The typical high-latitude brightness temperature at predicted from these data is approximately , rising to no more than in the Galactic plane. Extrapolating the power law to , the synchrotron emission would contribute at most 10 to the emission at high latitude. However, the index is seen to steepen to or less even at low frequencies, due to a cutoff in the electron energy distribution (Jonas 1998). Therefore, synchrotron emission is unlikely to be an important emission component at high latitude at .
Another diffuse component that is not well constrained is free-free emission from ionized gas. Except in H II regions, free-free is lost in the signal of synchrotron emission at low frequencies (e.g., at 408 MHz). Although there is known to be ionized gas at high latitude from H emission (Haffner, Reynolds, & Tufte 1998), so far no convincing correlation has been seen between H data and data. As more data of both types become available, we expect to see a correlation. Another possible emitter of free-free is the Local Hot Bubble (LHB) of ionized gas in which the Sun and many other stars reside. A map of this bubble was produced using the absorption of soft X-rays observed by ROSAT (Snowden et al. 1998). Because the gas in the LHB is very hot, the anticipated H emission per microwave emission is very low, so this will not appear in the H template.
In addition to these diffuse components, a wealth of point sources are apparent at radio and far-IR frequencies. Several hundred thousand radio sources have been observed in the PMN (Griffith & Wright 1993) and NVSS (Condon et al. 1998) surveys. At , SFD98 identified extragalactic sources and unresolved Galactic sources. These sources will contribute a great deal of non-gaussian contamination to the CMBR. The brightest ones are very easy to identify and remove. Preliminary work has shown that removing the brightest sources will be sufficient for power-spectrum analyses with the MAP experiment (Tegmark & de Oliveira-Costa 1998). Point source decrements due to the Sunyaev-Zeldovich effect will have also been seen, and their impact on CMBR observations has been noted (Aghanim et al. 1997).
As we have emphasized, the dust emission described in the next section is not the only diffuse foreground, but it is the brightest at high frequencies (). However, it is important for another reason. The excess dust-correlated emission observed in the DMR and channels (Kogut et al. 1996) and later by other experiments (e.g. Leitch et al. 1997; de Oliveira-Costa et al. 1998) is still unexplained. It may be caused by dust-correlated free-free emission. On the other hand, it may be the result of rapidly rotating dust grains (Draine & Lazarian 1998). Whatever this component is, it appears to correlate fairly well with dust, making the determination of a good dust template more important than thermal (vibrational) dust emission alone would indicate.
3. Single Component Dust Model
A simple but naive prediction for millimeter/microwave dust emission can be made from our previous work. SFD98 extensively studied the emission from dust in the regime . Assuming a emissivity model, the temperature of the dust was mapped with a resolution of from the DIRBE / emission ratio. The emission of the dust was mapped with a resolution of by utilizing small-scale information from the IRAS Sky Survey Atlas (Wheelock et al. 1994). Emission at lower (millimeter/microwave) frequencies can be predicted by extrapolating the flux using this temperature fit. For each line-of-sight in the maps, the emission at frequency can be expressed as
| (3) |
where is the Planck function at temperature , is the DIRBE-calibrated map, is the color correction factor for the DIRBE filter when observing a emissivity profile, and is the reference frequency corresponding to .
The extrapolated, millimeter emission from dust as predicted from SFD98 can be compared directly to the FIRAS measurements. We synthesize a broadband FIRAS channel (to increase S/N) and show that the correlation with predictions from equation 3 is very good (Figure 2c). For comparison, we plot the correlation with (a) H I column density, and (b) DIRBE flux. Both of these show a scatter that is 3.7 times worse than with SFD, demonstrating that millimeter emission from dust is neither simply related to the H I column density, nor is the dust at one temperature everywhere on the sky.

Our regression line in Figure 2 differs significantly from unity, indicating that a emissivity is incorrect for the dust. At lower frequencies, the slope departs even more strongly from unity. This is an indication that a emissivity is incorrect for the dust, as can be seen from the mean spectrum of large regions of the sky (Figure 3: since the DMR is a differential instrument, we have plotted the difference between bright and faint regions of the sky.)

The SFD prediction can be made using other emissivity profiles by modifying the exponent, , in equation 3. An emissivity profile results in a better fit at low frequencies, but ruins the fit at high frequencies. In fact, there is no power-law emissivity model that adequately fits the FIRAS data.
4. Multi-Component Dust Model
Motivated by observations of many different grain species in the ISM, we have formulated a general description of a multi-component ISM suitable for microwave predictions (Finkbeiner et al. 1999). We capitalize upon the uncertain degeneracies between components to construct a multi-component model with very few degrees of freedom. As we discussed, any one component of dust might be expected to exhibit power-law emissivity in the range . The complicated behavior of their optical opacities is unimportant. The only relevant optical parameter is , the effective cross-section to the interstellar radiation field (ISRF):
| (4) |
where represents the angle-averaged intensity in the ISRF.
We construct a multi-component model of the ISM, analogous to equation 3, by summing the emission of these components:
| (5) |
where is the mass fraction of the -th component, is the temperature, is the DIRBE color-correction factor and is the SFD98 flux. The mass fractions are forced to sum to unity, i.e. . Each emissivity is a power-law with index . The observationally relevant parameter is the ratio of far-IR emissivity to the effective optical opacity, .
Each dust component is therefore described by three global parameters (, , ) and one parameter that varies with position on the sky, e.g., ). The temperatures of all dust species are coupled by demanding that they all respond to the same ISRF (for more details, see Finkbeiner et al. 1999). Whether or not the actual components of the dust physically correspond to these components, equation 5 can be thought of as a phenomenological “expansion set” for describing the composite dust spectrum.
Remarkably, we find that only two components of dust are required to describe the spectrum everywhere on the sky as seen by FIRAS. As a first guess, we tested a two-component model designed to replicate the spectrum in Pollack et al. 1994. The prescription in their paper for their best-fit broken power law corresponds in our model to and . This results in a considerably better fit without fitting any new free parameters. Between and , where the FIRAS signal is very good, the model matches the data to approximately 1% everywhere. At lower frequencies, the largest deviation is .
Allowing and to float provides even better fits. Our best fit is achieved with two components with power-law emissivities , , where the former component dominates the emission at . We have fit 71% of the sky as observed by FIRAS (4378 pixels) at 123 frequencies, for a total of data value comparisons. We also effectively fit for an unconstrained zero-point value at each frequency to avoid having the solution influenced by uncertainties in the cosmic infrared background. The resulting reduced is /DOF, as compared to (!) for the best single-component model. Results for a suite of models, including our best fit 2-component model, are given in Finkbeiner et al. (1999) along with tests of their robustness.

5. Discussion
The thermal emission from Galactic dust can be very successfully predicted at millimeter/microwave frequencies using a two-component composition model with temperature varying on the sky. We interpret the best fit as a amorphous silicate-like component ( emissivity, ) and a carbonate-like component ( emissivity, ). The FIRAS data are also reasonably well fit using two emissivity components, if one of these components is very cold () as proposed by Reach et al. (1995). We find no evidence for a warm component ( emissivity, ) as proposed by Lagache et al. 1999.
A full range of Galactic dust models are discussed in Finkbeiner et al. 1999. Numerical predictions for thermal emission will be made available at our web page,
http://astro.berkeley.edu/dust ,
or at the FORECAST (FOREgrounds and CMB Anisotropy Scan simulation Tools) home page,
http://cfpa.berkeley.edu/forecast.
By using the IRAS maps as reprocessed by SFD98, these predictions will be provided at a resolution of .
It is critical that CMBR experimentalists compare their observations with valid models for the Galactic dust emission. A “template approach” is often carelessly used to compare observations with alleged contaminants, with the correlation amplitude indicating the level of contamination. For example, radio maps (e.g., the Haslam et al. map at ) are used as templates for synchrotron emission at much higher frequencies, in spite of the well known spectral index variation. maps (e.g., Leiden-Dwingeloo) are often used as templates for microwave dust emission. This can be a terrible template, as it ignores variations in the dust/gas ratio and the well-measured variations in dust temperature. This point is demonstrated in Figure 4, where we have correlated the Leitch et al. (1997) 14.5 GHz data with possible templates for the dust emission. The microwave data shows very little correlation with a template, or with the even more simple-minded (but still occasionally used) model for Galactic dust. One might incorrectly conclude from this that there is little dust contamination in this CMBR data. In fact, when we correlate the Leitch et al. data with a proper prediction at , there is evidence for significant contamination. A naive comparison with IRAS flux also indicates a strong correlation with dust - but with the wrong amplitude. We find that the dust on the ring used by Leitch et al. is cold enough to lower the emission per dust column by a factor of 2.75 relative to the average high-latitude ratio. Therefore, the amount of 14.5 GHz emission per dust column is overstated by a factor of in comparisons such as the famous Figure 11 in Draine & Lazarian (1998). We hope that our dust spectrum model will allow both a realistic prediction of the thermal (vibrational) dust emission, and also facilitate a meaningful comparison between the dust and the mysterious excess 15-90 GHz emission component that correlates so well with it.
Acknowledgments.
The COBE datasets were developed by the NASA Goddard Space Flight Center under the guidance of the COBE Science Working Group and were provided by the NSSDC. Dale Fixsen has been very helpful in understanding the calibration uncertainties in the COBE/FIRAS data.
References
Aghanim, N., De Luca, A., Bouchet, F.R., Gispert, R., & Puget, J.L. 1997 A&A, 325, 9
Agladze, N. I, Sievers, A. J., Jones, S. A., Burlitch, J. M., & Beckwith, S. V. W. 1996, ApJ, 462, 1026
Allamandola, L. J., Tielens, A. G. G. M., & Barker, J. R. 1985, ApJ, 290, L25
Berdyugin, A., & Teerikorpi, P. 1997 A&A, 318, 37
Cardelli, J. A., Clayton, G. C., & Mathis, J. S. 1989, ApJ, 345, 245
Clayton, G. C., & Cardelli, J. A. 1988, AJ, 96, 695
Condon, J. J., Cotton, W. D., Greisen, E. W., Yin, Q. F., Perley, R. A., Taylor, G. B., & Broderick, J. J. 1998 AJ, 115, 1693
de Oliveira-Costa, A., Tegmark, M., Page, L., & Boughn, S. 1998, ApJ, 509, 9
Desert, F. X., Boulanger, F., & Puget, J. L. 1990, A&A, 237, 215
Draine, B. T. 1989, in “Interstellar Dust”, ed. L. J. Allamandola & A. G. G. M. Tielens (Dordrecht: Kluwer), 313
Draine, B. T., & Anderson, N. 1985, ApJ, 292, 494
Draine, B. T., & Lazarian, A. 1998 ApJ, 508, 157
Draine, B. T., & Lee, H. M. 1984, ApJ, 285, 89
Finkbeiner, D. P., Schlegel, D. J., & Davis, M. 1999, in preparation
Fixsen, D. J., Cheng, E. S., Gales, J. M., Mather, J. C., Shafer, R. A. & Wright, E. L. 1996, ApJ, 473, 576
Griffith, M. R., & Wright, A. E. 1993 AJ, 105, 1666
Haffner, L. M., Reynolds, R. J., & Tufte, S. L. 1998, ApJ, 501, L83
Hauser, M. G. et al. 1998, ApJ, 508, 25
Haslam, C. G. T., Klein, U., Salter, C. J., Stoffel, H., Wilson, W. E., Cleary, M. N., Cooke, D. J., & Thomasson, P. 1981, A&A, 100, 209
Heiles, C. 1996, ApJ, 462, 316
Henning, Th., & Salama, F. 1998, Science, 282, 2204
Jonas, J. L. 1998, PhD thesis, Rhodes University
Jonas, J. L., Baart, E. E., & Nicolson, G. D. 1998, MNRAS, 297, 977
Kelsall, T. et al. 1998, ApJ, 508, 44
Kim, S., Martin, P. G., & Hendry, P. D. 1994, ApJ, 422, 164
Kogut, A. et al. 1996, ApJ, 464, L5
Korhonen, T., & Reiz, A. 1986, A&AS, 64, 487
Larson, K. A., Whittet, D. C. B., & Hough, J. H. 1996, ApJ, 472, 755.
Lagache, G., Abergel, A., Boulanger, F., Desert, F. X., & Puget, J. L. 1999, astro-ph/9901059
Leitch, E. M., Readhead, A. C. S., Pearson, T. J., & Myers, S. T. 1997, ApJ, 486, L23
Low, F. J. et al. 1984, ApJ, 278, L19
Mathewson, D. S., & Ford, V. L. 1970, MmRAS, 74, 139
Mathis, J. S., Rumpl, W., & Nordsieck, K. H. 1977, ApJ, 217, 425
Pollack, J. B., Hollenbach, D., Beckwith, S., & Simonelli, D. P., Roush, T., & Fong, W. 1994, ApJ 421, 615
Reach, W. T., et al. 1995, ApJ, 451, 188
Reich, P., & Reich, W. 1986, A&AS, 63, 205
Roush, T., & Fong, W. 1994, ApJ 421, 615
Schlegel, D. J., Finkbeiner, D. P., & Davis, M. 1998, ApJ, 500, 525 [SFD98]
Snowden, S. L., Egger, R., Finkbeiner, D. P., Freyberg, M. J., & Plucinsky, P. P. 1998, ApJ 493, 715
Spergel, D. 1998, priv. comm.
Tegmark, M., & de Oliveira-Costa, A. 1998, ApJ, 500, 83L
Tegmark, M., & Efstathiou, G. 1996, MNRAS, 281, 1297
Wheelock, S. L. et al. 1994, IRAS Sky Survey Atlas: Explanatory Supplement, JPL Publication 94-11 (Pasadena: JPL)
Whittet, D. C. B. 1992, “Dust in the Galactic Environment” (Cambridge University Press)