NEW HST OBSERVATIONS OF THE HALO GAS OF NGC 3067 – LIMITS ON THE EXTRAGALACTIC IONIZING BACKGROUND AT LOW REDSHIFT AND THE LYMAN CONTINUUM ESCAPE FRACTION
Abstract
We present ultraviolet spectroscopy from HST/GHRS and reanalyze existing H images of the quasar/galaxy pair 3C 232/NGC 3067 and of the halo gas associated with NGC 3067. The spectra permit measurement of, or limits on, the column densities of Fe I, Fe II, Mg I, and Mg II in the absorbing cloud. Two distinct models of the extragalactic radiation field are considered: (1) the ionizing spectrum is dominated by a power-law extragalactic continuum, and (2) the power-law spectrum contains a Lyman break, implying enhanced flux longward of 912 Å relative to the hydrogen-ionizing flux. Models of the second type are required to fully explore the ionization balance of the Fe and Mg in the model cloud. The H images constrain the escape fraction of Lyman continuum photons from the galaxy to 0.02. With the assumption that the cloud is shielded from all galactic contributions, we can constrain the intensity and shape of the extragalactic continuum. For an AGN-dominated power-law extragalactic spectrum, we derive a limit on the extragalactic ionizing flux 2600 photons cm-2 s-1, or erg cm-2 s-1 Hz-1 sr-1 for a ionizing spectrum and a cloud of constant density. When combined with previous upper limits from the absence of H recombination emission from intergalactic clouds, our observations require 2600 10000 photons cm-2 s-1. We show that if galactic contributions to the incident radiation are important, it is difficult to constrain . These results demonstrate that galactic halo opacities and their wavelength dependence are crucial to understanding the abundance of low-ionization metals in the IGM.
1 INTRODUCTION
The extragalactic radiation field and its evolution with redshift play an important role in our understanding of the intergalactic medium (IGM) and its constituents. Ionizing photons, believed to be produced primarily by active galactic nuclei (AGN) but with a potentially large contribution from starburst galaxies, permeate the IGM and dominate the ionization of Ly clouds, QSO metal-line absorbers, and possibly high-latitude Galactic clouds. Tight constraints on the intensity and spectrum of this radiation are essential to the interpretation of IGM observations.
A direct measurement of the intensity of the ionizing background is impossible due to its attenuation by Galactic H I and dust. Thus, we must measure its effects on detectable gas and deduce its intensity and spectrum from the photon “fossil record”. Typically, conclusions are hindered by the necessary introduction of model assumptions about the affected gas and by the inherent uncertainties of photoionization modeling.
Careful treatments of the radiative transfer of ionizing photons within the IGM (Haardt & Madau 1996; Fardal et al. 1998; Shull et al. 1999) have shown that the diminished opacity of the IGM at low redshift implies that the shape of the extragalactic spectrum at approximates the intrinsic spectra of the ionizing sources. In contrast, the high- ionizing background spectrum is dominated by the effects of radiative transfer in the IGM. Thus, at low redshift, a first-cut picture of the extragalactic ionizing spectrum is the intrinsic spectrum of QSOs, unaffected by attenuation due to the IGM. Zheng et al. (1997) combined HST observations to form a composite spectrum for a radio-quiet QSO which may be fitted by a power law, , with spectral index between 350 Å and 1050 Å. These results motivate an initial assumption that the ionizing background has a similar power-law form. The relative contribution of ionizing photons produced in OB associations in galaxies, however, is potentially very large. The dimensionless parameter expresses the total fraction of Lyman continuum (LyC) photons produced in a galaxy that escape its interstellar medium and halo and contribute to the extragalactic ionizing background. If the average in starburst galaxies, then their contribution may exceed that of QSOs at low redshift (Madau & Shull 1996; Giallongo et al. 1997; Shull et al. 1999).
To facilitate comparisons between results obtained with different assumed spectral shapes, we define a quantity , the one-sided, normally incident hydrogen-ionizing photon flux:
| (1) |
where and = (10-23 erg cm-2 s-1 Hz-1 sr-1) at 1 Ryd. In this paper, we will quote and assume for citations of .
Previous measurements of and relied on a number of different techniques. Maloney (1993) and Dove & Shull (1994) analyzed the H I edges of galactic disks to infer photons cm-2 s-1. Kulkarni & Fall (1993) used the falloff in the distribution of Ly forest clouds close to quasars (the proximity effect) at to derive 102.7 – photons cm-2 s-1. In a previous study of the halo gas associated with NGC 3067, Stocke et al. (1991) used non-detection of H emission from the cloud to argue for an upper limit on photons cm-2 s-1. More recent efforts to detect H emission from intergalactic clouds have set upper limits on 104.0 cm-2 s-1 (Donahue, Aldering, & Stocke 1995; Bland-Hawthorn & Maloney 1999).
The quantity is poorly known. Leitherer et al. (1995) used FUV spectra from the Hopkins Ultraviolet Telescope to place upper limits on 0.0095, 0.017, 0.048, and 0.15 for four nearby starbursts. Subsequent reanalysis of the same data by Hurwitz et al. (1997) argued for higher fractions, 0.032, 0.052, 0.11, and 0.57. Based on an opacity-dominated theoretical model of , Deharveng et al. (1997) argued for a very low . More recently, Bland-Hawthorn & Maloney (1999) used measurements of H emission from the Magellanic Stream to infer for our Galaxy. The paucity of measurements in the literature can be attributed to the difficulty of such endeavors; directly affects the spectra of galaxies in a wavelength regime obscured by our own ISM, especially for available targets at low redshift.
When comparing theoretical and observational estimates of , it is important to distinguish between the two extant physical conceptions of the escape fraction. The “opacity” interpretation (Deharveng et al. 1997) postulates that galaxies are shrouded in thick layers of H I that provide a high photoelectric opacity to ionizing photons. In this model, the galactic ionizing photon flux is attenuated uniformly by optical depth , where in the simplest model , is the column density of neutral hydrogen in the absorbing gas, and is the photoionization cross-section for neutral hydrogen. The “geometric” interpretation (Dove & Shull 1994; Dove et al. 1999) rests on essentially the same model of the galactic disk and halo, but with the addition of “holes” produced by supernovae and winds from massive stars. These holes contain little H I, and LyC photons may escape relatively freely through them. The important distinction is that, in the first case, is dominated by H I opacity and may be uniform for all galaxies of a given morphology. In the second case, is dominated by inhomogeneities in the disk and halo and may be sensitive to an individual galaxy’s star formation history.
With the goal of improving limits on and gauging the importance of radiation longward of 912 Å, we observed the quasar/galaxy pair 3C 232/NGC 3067 and conducted a study of metal absorption lines in the halo gas of NGC 3067 using the Goddard High Resolution Spectrograph (GHRS) on the Hubble Space Telescope. We measured column densities of Fe II, Mg I and Mg II and placed limits on Fe I in the NGC 3067 halo gas. We interpreted these data to estimate the extragalactic photoionizing radiation field and to model the thermal equilibrium of the halo gas. The technique of using absorption-line ratios to infer the ionizing background (Stocke et al. 1991) is sensitive to smaller portions of gas in the QSO sightline. The H method derives limits on from emission measurements of the entire cloud and is insensitive to its shape and size. While the non-detections of H give upper limits on , in principle our measurements of Fe and Mg yield lower limits. This method has the drawback of an additional dependence of the Fe and Mg line ratios on radiation between 912 – 1600 Å. The H detection experiments push the technological limits of ground-based imaging, but the absorption line approach is technically feasible for HST (with GHRS, STIS, or COS), given appropriately bright targets such as 3C 232.
In § 2 of this work we describe our observations. In § 3 we describe the reanalysis of the Stocke et al. (1991) H images and the limit they impose on . In § 4 we interpret the GHRS spectra and constrain and the shape of the extragalactic spectrum. In § 5 we review our results for and and place our models in the context of these and other observations.
2 OBSERVATIONS
2.1 Narrowband H Images
To constrain the ionizing flux from the local contribution of NGC 3067, we reanalyzed the H images presented in Stocke et al. (1991). These images were obtained at the KPNO 2.1 m telescope in July 1989. The dataset consisted of two 20-min exposures through a narrow-band interference filter centered on the redshifted H wavelength ( Å, = 75 Å) and a corresponding “off-band” image through a similar interference filter centered 400 Å longward of the first and chosen to avoid the redshifted S II 6719,6731 doublet. The images were flat-fielded and calibrated so that 1 DN in the images equals erg cm-2 s-1 incident on the telescope.
Using sky background well away from the location of the absorbing cloud, we scaled the overall background to identical mean values in the on-band and off-band images and then subtracted the latter from the former to produce a “pure” H image of the galaxy. In the pure H image we added up all the detected H photons in the immediate region of the galaxy to obtain an integrated H flux for the galaxy of 0.439 photons cm-2 s-1 incident at the observer. If the galaxy lies at the velocity of its H I 21-cm emission, then its distance = 18.9 h Mpc, and the total H photon luminosity is photons s-1 (where is the Hubble constant in units of 75 km s-1 Mpc-1). This result is used below (§ 3) to impose a limit on the Lyman continuum escape fraction .
2.2 GHRS Spectroscopy
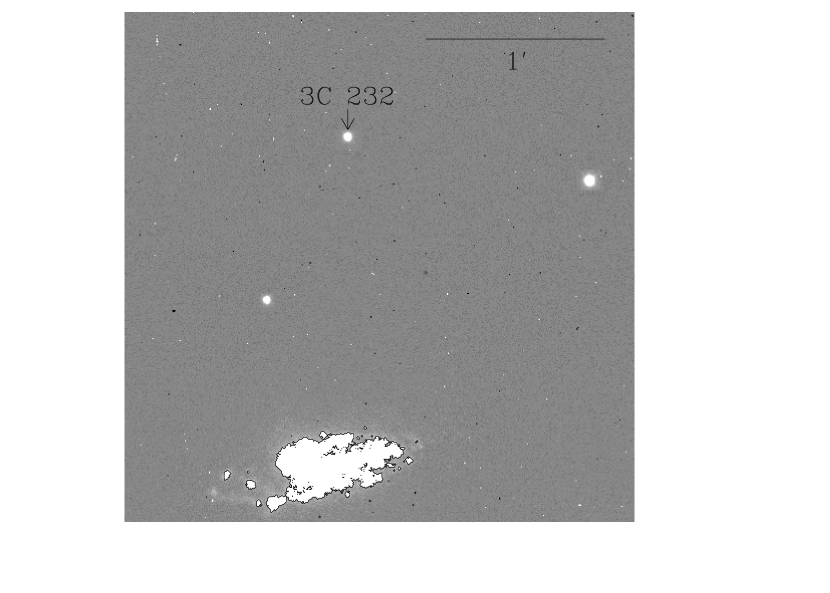
The extended gas cloud associated with NGC 3067 is intercepted by the sightline to the quasar kpc above the disk of the galaxy (Figure 1; Stocke et al. 1991; Carilli & van Gorkom 1992). We observed 3C 232 to measure the absorption lines in the quasar spectrum that arise in the cloud. The galaxy lies at redshift = 0.00474 (Carilli & van Gorkom 1992) and the quasar lies at = 0.532 (Hewitt & Burbidge 1993). These observations were carried out during HST Cycle 6 in 1996 using the GHRS with the G270M grating (R 28,000),the GHRS Large Science Aperture (LSA), and post-COSTAR optics. Five grating carousel positions were used to center the spectra on the lines of interest. A journal of these observations appears in Table 2.2. In addition to measuring absorption in the halo gas of NGC 3067, we measured lines of the same ionization species in the interstellar medium of the Milky Way and detected a C IV absorption complex that is apparently intrinsic to the quasar. Results of these latter two parts of the investigation will be published separately.
The data were calibrated with the standard STSDAS/GHRS pipeline and the most recent available reference files (as of April 1998). With this software, we subtracted the background, calibrated the wavelengths and fluxes, and co-added the spectra. We subtracted a polynomial background continuum model to avoid the oversubtraction associated with readout of data over the South Atlantic Anomaly (De La Pena & Soderblom 1997). We used a custom error-propagation routine to calculate the errors pixel-by-pixel with standard statistical methods.
An uncertainty in the zero-point wavelength of the individual exposures is introduced into the GHRS data by the uncertainty in the position of the target within the LSA. The aperture subtends 1.74′′ and 2.5 diodes on the detector, which corresponds to 0.96 Å with G270M and causes a 17 km s-1 arcsec-1 shift in the observed velocities. The actual shift could be as low as 5 km s-1, given the typical 0.1′′ accuracy in pointing of the telescope. Since we observe close velocity coincidence between Mg II absorption and the Na I components reported by Stocke et al. (1991), and because our results are not dependent on the precise wavelength calibration, we can tolerate velocity uncertainty at this level.
The complete, reduced spectra appear in Figure 2, together with the previous FOS spectra of 3C 232 from the HST Key Project (Jannuzi et al. 1998) Close-ups of the lines detected in the new GHRS/G270M spectra appear in Figures 3 and 4, plotted in observed velocity space to show their coincidence111A small (+2 km s-1) heliocentric correction has been applied to the observed GHRS data based on the position of the target.. The oversampled data have been smoothed to instrumental resolution (0.1 Å) by a 5-pixel sliding boxcar filter. We judge the statistical significance of absorption features by imposing a cutoff depth for positive identification at their predicted velocities. A summary of the detected lines appears in Table 2.2.
The most striking feature of the new spectra is the 30% increase in the mean level of the quasar continuum between the two epochs (FOS in 1992 and GHRS in 1996). Because this difference exists even after both spectra are calibrated with the best available calibration files, we attribute this increase to variability in the quasar. Bruhweiler et al. (1986) reported variability in 3C 232 on time scales as short as a day. The level of the continuum affects our measurements minimally, and the issue of variability is left for a future discussion of intrinsic quasar features.
Stocke et al. (1991) reported the detection of three distinct velocity components in Na I and Ca II absorption in this line of sight. These components lie at = 1417 km s-1 (system 1), 1369 km s-1 (system 2), and 1530 km s-1 (system 3). System 1 corresponds to the velocity, = 1420 km s-1, of the cold absorbing H I gas reported by Carilli & van Gorkom (1992). The majority of the observed lines in our GHRS spectra are saturated, which erases almost all detailed information about velocity components. However, we note velocity coincidence with the Stocke et al. (1991) components in almost all lines. In Fe II, Mg I, and Mg II we detect absorption at the velocities of at least one of the these three components, and in most cases all three (Figures 3 and 4). In Mg I 2853 we detect absorption at the velocities of system 1 and system 2. Strong absorption corresponding to all three components is detected in the saturated Mg II 2796,2804 doublet. All three components are detected in Fe II 2586, 2600, 2344, and 2374, but no lines of Fe I are seen. The non-detection of Fe I has important implications for our estimates of .
With the goal of placing conservative error bars on our measurements, we fitted the continuum on a line-by-line basis with the maximum possible number of continuum points. The continuum points were fitted with Legendre polynomials, which allow the addition of higher-order terms to the fit without changes in the lower-order coefficients. In all cases, low-order polynomials were used ( 4). No higher terms were added after the per degree of freedom changed by less than 5%. We measured equivalent widths with two methods. For the saturated lines, we integrated the line under the fitted continuum without attempting to fit the profile. We fitted the unsaturated lines with single or double Gaussian components and calculated equivalent widths from the best-fit parameters. The tabulated values are the total equivalent width for each line taken from the best available measurement. Errors were calculated according to the comprehensive scheme outlined in Sembach & Savage (1992, their Appendix A). This method estimates errors both from the fitting of the continuum and from the statistical errors propagated through the calibration, and it accounts for all sources of statistical uncertainty.
The spectrum at setting 5 would contain Fe I 2484 and 2502 in absorption at the positions indicated in Figure 4. There are no easily distinguishable absorption features in this spectrum, and there are no features at all deeper than . We have calculated upper limits on the column density of Fe I based on upper limits on the equivalent widths of these undetected lines. These limits are used in all subsequent analysis.
Because we detect absorption at velocities corresponding to the three components detected by Stocke et al. (1991), we argue that the simplest interpretation of these data is that all three components exist, but are too high in column density to appear distinctly separate in Fe II and Mg II. Carilli & van Gorkom (1992) reported that the width of the neutral H I 21-cm absorption line is 4.7 km s-1. We note that 21-cm absorption measures N(H I) / , and thus is most sensitive to cold gas. If this line width is purely thermal, then Fe and Mg should exhibit line widths correspondingly lower in proportion to their atomic masses. Because we see lines in Fe and Mg that are km s-1 broad, we must attribute this broadening in resolved lines to warm gas, velocity components, or high column density, which accentuates the high velocity tails of the particle distribution.
Because we interpret the Mg II and Fe II absorption as occurring in three distinct components, we should assume three components when setting limits on Fe I absorption. We impose a 3 limiting equivalent width of 24 mÅ on an individual component of Fe I. It is possible that the smallest column detectable in a single component occurs at each of the three velocities, and that all three are undetected. Therefore the 3 upper limit on Fe I column density is 9 times the 1 limiting equivalent width. The strongest upper limit on (Fe I) is set by this limiting equivalent width applied to the strong Fe I 2484 line ( = 0.5569). We note that this method of setting the ionization balance holds independent of the explanation for the broad velocity structure of absorption discussed above because these explanations apply equally well to Fe I and Fe II.
Using the measurements and limits in Table 2.2, we construct two critical ionization ratios = N(Fe I) / N(Fe II) and = N(Mg I) / N(Mg II). From Mg I 2853 and Mg II 2804 we derive , and from Fe I 2484 and Fe II 2374 we infer . These ratios are used below (§ 4.1) to constrain the ionizing spectrum incident on the cloud. Our limit on depends on the ratio of total absorption in Fe I to the total absorption in Fe II, and to a lesser extent on the ratio of Mg I to Mg II. Because the ionization edges of Mg I and Fe I lie at 7.646 eV and 7.87 eV, respectively, these ratios are sensitive to the shape of the spectrum in the FUV band (Figure 5).
3 IONIZING RADIATION FROM NGC 3067
The narrow-band H images of NGC 3067 measure the total H photon emission rate from the galaxy NGC 3067, = s-1. If we assume, per case-B recombination theory, that these regions emit one H recombination photon per 2.4 ionizing photons at K (Osterbrock 1989), then the ionizing photon production rate of NGC 3067 is s-1. This result implies -2 photons cm-2 s-1 if the H II regions in NGC 3067 are assumed to be a point source and no opacity is included in the galactic disk or halo. We account for geometric effects by directly integrating the individual pixels in the image, attenuated by their projected distances from the quasar sightline. This method increases our estimate of the galactic ionizing flux by 5% but still does not account for the full ionizing flux in the unlikely event that the the edge-on disk of the galaxy is optically thick to H.
Stocke et al. (1991) used these same images to calculate an upper limit to the H emission from the cloud. From a simple, slab-geometry analytical photoionization model of the cloud, they derived photons cm-2 s-1. For a smooth spectrum, our measurement photons cm-2 s-1 and the Stocke et al. (1991) limit sets 0.02. Because the two numbers in the ratio derive from the same images, the errors in the ratio are dominated by statistical fluctuations in the image and not by calibration errors or systematic uncertainties associated with combining measurements by different instruments.
The inferred ionizing flux at the cloud due to the ionizing sources in the galaxy could dominate any extragalactic contribution at 8 kpc from the disk, were the galactic disk and halo transparent to ionizing radiation. It is known that galaxies exhibit Lyman breaks due to the opacity of H I in stellar atmospheres and in the galactic ISM. However, the fraction of Lyman continuum photons that escape galaxies and contribute to the extragalactic background, as parametrized by , is poorly constrained (see § 1). The limit is more stringent than those of Leitherer et al. (1995) and lies below the limits Hurwitz et al. (1997) inferred from reanalysis of the same data. Our robust upper limit on leaves open the possibility that the portion of the galaxy’s ionizing radiation that escapes the halo is negligible from the point of view of the absorbing cloud. The assumption that the cloud is illuminated by a purely extragalactic spectrum permits a lower limit to the intensity of the ionizing radiation field, as discussed below in § 4.
4 PHOTOIONIZATION MODELS OF THE ABSORBING CLOUD
Detailed photoionization models permit comprehensive exploration of the effects of various ionizing continua and total ionizing fluxes on a model cloud that can be compared against the observations. An optically thin photoionization model fails to describe this cloud accurately and to predict the ionization balance of its metals, in large part because there is no easy way to predict a priori the electron fraction in the cloud. The cloud has a hydrogen column density sufficient to shield its interior from radiation at eV, so that a treatment of radiative transfer within the cloud is necessary to predict metal-line ratios. As a result, we simulated the extended H I halo of NGC 3067 with the Cloudy code from G. Ferland (version 90.04, Ferland 1996).
In all cases, the model cloud was a plane-parallel slab of thickness 6.5 kpc, consistent with the angular size of the cloud set by the limiting column density contour at cm-2 from Carilli & van Gorkom (1992). The model was integrated in depth from its illuminated face until the column density of neutral hydrogen reached the peak value cm-2, measured by Carilli & van Gorkom (1992). In all models, the total hydrogen density was assumed constant and was varied to produce the observed within a physical size comparable to . The assumption that the cloud is illuminated from one side is consistent with both of the models proposed: either the cloud is illuminated by a purely extragalactic radiation field and is shielded from the galaxy by the inner halo gas and dust, or the nearby galaxy dominates the spectrum between 912 – 1600 Å and the extragalactic contribution is negligible. Only the shape and intensity of the continuum varies between models.
Because the ionization edges of Mg I and Fe I lie at 7.65 eV and 7.87 eV, respectively, radiation at energies between 0.56 and 1.00 Ryd strongly influences the calculated ionization ratios. We employ two generic spectra to explore the dependence of the ionization ratios and on the extragalactic UV radiation (Figure 5). One of these assumes a continuous power-law spectrum representative of extragalactic radiation dominated by AGN (§ 4.1). The other assumes that local and possibly integrated galactic contributions are important and contains a jump at the H I ionization threshold (§ 4.2).
We employ five constraints on the model cloud and its incident radiation field. The ionization ratios and are highly sensitive to FUV radiation shortward of 1600 Å at the cloud. We use the critical value to constrain the FUV background as well as the extragalactic ionizing background . The constraint is satisfied by all models that meet the constraint. The measured column of the Mg I 2853 lines constrains the total FUV flux between 912 – 1600 Å, and with an assumption of , this line can be used to constrain the 13.6 eV break in the spectrum. The observed and constrain the size and density of the model clouds.
4.1 Models with Continuous Power-law Spectra
The case of a purely extragalactic background is the simplest limiting class of model that can account for the ionization ratios in the absorbing halo cloud. This model assumes that the cloud is shielded from the ionizing radiation of the galaxy and that the extragalactic background is composed of AGN spectra in the power-law form given by Zheng et al. (1997). This composite spectrum has a spectral index shortward of 1050 Å, while the index changes to for 1050 Å. While this spectrum can be taken as the best available representation of the QSO-dominated extragalactic spectrum, we modify it in two ways to include the possibility that the power-law is dominated by normal galaxy contributions. First, we move the knee where changes from 1050 Å to 912 Å. In practice this change is unnoticeable in the ionization ratios. Second, we include a break at the Lyman limit in some models, as discussed in § 4.2.
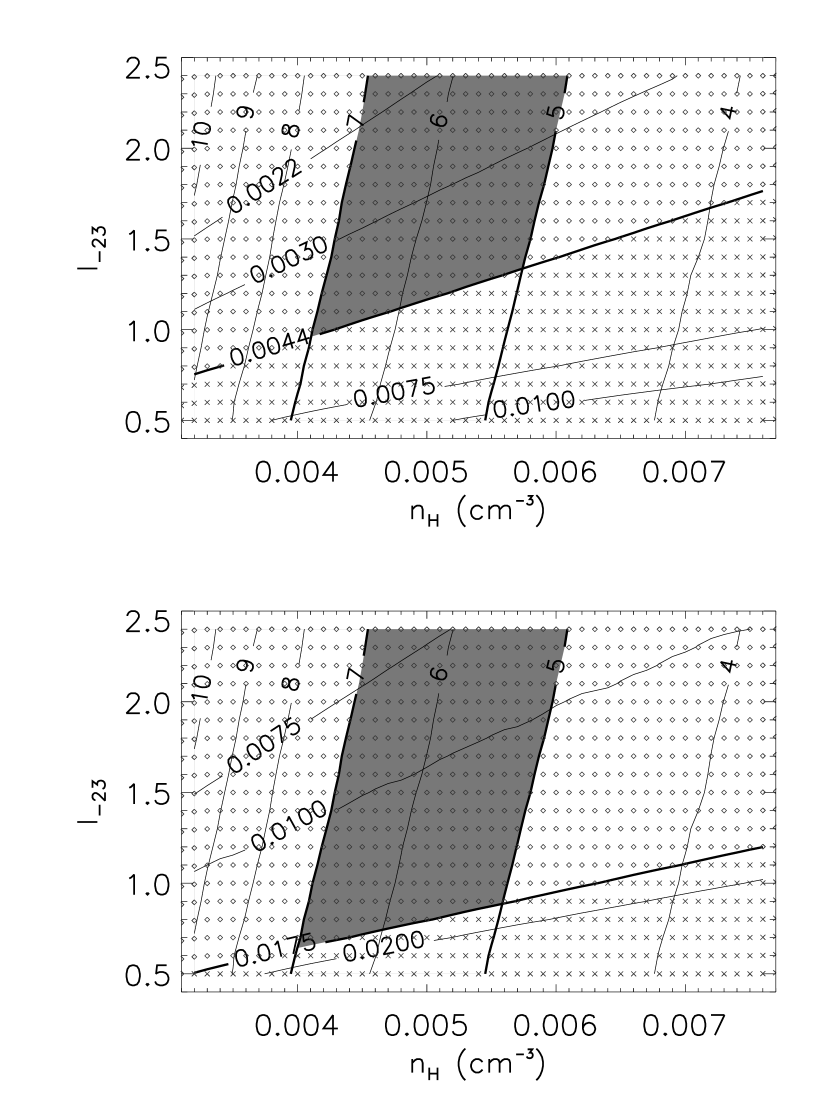
For a suite of model clouds illuminated by the modified composite QSO spectrum, the input values of and were varied to produce a contour plot of the parameter space (Figure 6). The contours represent constant values of the ratios or . The tightest constraint on is the contour , set by the ratio of the tightest upper limit on N(Fe I) to N(Fe II) from Fe II 2374. We take the acceptable range of parameter space to be the shaded area, based on our limits on and the apparent diameter 6.5 kpc of the cloud from the H I emission map of Carilli & van Gorkom (1992). Because the Mg II 2796,2804 lines are highly saturated, the constraint on is satisfied by all models that meet the constraint.
This constant-density model requires that 2600 cms-1 and for . We judge models in the parameter space to be acceptable if they lie above the contour corresponding to the critical value of . Sources of uncertainty in the ratio, and therefore in the contours, are discussed below (§ 4.3).
Our limit is lower than all the upper limits on imposed by measurements and non-detections of H (Vogel et al. 1995; Donahue et al. 1995; Stocke et al. 1991; Kutyrev & Reynolds 1989), and it falls near the lower end of estimates of from H I galactic disk edges (Maloney 1993; Dove & Shull 1994). Our limit lies within the large range of derived by Kulkarni & Fall (1993) from the Ly forest proximity effect at = 0.5. However, direct comparison of our limit to these previous measurements is valid only in the case that the local contribution of NGC 3067 is negligible. If is dominated by the ionizing radiation from the galaxy, the extragalactic ionizing background cannot be constrained.
Although the cloud appears to have a roughly spherical profile when seen in projection, we have no reason to expect that it has any particular density profile. Indeed, a spherical cloud of constant density exhibits enhanced column density near its projected center. Furthermore, in this case, uncertainties in the density profile are dominated by the larger uncertainty about the source of the ionizing radiation. Because centrally condensed models require higher values of to match the observed and , our lower limit is not sensitive to the assumed profile. The limit is also insensitive to density clumps that may lie hidden in VLA maps with 50′′ resolution. Because we cannot constrain the size and filling factor of these clumps, and given the relative insensitivity of our limit on to this subtlety, more complicated models are unjustified.
4.2 Models with Lyman Breaks
The second class of models incorporate both QSO and starburst contributions to the ionization of the absorbing cloud. These models keep the power-law form of the spectrum but contain a “break” at 13.6 eV, such that the continuum longward of the Lyman limit is enhanced relative to the H-ionizing continuum. Recent theoretical work by Shull et al. (1999) demonstrates that if 0.05, the contribution from galaxies to the extragalactic ionizing background may match the empirically evaluated contribution of AGN. Because an intrinsic Lyman break is introduced by H I in stellar atmospheres and by the galactic ISM, galaxies may contribute far more to the extragalactic FUV (912 – 1600 Å) background than they add to the ionizing continuum. As a result, an incident spectrum with a break at 13.6 eV may represent the extragalactic radiation background better. This is particularly relevant for and . The same general argument for a Lyman break may be applied specifically to the contribution to the incident radiation by the local starburst galaxy NGC 3067. We return to this point below.
Figure 5 illustrates the schematic spectra we assume are incident on the model cloud. The solid curve represents the minimum level of the ionizing background from § 4.1 required to satisfy the limits on and . If the flux at energies below 1 Ryd is enhanced by at least a factor of two over that of the ionizing spectrum, the observational constraints and N(Mg I) may be satisfied independent of the level of ionizing radiation by appropriate choice of FUV flux.
Figures 7 and 8 illustrate the use of the quantities and to represent the levels of incident radiation just longward and just shortward of the Lyman limit, respectively. Although there is likely not a pure step function break in the spectrum at the Lyman limit, these quantities schematically represent overall levels of FUV (912 – 1600 Å) radiation () and H-ionizing radiation (). As Figure 7 shows, if , constraints on are satisfied independent of , and, by implication, independent of . A similar conclusion holds for N(Mg I). Figure 8 shows the levels of and allowed by the N(Mg I) constraint. If is assumed, the allowed values can be expressed in terms of an allowed “break” in the ionizing spectrum.
If we fix 2600 photons cm-2 s-1, we can vary the flux longward of 912 Å until the Mg I line in the model cloud is no longer observable. For this calculation, we assume a 3 lower limit on N(Mg I) cm-2 and no depletion. The greatest break that accommodates the presence of Mg I absorption is a factor 150, assuming the same range of densities as in Figure 6. Figure 8 shows contours of constant N(Mg I) in the model cloud for a varying break. The bold contour represents the minimum measured N(Mg I); thus, for photons cm-2 s-1, and the break is constrained to . Higher breaks are of course permissible for vanishing , and they do not violate the constraint (Figure 7).
Direct measurements of the extragalactic FUV background longward of 912 Å are very difficult, due to the need to subtract out local contributions to the observed radiation (Bowyer 1991; Henry 1991; Witt et al. 1997). In general, these highly uncertain estimates are consistent with an upper limit to the break of order 200 – 300, assuming 2600 photons cm-2 s-1. Armand et al. (1994) suggest an integrated contribution from galaxies at 2000 Å consistent with a break of 50 – 150, again assuming 2600 photons cm-2 s-1. The presence of Mg I in the NGC 3067 cloud is compatible with these estimates of the extragalactic FUV background.
It is more difficult to argue that the local 912 – 1600 Å contribution of NGC 3067 may be neglected than it is to dismiss its contribution to the ionizing radiation incident on the cloud. Our limit on the escape of ionizing photons becomes weaker for these lower-energy photons. As Sutherland & Shull (1999) show, synthetic starburst spectra have breaks in flux at 13.6 eV of for young starbursts, and for evolved ones. This result implies upper limits on the break due to NGC 3067 of even before considering the enhanced escape probability of photons in this energy range. In the opacity model of Deharveng et al. (1997), the local contribution of ionizing photons by NGC 3067 may arguably be neglected, but the neutral hydrogen required to account for the Lyman continuum opacity does not impede the escape of FUV photons, so that NGC 3067 may produce a break of . The geometric scenario for is compatible with the inclusion of opacity, such as dust, which can also limit the escape of FUV photons. If dust is the primary source of FUV and LyC opacity, because , an optical depth across the 912 – 1600 Å band is required. Using a standard selective extinction curve (Seaton 1979) and assuming that continues to increase shortward of 1040 Å, we derive the limit mag, where the upper limit is due to the uncertainty in the exact form of the extinction curve shortward of 1000 Å. For the derived limit photons cm-2 s-1 we obtain an upper limit to the V-band dust extinction mag. Thus, dust opacity could contibute significant FUV opacity and modest optical extinction and should be incorporated into either formal model of .
If the photons longward of 912 Å escape largely unimpeded from NGC 3067, the presence of Mg I absorption implies that the gas associated with it must approach density cm-3, assuming that the Mg is present at solar metallicity. At these densities, depletion may become significant, further increasing the constraints on the density. In addition, assuming that the opacity model of is the more accurate description, the emergent spectrum should be significantly hardened shortward of the Lyman limit by the thick layer of H I that enshrouds the galactic disk. Our photoionization modeling reveals that the indicator ratios and are insensitive to this hardening. However, the C II / C IV and Si IV / C IV ratios in the model cloud show moderate changes of 0.4 – 0.9 dex if the input spectrum is hardened by the thick H I disk in the opacity model.
4.3 Sources of Uncertainty in the Models
Both the local and extragalactic interpretations presented above are subject to uncertainties in the total amount of gas present in the 3C 232 cloud, the size of the cloud, and the shape of the ionizing continuum. It is possible that the peak column density in this cloud measured by Carilli & van Gorkom (1992) and assumed in all the cloud models discussed here is an underestimate of the actual amount of H I in this cloud. The original H I emission maps were produced at VLA in C array, with a 20′′ by 30′′ beam that was binned to 50′′ to improve signal-to-noise. If these observations suffered from beam dilution, the actual column at the position of the quasar may peak at a far higher value. Higher average values of the total hydrogen density , provided by a higher column density or by clumping, would increase the lower limit on . These changes effectively rule out the regions of parameter space shown above for all larger columns of H I and for centrally condensed density profiles. For example, a column cm-2 requires that twice the gas be accommodated within the same physical size, such that the diameter contours in Figure 6 shift to the right and the limit becomes photons cm-2 s-1.
For the case of purely extragalactic ionizing radiation, our limits are insensitive to changes in the slope of the ionizing continuum. The limit 2600 photons cm-2 s-1 changes by roughly 10% for changes in from 1.5 to 2.1 (Zheng et al. 1997). Because we rely exclusively on the ratios of different ions of the same elements, our limits are not sensitive to the abundance or depletions of these elements in the cloud.
Of course, the greatest uncertainty in these models is the unknown contribution of the nearby galaxy, NGC 3067, to the ionization of the halo cloud. As discussed above, we can reasonably assume that little H-ionizing flux reaches the cloud. However, the apparent lack of opacity in the 7.6 – 13.6 eV range makes the metal-ionizing radiation field emergent from the cloud potentially important. Only a dust component in the disk and halo of the galaxy would prevent these photons from escaping the disk. Thus, the uncertainties of selective extinction in the far-UV are more important than modest upper limits to AV.
5 DISCUSSION AND CONCLUSIONS
Our absorption line spectra, narrow-band images, and extensive photoionization modeling of the 3C 232/NGC 3067 system allow us to limit the ionizing flux at the cloud to photons cm-2 s-1 if the ionizing spectrum is continuous. This limit is consistent with non-detections of H from intergalactic H I clouds, which provide upper limits to that are 4 times higher than the lower limit derived here. However, this model requires a small and a substantial FUV opacity to attenuate photons capable of ionizing Fe I and Mg I. Our limit is derived from stringent 3 upper limits to the column density of Fe I and a conservative interpretation of the velocity structure observed in Mg I, Mg II, and Fe II. If this limit is relaxed from 3 to 2 in each undetected Fe I component then 4300 photons cm-2 s-1. Similary, if we assume only two undetected components corresponding to the two seen in the Mg I line, then 4300 photons cm-2 s-1. Thus the assumed limits on Fe I produce a very conservative limit on .
If NGC 3067 contributes significantly to the ionizing flux at the absorbing cloud, then strict constraints on the extragalactic radiation field are impossible and we are left with the robust limit on total given by the H images. The limit is significantly lower than previous measurements, but is consistent with theoretical treatments of escaping ionizing radiation. However, these two models predict radically different , and so should manifest themselves in distinct fashion. The opacity model proposed by Deharveng et al. (1997) predicts through a thick, uniform layer of H I. Because this model relies exclusively on H I opacity, it predicts harder galactic spectra than the geometric model (Dove & Shull 1994; Dove et al. 1999). This difference may appear in the C II / C IV and Si IV / C IV ratios in clouds ionized by hardened galactic spectra. We note that the currently small sample of galaxies for which limits on have been obtained is not sufficient to allow these results to be generalized to all galaxies, or even to all starburst galaxies. An ensemble average taken from a larger sample of targets with varying morphology, viewing geometry, and star formation history is necessary before a reliable general estimate of can be made. Further steps in this direction will be taken by the FUSE satellite, which will observe two low-redshift starbursts shortward of the rest-frame Lyman limit in an attempt to measure directly.
There are several ways in which future HST observations (with STIS or COS) could resolve existing unknowns in this system. In addition to estimating the extragalactic spectral index in the LyC, UV observations of C IV and Si IV with HST/STIS would determine the overall ionization state of the gas and probe the existence of a hot, collisionally ionized component.
Due to the beam dilution mentioned above, the measurement cm-2 may be an underestimate of the total amount of H I present. If so, then this absorber is potentially a damped Lyman (DLA) system of very low redshift (). High- DLAs are commonly believed to arise in thick, extended H I disks (Wolfe et al. 1995). A key element of this picture is that the large neutral disks detected as high- DLAs have evolved without merging. This view has been disputed by the theoretical simulations of Haehnelt et al. (1998), who argue that DLAs arise in irregular merging protogalactic clumps. The NGC 3067 cloud, if it is a DLA, would suggest that these objects can also arise, at least at low redshift, in interacting systems. A STIS/FUV observation of the cloud’s Ly absorption profile along a pencil-beam line of sight would not be subject to either the 21-cm absorption bias or beam dilution, and would allow the absorber to be firmly classified.
Finally, a STIS/G140L () spectrum could measure many key abundances (S, Si, C, O, and Ni). These metal lines should follow a linear curve of growth, as do the metal lines in the NGC 3067 cloud presented here. Based on the numerical models presented here, FUV lines of S II at should easily be detectable, as should lines of Si II. The total column density of S II would constrain the overall metallicity of the cloud (S and Zn are nearly undepleted in low-density gas, but Zn II in this cloud is too weak to be detected). Based on the observed N(Fe II), a high signal-to-noise measurement of the weak NUV lines of Fe II could, if unsaturated, improve our limits on .
Our major results can be summarized as follows:
-
•
For an extragalactic power-law spectrum with we infer 2600 photons cm-2 s-1 and erg cm-2 s-1 Hz-1 sr-1.
-
•
Measurements of the ionizing flux from the galaxy NGC 3067 and H limits on the ionizing flux at the cloud constrain 0.02, independent of and .
-
•
If the incident spectrum is assumed to contain a break at the Lyman limit, our detection of Mg I requires that the break be less than for photons cm-2 s-1.
References
- (1)
- (2) Armand, C., Milliard, B., & Deharveng, J.-M. 1994, A&A, 284, 12
- (3) Bergeson, S. D., Mullman, K. L., Wickliffe, M. E., Lawler, J. E., Litzen, U., Johansson, S. 1996, ApJ, 464, 1044
- (4) Bland-Hawthorn, J., & Maloney, P. R. 1999, ApJ, 510, L33
- (5) Bowyer, S. 1991, ARA&A, 29, 59
- (6) Bruhweiler, F. C., Kafatos, M., & Sofia, U. J. 1986, ApJ, 303, L31
- (7) Carilli, C. L., & van Gorkom, J. H. 1992, ApJ, 399, 373
- (8) Deharveng, J.-M., Faisse, S., Milliard, B., & Le Brun, V. 1997 A&A, 325, 1259
- (9) De La Pena, M. D., & Soderblom, D. R. 1997, GHRS Instrument Science Report No. 84
- (10) Donahue, M., Aldering, G., & Stocke, J. T. 1995, ApJ, 450, L45
- (11) Dove, J. B., & Shull, J. M. 1994, ApJ, 423, 196
- (12) Dove, J. B., Shull, J. M., & Ferrara, A. 1999, ApJ, submitted
- (13) Fardal, M. A., Giroux, M. L., & Shull, J. M. 1998, AJ, 115, 2206
- (14) Ferland, G. J. 1996, Hazy, A Brief Introduction To Cloudy, University of Kentucky Department of Physics and Astronomy Internal Report
- (15) Giallongo, E., Fontana, A., & Madau, P. 1997, MNRAS, 289, 629
- (16) Haardt, F., & Madau, P. 1996, ApJ, 461, 20
- (17) Haehnelt, M.G., Steinmetz, M., & Rauch, M. 1998, ApJ, 495, 647
- (18) Henry, R. C. 1991, ARA&A, 29, 89
- (19) Hewitt, A., & Burbidge, G. 1993, ApJS, 87, 451
- (20) Hurwitz, M., Jelinsky, P., Dixon, W. van Dyke 1997, ApJ, 481, L31
- (21) Jannuzi et al. 1998, ApJS, 118, 1
- (22) Kulkarni, V. P., & Fall, S. M. 1993, ApJ, 413, L63
- (23) Kutyrev, A. S., & Reynolds, R. J. 1989, ApJ, 344, L9
- (24) Leitherer, C., Ferguson, H. C., Heckman, T. M., & Lowenthal, J. D. 1995, ApJ, 454, L19
- (25) Madau, P., & Shull, J. M. 1996, ApJ, 457, 551
- (26) Maloney, P. 1993, ApJ, 414, 41
- (27) Morton, D. C. 1991, ApJS, 77, 119
- (28) Osterbrock, D. E. 1989 Astrophysics of Gaseous Nebulae and Active Galactic Nuclei (San Francisco: University Science Books)
- (29) Seaton, M. J. 1979, MNRAS, 187, 73
- (30) Sembach, K. R., & Savage, B.L. 1992, ApJ, 83, 147
- (31) Shull, J. M., Roberts, D., Giroux, M. L., Penton, S., & Fardal, M. 1999, AJ, 118, in press
- (32) Stocke, J. T., Case, J., Donahue, M., Shull, J. M., & Snow, T. P. 1991, ApJ, 374, 72
- (33) Sutherland, R. S., & Shull, J.M. 1999, in preparation
- (34) Vogel, S. N., Weymann, R., Rauch, M., & Hamilton, T. 1995, ApJ, 441, 162
- (35) Witt, A. N., Friedmann, B. C., & Sasseen, T. P. 1997, ApJ, 481, 809
- (36) Wolfe, A.M., Lanzetta, K.M., Foltz, C.B., & Chaffee, F.H. 1995, ApJ, 454, 698
- (37) Zheng, W., Kriss, G. A., Telfer, R. C., Grimes, J. P., & Davidsen, A. F. 1997, ApJ, 475, 469


| Setting | Archive | Wavelength | Date | Exposure | Species |
|---|---|---|---|---|---|
| Identification | Coverage (Å) | Time (s) | Detected | ||
| 1 | Z2YX0104P | 2836-2880 | 6/12/96 | 11097.6 | Mg I |
| 2 | Z2XY0106P | 2782-2828 | 6/12/96 | 10744.0 | Mg II |
| 3 | Z2YX0204M | 2578-2624 | 4/9/96 | 8976.0 | Fe II |
| 4 | Z2YX0206P | 2340-2388 | 4/9/96 | 12892.8 | Fe II, CIV |
| 5 | Z2YX0304T | 2488-2534 | 3/21/96 | 10472.0 | Fe I (limits) |
| Rest | Observed | Observed | Equivalent | Oscillator | Column | ||
|---|---|---|---|---|---|---|---|
| Identification | Setting | Wavelength | WavelengtheeObserved wavelengths and velocities correspond to the centroid of the absorption for unsaturated lines and to a velocity range for saturated lines. | Velocity | Width | StrengthccIron oscillator strengths are experimental measurements from Bergeson et al. (1996). All others are from the compilation by Morton (1991). | Density |
| (Å) | (Å) | (km s-1) | (mÅ) | (cm-2 ) | |||
| Mg I 2853 | 1 | 2852.96 | 2865.96 | 1370/1420 | 280 | 1.83 | (2.1)1012 |
| Mg II 2796 | 2 | 2796.35 | 2809.90 | 1300-1600 | 2910 | 0.6123 | (6.9)1013 |
| 2 | 2796.35 | 2811.50 | 1617 | 290 | 0.6123 | (6.7)1012 | |
| Mg II 2802 | 2 | 2803.53 | 2817.05 | 1300-1600 | 2600 | 0.3054 | (1.2)1014 |
| 2 | 2803.53 | 2818.63 | 1620 | 150 | 0.3054 | (7.1)1012 | |
| Fe II 2586 | 3 | 2586.65 | 2598 | blendddFe II 2586 observed at the velocity of NGC 3067 is blended with Galactic Fe II 2600 absorption. | 2070 | 0.06457 | |
| Fe II 2600 | 3 | 2600.17 | 2612.77 | 1453 | 2050 | 0.2239 | (1.5)1014 |
| Fe II 2344 | 4 | 2344.21 | 2355.53 | 1448 | 1310 | 0.1097 | (2.5)1014 |
| Fe II 2374 | 4 | 2374.46 | 2385.94 | 1450 | 840 | 0.0313 | (5.4)1014 |
| Fe I 2484 | 5 | 2484.02 | 24bbLimiting equivalent widths correspond to 3 features. | 0.5569 | 8.01011 | ||
| Fe I 2502 | 5 | 2501.89 | 24bbLimiting equivalent widths correspond to 3 features. | 0.04963 | 8.81012 |