A spatially resolved ‘inside-out’ outburst of IP Pegasi
Abstract
We present a comprehensive photometric dataset taken over the entire outburst of the eclipsing dwarf nova IP Peg in September/October 1997. Analysis of the lightcurves taken over the long rise to the peak-of-outburst shows conclusively that the outburst started near the centre of the disc and moved outwards. This is the first dataset that spatially resolves such an outburst. The dataset is consistent with the idea that long rise times are indicative of such ‘inside-out’ outbursts. We show how the thickness and the radius of the disc, along with the mass transfer rate change over the whole outburst. In addition, we show evidence of the secondary and the irradiation thereof. We discuss the possibility of spiral shocks in the disc; however we find no conclusive evidence of their existence in this dataset.
keywords:
novae, cataclysmic variables - stars: individual, IP Peg - physical data and processes: accretion, accretion discs - binaries: eclipsing - stars: white dwarfs - infrared: stars1 Introduction
IP Pegasi is a U-Gem type dwarf nova. It has an orbital period of 3.8 hours and an average outburst cycle length of about 95 days. Being the brightest deeply eclipsing dwarf nova known with an orbital period above the period gap, it is an essential object to study, to understand the differences between long- and short-period systems.
From observations presented in this paper, the visible disc observed in IP Peg at the onset of the September-October 1997 outburst was small and grew over a couple of days (see Sections 3 & 5). This suggests that the peak-of-outburst occurs when the heating wave reaches its maximum distance from the white dwarf. A cooling wave then moves inwards at a slower rate, causing the visible part of the disc to decrease in radius and thereby the system declines from outburst. Thus we observed an inside-out outburst as described by Smak [Smak 1984], Ludwig & Meyer [Ludwig Meyer 1998] etc.
Recent work on IP Peg by Steeghs, Harlaftis & Horne [Steeghs, Harlaftis & Horne 1997] and Wolf et al [Wolf et al 1998], has shown the possibility that IP Peg contains tidal shocks (or spiral arms) within the disc. Their presence has been determined by Doppler tomography (Marsh & Horne 1988). Various lines in the visible spectra, such as H and He I (6678) are mapped from time-resolved spectra, from which the velocity field is deduced and displayed on maps where the primary’s velocity coordinates are defined to be the origin. Such shocks have been discussed theoretically by e.g. Sawada, Matsuda & Hachisu [Sawada, Matsuda & Hachisu 1986], Savonije, Papaloizou & Lin [Savonije, Papaloizou & Lin 1994], Spruit et al [Spruit et al 1987] and Dgani, Livio & Regev [Dgani, Livio & Regev 1994]. They are tidally induced by the secondary star and should therefore be evident as the disc approaches the tidal radius, which IP Peg can be seen to do during this outburst. The perturbations become coherent spiral shocks, which extend from the outer disc down to quite small radii, depending on the Mach number of the disc flow. These arms are hypothesised to provide the removal of angular momentum required to allow material to be able to fall onto the white dwarf. This then disposes with the need for a disc viscosity, prescribed in the Disc Instability Model, e.g Meyer & Meyer-Hofmeister [Meyer & Meyer-Hofmeister 1982], Faulkner, Lin & Papaloizou [Faulkner, Lin & Papaloizou 1983] etc. We find no unequivocal evidence that spiral shocks existed in the disc during this outburst, though we discuss this further in Section 6.4.
2 Observations and data reduction
The September - October 1997 outburst of IP Peg was observed in the V band at several sites. The observations are outlined in Table 1 and details of most of the instruments used are given in Ioannou et al (1999), henceforth Paper I. The other instruments used were a 0.4m classical Cassegrain reflector with a CCD camera, at Braeside Observatory, Arizona, and a 0.81m, f/4 Newtonian reflector, fitted with a ST-6B CCD camera, at Stull Observatory, New York State (N. Y. S.). We also observed the 1994 December outburst with UKIRT and IRCAM-3.
| Date | Ecl- | BDJD | Site | Int. | Cycle |
|---|---|---|---|---|---|
| (1997) | ipse | (2450710+) | time(s) | time(s) | |
| Sep 21 | 4519 | 3.451259 | Keele | 10 | 13 |
| 4520 | 3.609384 | Keele | 10 | 13 | |
| Sep 22 | 4525 | 4.400453 | Keele | 3 | 7 |
| 4525 | 4.400453 | Essex | 15 | 20 | |
| 4525 | 4.400453 | Dorset | 20 | 122 | |
| 4526 | 4.558647 | Keele | 3 | 7 | |
| Sep 23 | 4531 | 5.349651 | Keele | 3 | 6 |
| Sep 24 | 4538 | 6.457649 | Dorset | 20 | 122 |
| Sep 27 | 4557 | 9.462988 | Keele | 3 | 6 |
| Sep 28 | 4558 | 9.620064 | N. Y. S. | 10 | 13 |
| 4559 | 9.779402 | N. Y. S. | 10 | 13 | |
| Sep 30 | 4571 | 11.51671 | N. Y. S. | 10 | 13 |
| Oct 01 | 4582 | 13.41814 | Keele | 3 | 6 |
| Oct 01 | 4582 | 13.41814 | Essex | 15 | 20 |
| Oct 02 | 4585 | 13.73463 | N. Y. S. | 10 | 13 |
| Oct 02 | 4588 | 14.36743 | Keele | 3 | 5 |
| Oct 05 | 4607 | 17.37332 | Keele | 3 | 5 |
| Oct 06 | 4608 | 17.53160 | N. Y. S. | 10 | 13 |
| 4609 | 17.68989 | N. Y. S. | 10 | 13 | |
| 4609 | 17.68989 | Braeside | 60 | 71 | |
| 4610 | 17.84792 | N. Y. S. | 10 | 13 | |
| 4610 | 17.84792 | Braeside | 60 | 71 | |
| Oct 07 | 4616 | 18.63793 | Braeside | 60 | 71 |
| 4617 | 18.80035 | Braeside | 60 | 71 | |
| Oct 25a | 4734 | 37.46551 | Keele | 10 | 13 |
a quiescent observation
The optical photometry was reduced as described in Paper I, the local standard stars being those of Misselt (1996). We checked for differences in the colour response of the V band filters between different telescopes by comparing simultaneous eclipse data, since the star’s colour changes most dramatically through eclipse. Deviations were within a few percent for the Keele-Essex-Dorset observations and to within a percent for the N. Y. S.-Braeside datasets. The UKIRT data were reduced as described in Beekman et al [Beekman et al 1997]. The conversion to apparent magnitude was carried out from observations of two UKIRT standards. The lowest signal-to-noise of any data point presented in this paper is 40, hence we are confident that the data presented are of a high quality. The data were folded on the ephemeris of Beekman et al (1998);
| (1) |
Mid-eclipse is known to wander with respect to a linear ephemeris of up to 300 s on timescales of 5000 cycles [Wolf et al 1993].
3 The rise to outburst - ‘inside-out’
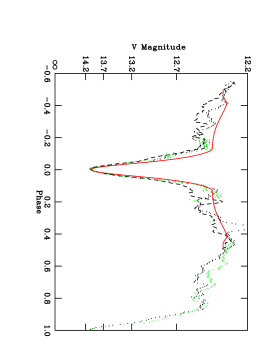
The main result of this paper, that the outburst was ‘inside-out’, can be ascertained by consideration of Figs. 1 and 2; although we shall show this in a more quantitative way in Section 6. The primary evidence is the eclipse depth, which decreases from 3.5 magnitudes in the first observations, to less than 2 magnitudes at the peak-of-outburst. At the onset, there is little residual flux at mid eclipse, implying that the secondary eclipses almost all the visible disc, with the small residual flux probably coming from the secondary star 111The first and quiescent eclipses are very similar in magnitude, indicating that the system was observed from the very beginning of outburst (Fig. 2f). Also the rapid rise in flux can be seen in the out-of-eclipse region (Fig. 3) in this initial stage.. By the peak-of-outburst, the larger residual flux at mid-eclipse suggests that the accretion disc has grown and become visible around the limb of the secondary.
Further evidence for an ‘inside-out’ outburst comes from the changes in eclipse morphology. The first eclipse has a flat bottom, indicating that the object eclipsed is compact; see Figs. 2a and 3. Even at the very start of outburst, the bright spot is not very evident. The early eclipses are similar in width to the quiescent white dwarf eclipses, indicating the visible disc is not large at this stage, compared to the secondary. However, the ingress and egress of the eclipses from the beginning of outburst are not vertical (Fig. 2f), suggesting that the central object is not entirely point like. In contrast, eclipses then become slightly ‘V-shaped’ by the second night (Fig. 2b). By the peak-of-outburst they are V-shaped but much shallower and wider at the top (see Fig. 2c).


4 The decline from outburst
We can follow the decline from outburst using eclipses 4607-10 and 4616-17. In these, the bright spot reappears as a hump on the ingress and emerging from eclipse on the egress (Fig. 2d). The eclipses become flat-bottomed, narrower and deeper again (see Fig. 2d) and resume the form typical of an eclipsing dwarf nova light curve (e.g Wood & Crawford 1986), as IP Peg reaches quiescence (Fig. 2e). There are changes in the gradient on many of the eclipse ingresses. These probably mark the beginnings and ends of the disc, bright spot and the white dwarf ingress. The position of the first change in gradient, attributed to the disc, moves slowly towards mid-eclipse, indicating that the feature causing this gradient change is becoming more centrally condensed. There is a persistent step at around phase 0.973 (see Fig. 2d). This could be due to the white dwarf, as it is a very compact object of static size. There is, however, not always evidence for the white dwarf reappearing on the egress at a similar phase. Also the ‘disc’ egress is not always apparent, which makes the disc size difficult to estimate.


5 Modelling the eclipses
| Parameter | Value |
|---|---|
| Secondary pole temperature | 3100 K a |
| Gravitational darkening coefficient | 0.08 |
| Orbital period of the system | 13669.0128288 s |
| Mass of the primary | 0.9 M⊙ |
| Distance | 150 pc |
| q | 0.49 |
| Inclination | 82∘ |
arevised Martin, Jones & Smith, 1987 (only V band modelled)
To carry out further analysis of the outburst lightcurves, we attempted to model them with the code described in Paper I. This code models the outburst lightcurves of dwarf novae. We used it with the parameters given in Table 2 fixed, to derive the parameters given in Table 3. One very important result found from modelling these outburst eclipses, is that they are of a very different form to many other dwarf novae outburst eclipses e.g. OY Car [Rutten et al 1992] where the eclipses in outburst are very symmetric from onset of the outburst. This unusual outcome is further explained in this section and the following discussion section.
Various q values were tried between 0.34-0.60, in steps of 0.01 (where q=M2/M1). The inclination and q value of the system are related. Assuming that the secondary fills its Roche lobe, the duration of the eclipse of the white dwarf gives a constraint on the relative sizes of the two component stars and the angle of inclination (i) of the system to the line of sight [Bailey 1979]. The inclination can therefore be calculated from the q value and using a value of (the smallest value of the white dwarf eclipse) from Wood & Crawford [Wood & Crawford 1986]. For a q value of 0.39, i is required to be 84∘, q=0.49 to be i=82∘ and q=0.58, i is required to be 80∘. 0.390.05 [Catalán 1995] and 0.49 [Wood & Crawford 1986] gave comparable results. That of Marsh (1998), q=0.58, however, gave model fits with larger values than the lower q values. We used q=0.49 for all the modelling done in this paper.

| Date | Eclipse | r/RL1 | r/RL1 | r/RL1 | Mass transfer | Semi-opening | |||
|---|---|---|---|---|---|---|---|---|---|
| (1997) | no. | (max) | (graph) | (max) | (model) | through disc | angle (∘) | ||
| (graph) | (x10-9M⊙/yr) | ||||||||
| Errors: | 0.001 | 0.001 | 0.002 | 0.002 | 5% | 10% | 20% | ||
| Sep 21 | 4520 | 0.082 | 0.102 | 0.375 | 0.577 | 0.357 | 0.85 | 18 | |
| Sep 22 | 4525 | 0.102 | 0.112 | 0.563 | 0.650 | 0.481 | 2.75 | 16 | |
| Sep 23 | 4531 | 0.105 | 0.115 | 0.590 | 0.674 | 0.595 | 6.95 | 15 | |
| Sep 27 | 4557 | 0.114 | 0.131 | 0.662 | 0.793 | 0.64 | 8.00 | 15 | |
| Sep 28 | 4559 | 0.122 | 0.147 | 0.722 | 0.889 | - | - | - | |
| Oct 01 | 4582 | 0.084 | 0.092 | 0.400 | 0.472 | - | - | - | |
| Oct 02 | 4585 | 0.103 | 0.106 | 0.580 | 0.608 | 0.64 | 4.69 | 14 | |
| Oct 06 | 4608 | 0.093 | 0.098 | 0.482 | 0.528 a | - | - | - |
The stream impact region (bright spot) manifests itself as a dark spot during outburst [Naylor et al 1987]. This can be seen in Fig. 5, eclipse 4558 (typical of other eclipses), where the ingress gradient is less steep initially. As the cooler region passes through the line of sight, it covers the central hot part of the disc, thus less flux is observed at this point, hence the eclipse begins earlier and is more gradual, giving an asymmetric profile.
The eclipses could be fit in depth and breadth, but on both the ingress and the egress, the fit deviated from the data systematically, where the eclipse shape was irregular, in part due to the bright/dark spot. Owing to the poor fit, the 2 values given by the model are much larger than 1 and so appear inappropriate for testing the validity of the fit (Fig. 7). However, they are still useful in pointing us towards the better fits of the model to the data. The disc radius and opening angle have large errors, as there is a ‘trade-off’ between the two quantities when fitting the model. The data can be fitted with a smaller radius and a thicker disc, or a larger but thinner disc. However, by fitting the data with two models that fit just below and just above the eclipse data points, we estimated the errors given in Table 3. The results show a general trend of the disc radius and mass transfer rates throughout the outburst.
To obtain a more consistent set of results regarding the change in radius of the luminous part of the disc, the first and last contact points were measured for each eclipse. The contact points were difficult to discern because of flickering, so the gradient between successive data points of the eclipse was plotted against phase, from which the contact points could be more easily distinguished. Hence the results can only be considered to be accurate to 0.001 in phase. The eclipse widths, in phase, are given in Table 3. is half the difference in phase from the first to the last contact point. (max) is the larger of the two phases between the first contact point and phase zero, or between phase zero and the last contact point. Table 3 shows that the width of the eclipse increases over the rise to outburst and decreases as the system declines from outburst. The asymmetry of the disc can also be seen. r/RL1 values are generally more extreme than the model values, as the model assumes a symmetric disc. However, both sets of results follow the same trend.
The radius of the disc can be estimated from the first and last contact points of the eclipse in the following way. The modelling code was used to create a model for discs of 0.2RL1, 0.4RL1, 0.6RL1 etc using a thin disc. The phase between the first and last contact points derived from the model lightcurve was plotted against the radius of the thin disc. The radius of the disc for each phase value measured was then read from the graph. The results of this are given in Table 3. This was the best method for deriving disc radius that we tested as it did not rely on an interdependency between the disc radius and opening angle and shows the assymmetry of the disc, which the model is unable to do. The same trend in disc size variation throughout the outburst was determined, as had been found from the modelling 222It should be noted, that if, at the end of outburst, only the final part of the ingress and the first part of the egress are associated with the disc, as described in Section 3, the disc size at the end-of-outburst is considerably smaller than given in the table, approaching the size of the white dwarf..
6 Discussion
6.1 Comparison with the disc theory
The disc theory asserts that long rise times, i.e. long compared with other outbursts of IP Peg, are indicative of inside-out outbursts. This is due to the rise time being related to the time taken by the heating front to traverse the disc. An outward moving front moves more slowly than an inward moving one, hence longer rise times. The outbursts of IP Peg exhibit a range of rise times. From the British Astronomical Association Variable Star Section (BAAVSS) database, we have estimated rise times for 13 IP Peg outbursts between November 1991 and January 1998. The rise time estimates fall into two categories of either less than two days (short rise time) or three days and more (long rise time). Since this outburst has a long rise time of about three days, it is consistent with the theoretical prediction that long rise times are associated with inside-out outbursts. The manner in which the disc is small at the beginning of outburst, compared to the tidal radius and then approaches the tidal radius value during the outburst, then slowly falling to the initial radius is consistent with previous analysis of IP Peg outbursts, e.g. Wolf et al (1993), although previously analysis has used no rise to outburst data, only the fact that the disc was small prior to outburst. This is in sharp contrast to a system showing ‘outside-in’ outbursts, e.g. HT Cas (Paper I), where the luminous part of the disc is initially large and then decreases in radius through the outburst.
6.2 Disc edge structure
The tidal radius of the system can be calculated by first finding RL1/a numerically, then using the equation of Paczynski [Paczynski 1977]. For a q value of 0.39, the tidal radius is 0.727 RL1 and for a q value of 0.49, the tidal radius is 0.705RL1. From modelling, the luminous disc radius is well below the tidal radius at the beginning of outburst and so we expect no tidal interaction between the secondary star and the disc.
At the peak-of-outburst, model values of the size of the accretion disc are within 0.05 RL1 of the tidal radius. However, this is the average size of the disc. The disc is highly asymmetric (see average and peak values of the first and last contact points in Table 4). By the peak-of-outburst at least some of the disc has reached the tidal radius and is presumably disrupted by the secondary star. This point in the outburst coincides with the maximum flickering observed in the light curves outside of eclipse, see Figs. 4 and 5 (the latter of which shows an early eclipse with little flickering (no. 4525) compared to a later one (no. 4558) from the middle of outburst. This could show that the disc edge has become disrupted at this point, as the disrupted edge has thicker and thinner regions. When a thicker part of the edge of the disc passes our line of sight, less of the hot central part of the disc is visible and so we receive less light (a dip in the light curve) and conversely for a peak in the lightcurve. Another possible explanation is that the flickering is due to matter being accreted onto the white dwarf in a clumpy fashion e.g. [Gotthelf, Patterson & Stover 1991]. The flickering in the non-eclipsed part of the light curve diminishes during the decline phase.
6.3 The secondary star
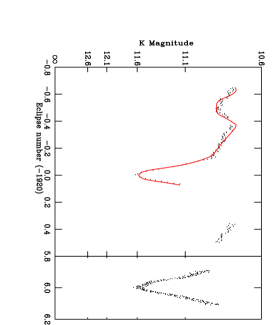
The secondary star is evident in both the V and K band data. The secondary eclipse is visible at phase 0.5 at the beginning of outburst in the V band (depth 0.05 mag.), when the disc has not brightenend sufficiently to outshine the secondary (see Fig. 3). The eclipse of the secondary star is also visible in the K band peak-of-outburst lightcurves, (Fig. 6), where it lasts 0.2 in phase and is 0.1 magnitudes deep. This is superimposed on a broad hump, centred on phase 0.5, which covers more than half the orbital cycle. We believe that this hump is due to the irradiated face of the secondary star, rotating into view.
To test this hypothesis, we modelled the effect of irradiation of the secondary star in both the K and V bands. We placed an irradiating source at the centre of the disc and modelled the luminosity required to reproduce the lightcurves in the K band, using the modelling code as in Section 5. The thickness of the disc caused some shadowing of the secondary, but the upper and lower parts of the inner face were irradiated (Somers, Mukai & Naylor, 1996 and Fig. 8). From this modelling we found that a luminosity of 10L⊙ must be irradiating the secondary. Such high luminosities are not generally known to emanate from white dwarfs (see Sion 1995); so it is highly unlikely to be coming from the white dwarf. From the mass transfer rates given in Table 3, accretion luminosities from the boundary layer, similar to the observed luminosity are produced. Thus the boundary layer is probably the source of irradiation.
To show that the irradiation model is consistent with the V band data, we fitted the averaged V band lightcurve from the peak-of-outburst, see Fig. 4. This was also well fitted with a luminosity of 10L⊙. In the V band model, the broad hump was also evident, superimposed over a small eclipse centered at phase 0.5. This eclipse of the secondary star is not evident in the peak-of-outburst data, as the flickering of 0.2 magnitudes is larger than the secondary eclipse. Thus we see evidence of the secondary star, both from its eclipse in the beginning of outburst data and the modulation due to its irradiated face. The irradiating source, probably the boundary layer, has a luminosity of 10L⊙.
The model of the out-of-eclipse V band lightcurve is almost horizontal as the disc comes out of eclipse (Fig. 4). It then shows a very slow rise until phase 0.2, when it increases much more quickly. This is because very little of the irradiated region of the secondary is visible until phase 0.12, so there is little increase in flux. At phase 0.16, both the upper and lower part of the irradiated face become visible, see Fig. 8. Of this, the hottest region becomes visible at phase 0.22. Then the upper and lower irradiated regions begin to contribute a significant amount of flux in the V band - hence the gradient of the lightcurve increases more rapidly. Although the secondary eclipse begins at phase 0.38, it is only evident at phase 0.41 in the V band, as this is when the irradiated regions of the secondary begin to be eclipsed. From modelling, the irradiated region on the secondary is as hot as all but the very central parts of the disc, hence its contribution to the lightcurve (Fig. 8).
6.4 Spiral arms
Although we have no spectroscopy of IP Peg, from which in previous analysis spiral shocks have been identified, we analysed the light curves as suggested by Bunk, Livio & Verbunt [Bunk, Livio & Verbunt 1990]. They suggest that light curves for optical data, where the spiral arms are in the orientation suggested by Steeghs, Harlaftis & Horne (1997), should show asymmetric eclipse profiles, with a steep ingress gradient and a shallow egress gradient and a mid-eclipse region between ingress and egress which is relatively flat, albeit with a small negative gradient. We found similarly formed ingress and egress gradients in this dataset, but without the flat bottom. However, this profile is not only observed for the eclipses at the peak-of-outburst, where the disc is thought to have reached the tidal radius, but in all other eclipses 333Similarly formed eclipses from other eclipsing Cataclysmic Variables can also be observed, where the eclipse shape is attributed to the bright spot, as pointed out by the referee. . The steep ingress and shallower egress are also typical of arms at orientations other than those postulated by Steeghs, Harlaftis & Horne (1997). However, it must also be remembered that these models [Bunk, Livio & Verbunt 1990] are for a thin disc and we have shown that the disc at peak-of-outburst is flared, to 15∘. In addition, further out-of-eclipse evidence should be observable. If the spiral arms exist and are orientated as described by Steeghs, Harlaftis & Horne (1997) centered around phases 0.25 and 0.75, then evidence of their presence should be observed at these points on the light curve. We folded five light curves (binned together to remove irregular structure in the out-of-eclipse region) from the peak-of-outburst (when the system has reached the tidal radius) and 5 lightcurves where the disc is much less than the tidal radius. We examined the resultant light curves, but found no evidence for features at these phases that could not be explained by the irradiated secondary.
What our data show is that from simple photometry only, the existence of spiral arms cannot be proved, although the data are not inconsistent with their existence. However, little work has been done to show how models of discs that rely only on spiral arms as their mode of transporting angular momentum outwards can go into outburst. It has not yet been proved that spiral arms would provide a viable mechanism to transport all of the angular momentum away in cooler and/or thick discs. In all models that have been produced, the method for transporting angular momentum away uses unrealistically hot discs (large speed of sound) and the cooling effect has been neglected [Livio & Spruit 1991]. Further supporting evidence is therefore required from both observation and theory in order to prove their existence. In contrast, our data can be entirely explained without the need for spiral arms, using the ‘inside-out’ disc instability model. This could question the need for spiral arms in the discs of dwarf novae.
7 Conclusions
We have shown that the outburst undergone by IP Peg in September 1997 was of the ‘inside-out’ variety. As part of this evidence, we show that the visible disc size grows in radius over the rise to outburst and then falls over the decline. From our modelling, due to large errors we cannot determine a trend in opening angle over the outburst, but the visible radius increases from about 0.5RL1 to 0.7RL1. The mass transfer rate also follows the same trend. After increasing from about 2.2x10⁻¹⁰M⊙yr-1 in quiescence [Marsh 1988], to 8.5x10⁻¹⁰M⊙yr-1 at the beginning of the outburst, it then reaches at least 8.0x10⁻⁹M⊙yr-1 at the peak of outburst. These values should be viewed with caution, as the errors are large, though they do show the trend in the data. The disc reaches the tidal radius around the peak-of-outburst and is highly asymmetric. We also show results that are consistent with the theoretical prediction that long rise times are features of ‘inside-out’ outbursts. We have shown evidence for the irradiation of the secondary star by the white dwarf and/or more likely the boundary layer. The irradiating luminosity is of the order of 10L⊙. We have, however, no evidence to support the idea that the disc contains spiral arms and we can fully explain our lightcurves using only the disc instability model.
8 Acknowledgements
We acknowledge the BAAVSS for use of their archive, TN was in recipient of a PPARC advanced fellowship during some of this work and NAW is supported by a PPARC studentship. We are also grateful to G. Beekman for helping us obtain data with UKIRT and for many informative discussions. The United Kingdom Infrared Telescope is operated by the Joint Astronomy Centre on behalf of the U.K. Particle Physics and Astronomy Research Council. We also acknowledge the amateur astronomers, who maintain the Keele telescope. The data reduction was carried out on the Keele STARLINK node using ARK software.
References
- [Bailey 1979] Bailey J, 1979, MNRAS, 187, 645
- [Bunk, Livio & Verbunt 1990] Bunk W., Livio M., Verbunt F., 1990, A&A, 232, 371
- [Beekman et al 1997] Beekman G., Shahbaz T., Naylor T., Charles P.A., Wagner R.M., Martini P., 1997, MNRAS, 209, 303
- [Beekman et al 1998] Beekman G., Somers M., Naylor T., Hellier C., 1998, MNRAS, in preparation
- [Catalán 1995] Catalán M.S, 1995, Ph.D. Thesis, University of Sussex
- [Dgani, Livio & Regev 1994] Dgani R., Livio M., Regev O., 1994, ApJ, 436, 270
- [Faulkner, Lin & Papaloizou 1983] Faulkner J., Lin D.N.C., Papaloizou J.C.B., 1983, MNRAS, 205, 359
- [Gotthelf, Patterson & Stover 1991] Gotthelf E., Patterson J., Stover R.J., 1991, ApJ, 374, 340
- [Horne & Cook 1985] Horne K., Cook M.C., 1985, MNRAS, 214, 307
- [Ioannou et al 1998] Ioannou Z., Naylor T., Welsh W.F., Catalán M.S, Worraker W.J., James N.D., 1999, MNRAS, Paper I
- [Livio & Spruit 1991] Livio M., Spruit H.C., 1991, A&A, 252, 189
- [Ludwig Meyer 1998] Ludwig K., Meyer F., 1998, A&A, 329, 559
- [Marsh 1988] Marsh T.R., 1988, MNRAS, 231, 1117
- [Marsh & Horne 1988] Marsh T.R., Horne K., 1988, MNRAS, 235, 269
- [Martin, Jones & Smith 1987] Martin J.S., Jones D.H.P., Smith R.C., 1987, MNRAS, 224, 1031
- [Meyer & Meyer-Hofmeister 1982] Meyer F., Meyer-Hofmeister E., 1982, A&A, 106, 34
- [Misselt 1996] Misselt K.A., 1996, PASP, 108, 146
- [Naylor et al 1987] Naylor T., Charles P.A., Hassall B.J.M., Bath G.T., Berriman G., Warner B., Bailey J., Reinsch K., 1987, MNRAS, 229, 183
- [Paczynski 1977] Paczynski B., 1977, ApJ, 216, 822
- [Rutten et al 1992] Rutten R.G.M., Kuulkers E., Vogt N., van Paradijs J., 1992, A&A, 265, 159
- [Savonije, Papaloizou & Lin 1994] Savonije G.J., Papaloizou J.C.B., Lin D.N.C, 1994, MNRAS, 268, 13
- [Sawada, Matsuda & Hachisu 1986] Sawada K., Matsuda T., Hachisu I., 1986, MNRAS, 219, 75
- [Smak 1984] Smak J., 1984, Acta Astron., 34, 161
- [Spruit et al 1987] Spruit H.C., Matsuda T., Inoue M., Sawada K., 1987, MNRAS, 229, 517
- [Steeghs, Harlaftis & Horne 1997] Steeghs D., Harlaftis E.T., Horne K., 1997, MNRAS, 290, L28-32
- [Wolf et al 1993] Wolf S., Mantel K.H., Horne K., Barwig H., Schoembs R., Baernbantner O. 1993, A&A, 273, 160
- [Wolf et al 1998] Wolf S, Barwig H, Bobinger A, Mantel K-H, Šimić D., 1998, A&A, 332, 984
- [Wood & Crawford 1986] Wood J.H, Crawford C.S., 1986, MNRAS, 222, 654
- [Wood et al 1989] Wood J.H, Marsh T.R, Robinson E.L, Stiening R.F, Horne K, Stover R.J, Schoembs R., Allen S.L., Bond H.E, Jones D.H.P., Grauer A.D, Ciardullo R., 1989, MNRAS, 239, 809