Plasma and Warm Dust in the Collisional Ring Galaxy VII Zw 466 from VLA and ISO Observations
Abstract
We present the first mid-infrared (Mid-IR) (5-15m) and radio continuum (20, 6 and 3.6 cm) observations of the star-forming collisional ring galaxy VII Zw 466 and its host group made with the Infrared Space Observatory111Based on observations with ISO, an ESA project with instruments funded by ESA Member States (especially the PI countries: France, Germany, the Netherlands and the United Kingdom) with the participation of ISAS and NASA. and the NRAO Very Large Array. A search was also made for CO line emission in two of the galaxies with the Onsala 20m radio telescope and upper limits were placed on the mass of molecular gas in those galaxies. The ring galaxy is believed to owe its morphology to a slightly off–center collision between an “intruder” galaxy and a disk. An off–center collision is predicted to generate a radially expanding density wave in the disk which should show large azimuthal variations in overdensity, and have observational consequences. The radio continuum emission shows the largest asymmetry, exhibiting a crescent-shaped distribution consistent with either the trapping of cosmic-ray particles in the target disk, or an enhanced supernova rate in the compressed region. On the other hand, the ISO observations (especially those made at 9.6m) show a more scattered distribution, with emission centers associated with powerful star formation sites distributed more uniformly around the ring. Low-signal to noise observations at 15.0m show possible emission inside the ring, with little emission directly associated with the H II regions. The observations emphasize the complex relationship between the generation of radio emission and the development of star formation even in relatively simple and well understood collisional scenarios.
Send off-print requests to P. N. Appleton e-mail: pnapplet@iastate.edu
1 Introduction
Collisions and interactions between galaxies provide a special opportunity for astronomers to study galaxies in non-equilibrium states (e.g. Schweizer 1997). Of particular interest are collisional systems which have well defined initial conditions and clear observational consequences. Models of “head-on” collisions, which began with the pioneering work of Lynds & Toomre (1976), and Toomre (1978) and have been extended considerably in both complexity and scope (see review by Appleton & Struck-Marcell 1996, Struck (1997)), fulfill those requirements. The radially expanding density waves driven into the disk of the “target” galaxy by such a collision, can not only explain the phenomenon of the collisional ring galaxy, as Toomre had originally suggested (the “Cartwheel” is perhaps the most well known example), but can also be useful as a means of exploring other aspects of the galactic disk affected by the compression of the ISM. In particular, in slightly off-center collisions, the expanding wave driven by the passage of the “intruder” through the disk can advance with greater strength in one direction than another, allowing for tests of such phenomena as star formation thresholds (see Appleton & Struck-Marcell 1987, Charmandaris, Appleton & Marston 1993) and studies of the compression of plasma–such as the cosmic-ray populations trapped in the disk.
We present radio continuum, Mid-IR and CO-line observations of a particularly well studied northern ring galaxy VII Zw 466, first discovered by Cannon et al. (1970). As we shall show, the radio continuum emission traces the thermal and non-thermal (relativistic) particles in the disk of the ring galaxy, whereas the Mid-IR emission highlights unusually warm dusty regions associated, most likely, with the neutral/molecular gas boundaries surrounding the powerful O/B associations found in the ring. The observations will underline the differences between the fluid-like components of the ISM (in this case the cosmic-ray “gas”) and the star-formation regions that have developed as a result of the compression by the radially expanding wave.
VII Zw 466 in one of the best studied northern rings (see Thompson & Theys 1978) and unlike its relative in the South, the “Cartwheel” (see Higdon 1993, 1996; Charmandaris et al. 1999a), it comprises of a single blue ring of star formation with no inner ring or obvious nucleus. VII Zw 466 was observed along with a small sample of other galaxies, as part of a major study of the star formation properties and metal content of northern ring galaxies (Marston & Appleton 1995, Appleton & Marston 1997, Bransford et al. 1998-hereafter BAMC). VII Zw 466 was also mapped with the VLA in the neutral hydrogen line and these observations provided information about the kinematics and dynamics of the cool gas in the ring galaxy and its nearby companions (Appleton, Charmandaris & Struck 1996, hereafter ACS). The H I observations suggested that the ring was formed by a collision between the progenitor of VII Zw 466 and a gas-rich dwarf spiral. A numerical model of the interaction was able to reproduce well the H I filaments extending from VII Zw 466, and a similar “plume” extending back from G2 towards the ring galaxy.
In this paper we present ISO Mid-IR, VLA radio continuum, and Onsala Space Telescope millimeter observations of VII Zw 466 and its inner group. In 2 we describe the details of the observations. In 3 we present the intensity maps, and in 4 the broad-band spectral energy distribution and radio spectral index maps of VII Zw 466 and companions. In 5 we discuss the implications of the radio results, especially in the context of the compression of the ISM and the implications for the efficiency of the synchrotron emission from relativistic electrons. In 6 we explore the consistency between optically determined star formation rates and radio observations, allowing us to estimate the number of UV photons heating the dust seen in the ISO observations. This well constrained UV flux is discussed in the context of the “warm” dust distribution seen with ISO. We attempt to develop a complete picture of VII Zw 466 as a collisionally compressed galaxy in 7. We state our conclusions in 8. In the Appendix we present upper limits to the molecular content to VII Zw 466 and one of its companions.
Throughout this paper, we will adopt a Hubble constant of 80 km s-1 Mpc-1. Using the H I systemic velocity of 14,465 km s-1 (ACS) we therefore assume a distance to the VII Zw 466 group of 180 Mpc.
2 The Observations
2.1 VLA Radio Continuum Observations
The 6 cm (4.86 GHz = C–band) radio observations were made with the D-array of the VLA on August 25 1992. Further observations were made at 20 cm (1.425 GHz = L-band) and 3.6 cm (8.43 GHz = X-band) with the C-array on October 28 1994. AIPS was used to do the standard calibration and data reduction. Images were made and CLEANed using the AIPS routine MX. The resulting synthesized beam sizes for the 20 cm, 6 cm and 3.6 cm observations were 1812 arcsecs, 1810 arcsecs, and 13.38.7 arcsecs respectively. Thus, through the choice of appropriate VLA configurations, the resolution of the 6 cm and 20 cm observations were closely matched. The 3.6 cm observations were made using natural weighting of the interferometer observations in order to provide the maximum sensitivity to faint features.
2.2 OSO Millimeter-Wave Observations
In order to attempt to detect molecular gas in VII Zw 466 and its spiral companion G2, we have searched for 12CO(1-0) emission towards those galaxies using the 20m radiotelescope at Onsala Space Observatory, Sweden. The observations were made in April 1999. At 110 GHz, the telescope half-power beamwidth is 34, the main-beam efficiency is =0.55. We used a SIS receiver and a filterbank with a total bandwidth of 512 MHz and a resolution of 1 MHz. During the observations, the typical system temperature was 500 K. The pointing was regularly checked on nearby SiO masers. The pointing offsets were always below 10. The spectra were smoothed to a final velocity resolution of 21.8 km s-1. First-order baseline were subtracted from the spectra. The total on-source integration time was 400 minutes for VII Zw 466 and 90 minutes for G2. Since the galaxies were not detected we present in an Appendix the salient upper limits to the total molecular mass and a comparison with other work.
2.3 Mid-IR Observations
VIII Zw 466 was observed by ISOCAM (Cesarsky et al. 1996) on June 28 1996 (ISO revolution 224) as part of a ISO-GO observation of bright northern ring galaxies. The galaxy was imaged through 4 filters, LW1 (4.5 [4.0-5.0]m), LW7 (9.62 [8.5-10.7]m), LW8(11.4 [10.7-12.0]m), and LW9(15.0 [14.0-16.0]m) with on-source time of 9.3 minutes per filter.
A lens, resulting in a 3 pixel field of view, was used to create a 32 raster map in a “microscan” mode in one direction. To improve the signal to noise ratio, the ISOCAM images were smoothed to yield a point-spread-function with a FWHM of 5.4 arcsecs. The overall field of view was 102102 arcsec2.
The standard data reduction procedures described in the ISOCAM222The ISOCAM data presented in this paper was analyzed using “CIA”, a joint development by the ESA Astrophysics Division and the ISOCAM Consortium led by the ISOCAM PI, C. Cesarsky, Direction des Sciences de la Matière, CEA, France manual were followed (Delaney 1998). Dark subtraction was performed using a model of the secular evolution of the ISOCAM dark currents (Biviano et al. 1997). Because of the well-known transient response to cosmic-ray events in the data, cosmic ray removal was performed using a combination of multi-resolution median filtering, and time-series glitch removal. Memory effects in the detector were corrected using the so-called IAS transient correction algorithm (Abergel et al. 1996). These methods and their consequences are discussed in detail in Starck et al. (1999). The memory effects were worst in the LW9 filter (long-wavelength filter) which was observed first (sequence LW9, LW8, LW7 and LW1) since we had no knowledge of the source structure prior to our target acquisition. Hence, our signal to noise ratio is worse in this filter, reflecting the assumed arbitrary model point source for the state of the detectors prior to our observations. The rms noise in our ISOCAM images varied slightly over each image and it was typically 5 Jy/pixel in the LW1 image, 2Jy/pixel in the LW7, 4Jy/pixel in the LW8 and 6Jy/pixel in the LW9.
3 The ISOCAM and VLA Imaging of VII Zw 466 and its Inner Galaxy Group
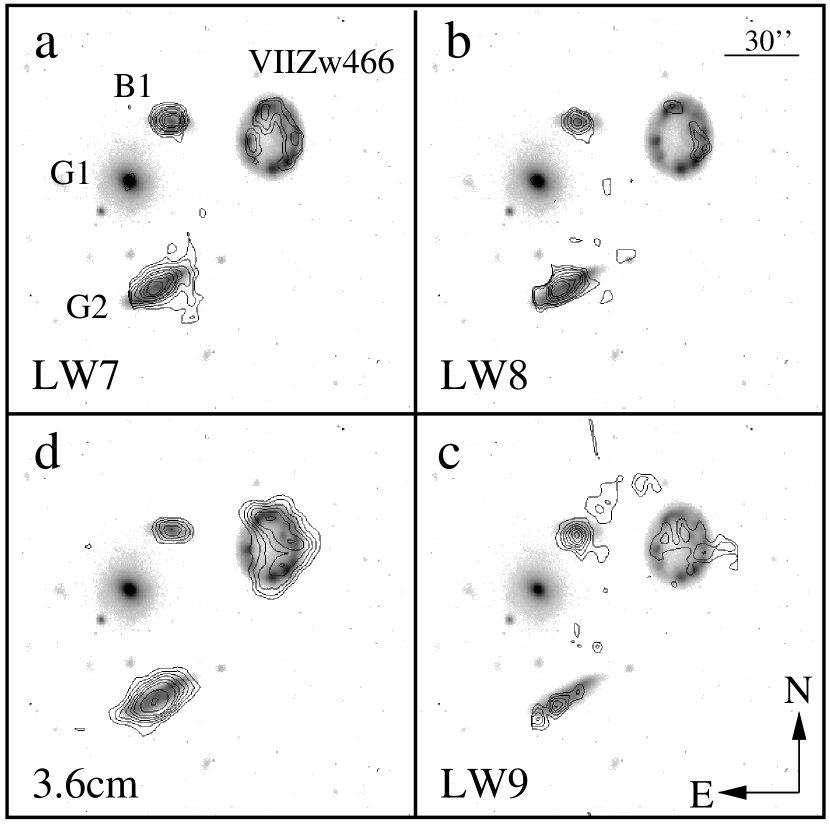
In Figure 1a,d we show the B-band greyscale image from Appleton & Marston (1997) of the inner VII Zw 466 group. On the figure we indicate the ring galaxy, companion galaxies VII Zw 466 (Cl):G1 (elliptical, hereafter G1) and VII Zw 466 (Cl):G2 (edge-on disk and likely “intruder”, hereafter G2) and the background galaxy VII Zw 466 (Cl):B1, hereafter B1333The names of the galaxies presented here are consistent with the names given to them by Appleton, Charmandaris and Struck (1996), and Appleton & Marston (1997), and their coordinates are given in Table 1 of the current paper.. Superimposed over the optical image, in Figure 1a,c, we present contour maps of the more interesting, longer-wavelength ISOCAM images, 9.6m, 11.4m and 15.0m. In Figure 1d we show contours of the 3.6 cm radio emission, again superimposed over the B-band images of the group. Three of the galaxies, VII Zw 466, G2, and B1 are detected at these the longer wavelength bands. Only the elliptical galaxy G1 is detected at 4.5m as an unresolved point source (this map is not shown). Upper limits to non-detections and values for the fluxes of the galaxies in each band are given in Table 1.
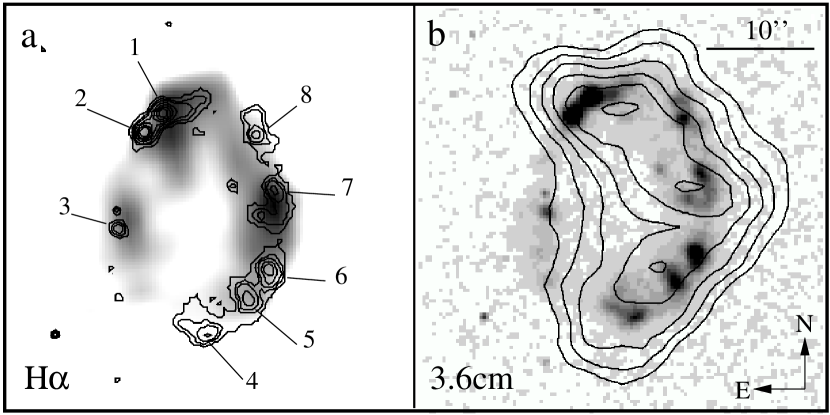
The distribution of Mid-IR emission at 9.6m and 11.4m shown in Figure 1a and b are very similar except that the signal to noise level is higher in the 9.6m image. At these wavelengths, the emission in VII Zw 466 is concentrated in three main regions, one in the north, one in the east and one in the western quadrants of the ring (the eastern source is missing in 11.4m image, but this is most likely because the source is weaker and just drops below the detection threshold at this wavelength). The distribution of Mid-IR emission at these wavelengths follows quite closely the brightest H sources in the ring. Figure 2a shows the distribution of H emission contours superimposed on a grey-scale representation of the 9.6m emission. Strong emission in both bands is seen from the background galaxy B1, and the edge-on disk G2. The emission from G2 is elongated along the major axis of the galaxy and unresolved along the minor axis. The elliptical galaxy (G1) is detected at 4.5m, and is marginally detected at 9.6m. The background galaxy B1 is known to be at approximately twice the redshift of the VII Zw 466 group, and its Mid-IR emission provides a working point-spread-function for our observations because its emission is unresolved at all wavelengths at which it is detected (9.6, 11.4 and 15 m).
In Figure 1c we show the 15.0m emission from the group. This wavelength was the first observed in the observing sequence, and is therefore of lower sensitivity than the other observations (see 2). The emission from VII Zw 466 is quite faint and is only detected at the 5 level when averaged over the whole galaxy. Nevertheless, the brightest emission knot is seen centered on the western quadrant of the ring, and faint emission is also seen from the eastern knot. Very faint emission may be detected from the interior of the ring in the north, but the emission is weak and would require higher sensitivity observations to confirm its reality. Oddly, the northern ring-source, seen at both 9.6m and 11.4m, is absent in these observations. Considering that the northern knot is associated with the brightest H emitting regions, the failure to detect this knot at 15 m is surprising (see Fig. 2a), but may also reflect the poorer quality of the 15 m observation (see discussion on memory effects in 2.2).
We note that the emission from the edge-on disk galaxy (G2) at 15m breaks up into three discrete sources. In this region, a line of bad detectors crossed the galaxy position just south-east of the nucleus of G2. Flux from this region could not be recovered by the micro-scan technique because the galaxy was too close to the edge of the detector array. Hence the total flux for G2 in this band is probably underestimated in our observations by up to 20%.
In Figure 1d, we present the radio continuum emission at 3.6 cm. The radio emission is superficially similar to the emission at 9.6m. However, it is significantly more crescent-like, and, unlike the 9.6m image, shows no emission associated with the eastern star-formation complex. The brightest radio emission comes from the north-west quadrant and, unlike the Mid-IR maps, does not show a close correspondence with individual H II regions, although it follows roughly the shape of the ring. There is a tendency for the radio emission to lie on the inside edge of the ring defined by the stars and H II regions. Figure 2b shows the 3cm radio emission contours superimposed on a greyscale representation of the H emission. The ridge of radio emission along the south-western edge of the ring and along the northern regions of the ring peaks inside the ring. Only in the western ring is there a close correspondence between the peak of the radio emission and the peak in the H. We will argue from spectral index considerations, that this is where the radio emission is predominantly thermal.
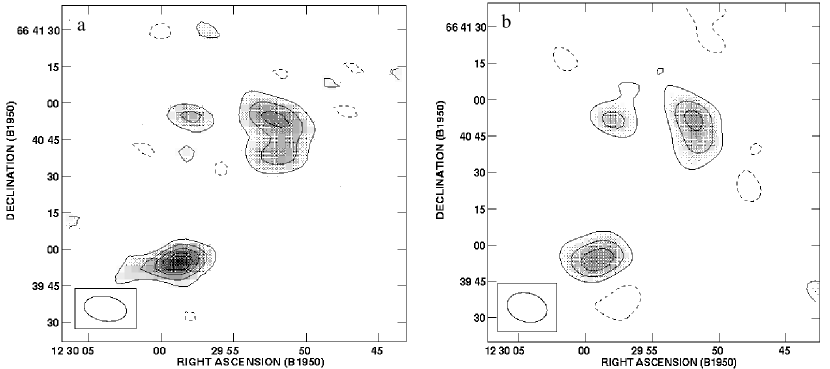
In Figure 3a,b, we present the radio continuum maps of the longer-wavelength 20 and 6 cm VLA observations. Although the observations are of lower resolution, they show the same crescent-shaped distribution seen in Figure 1d, with no evidence for emission from the eastern quadrant of the ring. Radio fluxes and globally-averaged radio spectral indices are given for VII Zw 466 and the other galaxies detected in Table 2. The galaxy G2, the edge-on spiral believed to be the “intruder” galaxy, is strongly detected (see Figure 1d and 3a,b), and fainter emission is seen from the known background galaxy B1. Galaxy G2 shows a flattening of its radio spectrum as one goes to higher frequencies (Table 2), whereas the globally average values for the spectral index are similar for the ring galaxy and the background galaxy B1. The steeper values of the spectral index are typical of a predominantly synchrotron spectrum whereas, for G2, the flattening of the spectrum may be a result of an increasingly thermal component, perhaps resulting from a powerful starburst.
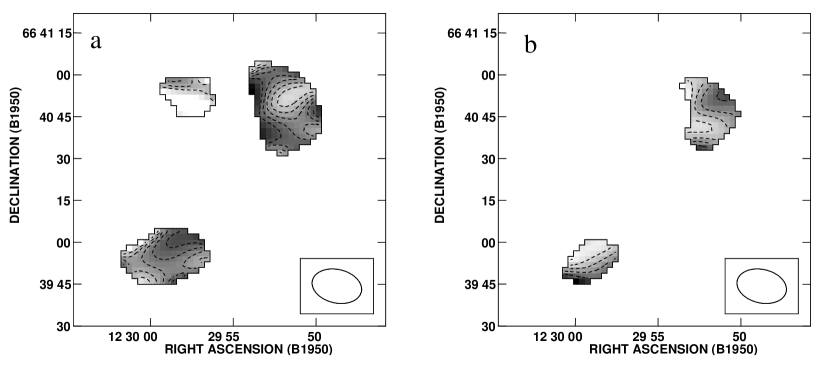
In Figure 4a and b, we present the radio spectral index maps of the galaxies (computed between 20 and 6 cm and between 6 and 3.6 cm). Although the resolution in these maps is poor (we convolved the higher frequency observation to the resolution of the lower frequency one in each case), the ring galaxy shows some structure in these maps. The “horn” of the crescent in both maps show radio spectral indices typical of synchrotron emission, with a value of = -0.6 to -0.7 in both maps (a value close to the average for the whole galaxy-Table 2). However, in the center of the “crescent”, which would correspond to the western “hotspot” in Figure 1d in the ring, the radio spectrum shows a change of slope from a spectral index which is quite steep between 20 and 6 cm, = -1.0, to a flat spectrum at the shorter wavelengths of 6 to 3cm ( = 0.0). Such a change in slope is typical of a radio spectrum which shifts from one dominated by synchrotron emission to a thermal spectrum. The radio observations suggest that there is a strong source of hot plasma in the western part of the ring. Optically, this region does not show strong H emission, but lies between two moderately bright H II regions.
4 Spectral Energy Distributions and the origin of the Mid-IR emission
In Figure 5 we present spectral energy distributions (SEDs) for the four galaxies observed, based on our previous optical/IR photometry (Appleton & Marston 1997), the low-resolution Faint Source Catalog of IRAS (Moshir, Kopman & Conrow 1992), and the current radio data. The detection of emission in the Mid-IR is an order of magnitude lower than the previous upper limits to the 12m flux from IRAS. The emission from the elliptical companion G1 at 4.5m and 9.6m is quite consistent with the emission being an extrapolation of the stellar continuum seen at shorter wavelengths. It is known that the Mid-IR spectrum of elliptical galaxies is dominated by their evolved stellar population, and can be modeled fairly well using a blackbody continuum with a temperature of 4500K (Madden 1997). This is not the case for the other galaxies where there is a clear Mid-IR excess.
Although we explored a pure dust model of the SED of the Mid-IR emission from VII Zw 466 and obtained a satisfactory fit to these data with a dust temperature of =226 K, we have decided not to present these results here. It is very likely that the spectrum is affected by emission from Unidentified Infrared Bands (UIBs). These broad lines (centered at 6.2, 7.7, 8.6 and 11.3m) are commonly seen in active star formating regions, and are usually attributed to emission from PAHs, since they can be produced by the stretching of C-C and C-H bonds (Léger & Puget 1984; Verstraete, Puget & Falgarone, 1996). As a result, we find that our LW7 (9.6m) and LW8(11.4m) filters are likely to be significantly affected by the 7.7 and 11.3m UIBs, after taking into account the redshift of the galaxies. Indeed it is likely that in these bands, much of the emission we see originates in the UIB features.
In order to facilitate a comparison between our observations and other star formation active regions in which UIBs are present, we show in Figure 6, LW7, LW8 and LW9 fluxes for VII Zw 466 superimposed on two contrasting spectra taken with ISO of the well known Antenna galaxy (Mirabel et al. 1998, Vigroux 1997). The spectra have been redshifted to that of VII Zw 466. It can be seen from Figure 6 that the UIBs at 7.7 and 8.6 m are partially shifted into the LW7 (9.6m) filter. Similarly, the rather brighter UIB at 11.3m, if present, is expected to affect the LW8 (11.4m) flux measurement. Because of the redshift of VII Zw 466, the LW9 bandpass (centered on 15.0m) falls between the [NeII] and [NeIII] emission lines and effectively gives an uncontaminated measurement of the thermal continuum at 15m. It can be seen from a comparison between our flux measurements for VII Zw 466, and the Antenna spectra, that our measurements are consistent with a spectral energy distribution similar to Knot B in the Antenna. The main difference between Antenna Knots A and B is the strong enhancement in the 12-16m thermal continuum, which is very powerful in Knot A as compared with the strength of the UIBs. In Knot B, the contributions to the spectrum from the UIBs and a mild thermal continuum are much more comparable.
In order to further quantify this similarity, we present in Table 3 the LW8/LW7 and LW9/LW7 flux ratios that would be expected for various input spectra obtained from publicly available ISO data sets. We take four different input spectra, three from the Antenna galaxy (Knots A, B and Z from Mirabel et al. 1998 and Vigroux et al. 1997), and one from the ISO Mid-IR spectrum of Arp 220, which shows a very strong silicate absorption feature (Charmandaris et al. 1999b). Table 3 shows that the flux ratios most consistent with the observed ratios for VII Zw 466 is Knot B of the Antenna. This is a result of the contaminating influence of the 11.3 m UIB relative to the 7.7 and 8.6m UIB features. In most other cases the ratio of the LW8/LW7 flux is significantly greater than unity due to the combination of both the strength of the 11.3m UIB feature and a relatively strong rising thermal continuum beyond 10m. An extreme case is Arp 220, where the LW9/LW7 ratio is large, reflecting a combination of a rapidly increasing thermal continuum at longer wavelengths and a strong dip in the spectrum around 10m due to silicates seen in absorption444We also compared our results with spectra of the rare case of sources in which silicates are seen in emission, rather than absorption (This is the case for some unusual H II regions observed recently by ISO–J. Lequeux, Private Communication). Again, this did not yield the ratio of LW8/LW7 emission seen in VII Zw 466..
Table 3 shows that the Mid-IR spectrum of the G2 and the background galaxy B1 are similar to VII Zw 466 in their ratios of LW8/LW7 and LW9/LW7. In the case of G2, the latter ratio is not reliable because of the uncertain flux of G2 in the LW9 band (see 3).
5 Explaining the Radio Morphology: Compression of the ISM and/or Increased Supernova Rate?
5.1 Amplification and Trapping of Cosmic-Ray Particles in a Compressed Disk?
Models of slightly off-center collisions between galaxies lead to the prediction that the ISM will be compressed more on one side of the target galaxy compared with the other (Appleton & Struck-Marcell 1987). This effect was used by Charmandaris, Appleton & Marston (1993) to explore threshold star formation behavior in Arp 10. In VII Zw 466, the crescent-shaped distribution of the radio emission at 3 cm is very suggestive of both compression and trapping of relativistic particles in the disk.
In order to explore this idea further, we will briefly explore the possibility that the crescent-shaped enhancement in the radio emission can be explained in terms of a modest (approximately 5-10 times) compression of the galactic disk on one side of the galaxy compared with the other. Such density enhancements are similar to those predicted in the model by ACS used to explain the H I fingers extending from VII Zw 466.
Helou & Bicay (1993) showed that the radio synchrotron luminosity of a relativistic electron in a galactic disk was:
| (1) |
where Lcr is the luminosity in the cosmic ray population, and tx is the ratio of two critical time-scales, tx=tesc/tsynch. Here tesc is the time taken for a cosmic ray electron to diffuse vertically within the disk to a point where it can escape confinement, tsynch is the synchrotron lifetime of an electron in an average galactic magnetic field, and is a constant close to unity. To extract the maximum available luminosity from the electron before it looses too much energy, tesc tsynch (or tx 1) and then Lsynch Lcr. On the other hand, if tesc tsynch (or tx 1), a result of the electron escaping from the disk before it can deposit all its energy, then Lsynch Lcr and the radio synchrotron luminosity will be significantly reduced. Helou & Bicay estimate the values of the two time-scales as follows:
| (2) |
and
| (3) |
Here, hdisk is the scale-height of the magnetically confined galactic disk, lmfp is the mean free path of the electrons in the disk, B is the magnetic field strength, is the angle of the electron momentum vector to the magnetic field vector, and Eo is the initial injection energy of the particle. The escape lifetime is a random walk out of the disk by scattering off magnetic irregularities which set the scale of lmfp. Putting in realistic values for the above parameters (hdisk = 1 kpc, lmfp = 1 pc, B = 5 G, Eo = 5 GeV) we find that tesc = 107 yrs and tsynch = 6 x 10⁷ yrs, and so for cosmic ray electrons with energies of a few GeV, tesc is shorter than the synchrotron lifetime, and we are in the regime in which Lsynch cr555In our galaxy, the break in the cosmic ray electron spectrum (see discussion by Longair 1994), in the range 1-10 GeV is most likely a result of the escape in the electrons from the Galactic disk at the lower energies–hence the most efficient synchrotron production occurs for those that remain trapped–with energies 5 to 10 GeV.
We can now ask the question–what happens if the disk containing a steady-state cosmic-ray population of relativistic electrons before the collision, is compressed by a factor of 5-10 in part of the ring-wave for about 50-100 million years? This compression timescale comes from the width of the stellar ring (3.6 arcsec or approximately 3 kpc), divided by the radial expansion velocity of the ring Vrad = 32 km s-1 based on H I observations (see ACS). The compression has a two-fold effect. Firstly, it is likely that the component of the magnetic field perpendicular to the compressional shock wave will be amplified (B proportional to ), resulting in a decrease in the synchrotron lifetime by 25 to 100. Secondly, the compression will also order the random component of the magnetic field and reduce the average distance between magnetic irregularities in the disk in a linear way, increasing the time needed for the electron to escape from the disk by a factor of 5 to 10. The net effect is to increase tx by a few hundred, perhaps enough to allow the synchrotron emission from our canonical 5 GeV electron to reach its maximum efficiency Lsynch Lcr. The compression of the disk in the ring wave temporarily decreases the energy at which disk CR-electrons will be just trapped by the disk from typically Eo 10 GeV to around 1 GeV. The effect on the overall synchrotron luminosity will be a significant increase in the radio luminosity in the region just behind the peak compression of the wave. In the models of the off-center collisions, just such a crescent-shaped compression is expected, and the fact that the radio emission is off-set a little to the inner edge of the ring is confirmation that the basic idea is correct. One (rather untestable!) prediction of our observations would be that if it was possible to actually measure the electron energy spectrum of cosmic rays in the enhanced region of VII Zw 466, a spectral break should occur at lower energies (more like 1 GeV) than that seen in our own Galactic disk (5-10 GeV; e.g. Longair 1994).
5.2 Supernova Rates in VII Zw 466: An Alternative to Compression?
In the last section we explored the possibility that disk compression alone is responsible for the crescent-shaped radio distribution. An alternative explanation for the enhanced radio emission on the western half of VII Zw 466 might be the generation of new CR particles from Type II SN resulting from the triggered star formation in the ring. Although this does not contradict the analysis in the previous section (we did not say where the CR electrons originated), it does mean that the relativistic electrons do not need to pre-date the collision, but can be created as a direct consequence of the massive star formation process itself. In this picture, the compression need not be the main factor responsible for the enhanced radio emission, but rather that enhanced star formation would lead to a higher SN rate on one side of the galaxy compared with the other.
Condon & Yin (1990) provide an estimate of the supernova rate from the non-thermal component of the radio synchrotron luminosity using the formula:
| (4) |
where is the radio frequency of the observation, is the spectral index, and RSN is the rate of Type II supernova per year. Assuming that 70% of the radio emission from VII Zw 466 is non-thermal at 6 cm (a figure based on a simple fit to the spectrum of the galaxy), we find that LNT= 4.4 1021 W Hz-1. With this figure, we find a supernova rate RSN = 0.048 yr-1. How reasonable is this number? One way to check it, is to see whether this supernova rate agrees with the expected rate based on our knowledge of the star formation rates in VII Zw 466. The total H flux from VII Zw 466 is 7.2 1041 ergs s-1 or 7.2 1034 W (Marston & Appleton 1994). Based on the models of Kennicutt (1983) we can calculate from the H luminosity the rate of star formation for stars more massive than 10 M to be 0.97 M/yr for VII Zw 466 as a whole. If we assume that all stars more massive than 10 M explode as supernova, then the number of stars being born per year with masses 10 M will be equivalent to the Type II supernova rate. The rate will increase with time since the main contribution to the supernova rate comes from the more populous lower mass stars which have longer main sequence lifetimes. However, this rate will be reasonable if it is averaged over a few x 107 yrs, which is also the approximate propagation time of the ring wave through a given regions of the gas disk. For an assumed upper mass cut-off of 80 M and an IMF slope of -2.35 (Salpeter) the rate of formation of massive stars is 0.045 dM/dt or 0.044 stars/yr. This would correspond to the supernova rate (RSN = 0.044) under the assumptions given above. This figure is in close agreement with the value derived from the non-thermal radio emission. However the agreement is fortuitous. For example, a change in slope of the IMF to -3 (a bottom heavy IMF) would increase the supernova rate to 0.053/yr. And so a realistic value for the Type II supernova rate derived from the H fluxes would be RSN = 0.045 0.01, or about 1 supernova every 20 years. The lower-limit to the star formation rate implied by the H observations (uncorrected for extinction) is therefore capable of delivering the observed radio flux through in situ Type II supernova associated with the star-forming regions. The agreement also suggests the H flux is relatively free of absorption in VII Zw 466. These facts make VII Zw 466 an interesting place to look for supernova explosions at optical and radio wavelengths, and we would urge that the galaxy be monitored every few years for signs of explosions in the outer ring666We also note that we get a very similar result for RSN = 0.046 from a composite optical/radio method (see equation 12 of Condon & Yin 1990). Since this method depends not only upon the H flux, but also on the ratio of the thermal to non-thermal radio emission, the agreement between that result and the one presented in the main text here is confirmation that we have correctly separated the thermal from the non-thermal radio emission (70% to 30%) in VII Zw 466. The value of RSN derived by this method is sensitive to the assumed ratio of thermal to non-thermal emission..
6 The Thermal Ultraviolet Continuum
The Mid-IR observations suggest that dust grains are being heated by the hot young stars. What limits can be placed on the strength of the UV emission? We are in the fortunate position in VII Zw 466, of having two relativity independent method of measuring the UV continuum, namely the radio and the optical hydrogen recombination line flux (The Far-IR flux can also provide a third rough measure of the UV flux). The first measure is from the H flux, which can be used to estimate the strength of the Lyman continuum. From the total H flux (Marston & Appleton 1995) we can estimate the total number of ionizing UV photons Nuv=LHα/1.3610-19 = 5.31053 s-1 (assuming an electron temperature of 104 K). Since no internal reddening correction has been made to the H flux, this UV flux is a lower-limit. Secondly, we can make a crude decomposition of the radio flux into thermal and non-thermal, based on the spectral index radio maps and use this to estimate the UV emission. Approximately 30% of the total radio flux at 6 cm is estimated to be thermal. Hence, again from Condon & Yin, we can determine the number of UV photons from:
| (5) |
From the 6 cm radio flux we obtain a value for Nuv = 81053 if T4=1 (the electron temperature in units of 104 K).
Hence there is excellent agreement between the H determination and the radio determination for the number of ionizing photons. The radio result suggests an upper limit to the optical extinction near 6563Å of 0.4 mag. This would translate to Av 1 mag for a Galactic extinction curve and is very consistent with a low value for Av of 0.2 for all of the H II regions observed spectroscopically by BAMC, except for one knot inside the ring on the western side)777The Far-IR flux provides an additional check on the UV flux if we assume that the FIR luminosity contains a large component of its luminosity from re-processed UV radiation from star forming regions. The total FIR luminosity for VII Zw 466 can be estimated from the IRAS flux, and LFIR= 7.99 1036 W. (VII Zw 466 is F12297+6641 in the IRAS Faint Source Catalog and its log(FIR)=-13.69 W m-2). This compares with a UV luminosity derived from the radio estimate above of L(radio)uv of 2.71036 W, if the average UV photon energy is 20 eV, the temperature characteristic of a typical 50,000 K O star..
7 Building A Complete Picture of the Activity in VII Zw 466
Previous observations of VII Zw 466 have shown that the outer ring consists of star clusters and H emission regions consistent with a young (10-20 million year old) population of stars recently laid down by the passage of a radially expanding wave through the disk (BAMC, ACS). In this paper we have presented some new ingredients, namely the radio continuum emission and the Mid-IR emission from ISO. We have determined that the thermal component of the radio emission is in good agreement with the global H emission in providing a quantitative estimate of the ultraviolet continuum from the star formation. This observation allows us to rule out the possibility that VII Zw 466 is heavily obscured by dust at optical wavelengths. It is this same UV continuum which is presumably responsible for the heating of the Mid-IR emission regions seen by ISO, at least in the 9.6 and 11.4 m ISOCAM bands. The UV continuum must also heat the grains responsible for the Far-IR emission, and we have seen that the fluxes we have calculated are at least comparable with the total Far-IR flux for reasonable mean UV photon energies. Based on the fluxes given in Table 1, we can estimate the total Mid-IR luminosity of VII Zw 466 LMIR = 2.391035 W, which is approximately 10% of the estimated available UV luminosity (Luv=NuvEuv, where we assume the average UV photon energy Euv = 20 eV).
The distribution of H II regions in VII Zw 466 have already been shown in Figure 2a and 2b. The observations, first presented by Marston & Appleton (1995), are further analysed here. In Figure 2a we label the knots and present the H and 9.6m fluxes in Table 4. As mentioned earlier, the 9.6m emission follows closely the H II region distribution. Even Knot 3, the eastern knot, is detected at 9.6m. From Table 4 it can be concluded that the fluxes of the ISO emission do not scale linearly with the fluxes of the H II region complexes. Since significant optical extinction is not responsible, it is more likely that the variations from one region to another are due to an irregular filling factor for the dust in the UV radiation field (we know that only 10% is absorbed on average, but this could vary wildly from one region to another). Alternatively, if the grains responsible for the emission are small, they may be subject to thermal spiking by single UV photons. In this case, there is no reason to expect that the IR flux from a collection of such grains would scale linearly with the incident UV flux. Figure 2b also emphasizes the difference between the radio and H distribution, which does not follow the H II regions as faithfully as the 9.6m emission. This may be because the radio emission is following the region of maximum compression of the hydrodynamic disk (see 5), whereas the star formation is more stochastic showing hot-spots as different star clusters form at slightly different times around the ring. The observations show that, even in a galaxy in which many of the overall parameters of the collision are quite well known, the distribution of the various phases of the ISM and the star formation which develops is quite complex.
An unexpected aspect of the ISOCAM observations is the distribution of 15m emission in the ring galaxy (Figure 1c–from the ISOCAM LW9 filter). Only the H knots 3 and possibly 6 (see Figure 2a for labeling of knots) are coincident with corresponding knots at 15m. It is not clear if this is because of the poor signal to noise of this ISO band, or that the emission really does avoid the sources of UV radiation. This result is consistent with the majority of the H II region complexes in the Cartwheel galaxy (Charmandaris et al. 1999) which are also absent at 15m, but are detected at shorter wavelengths. Only one extremely powerful H II region complex in the Cartwheel was detected at 15m, and it was suggested that this was because of its unusually large H luminosity. It is possible that strong winds and radiation pressure may lift the grains responsible for the 15m emission to large distances from the H II regions causing them to radiate in the Far-IR, unless the H II regions are especially luminous. None of the H II regions in VII Zw 466 are comparible in luminosity with the very bright complex in the Cartwheel (see BAMC). However, we caution that the emission from VII Zw 466 in the LW9 filter is weak, and this filter was more prone to memory effects than the shorter wavelength filters. Higher S/N ratio observations will be required to confirm the above results.
8 Conclusions
The observations at radio and IR wavelengths have shown that:
1) Emission from the ring galaxy is detected in three ISOCAM bands (9.6, 11.4 and 15 m–filters LW7, LW8 & LW9). The total mid-IR luminosity LMIR is approximately 10% of the available UV luminosity from star formation found by two independent methods. The emission at 9.6 and 11.4m follows, but does not precisely scale with, the flux of the H emitting regions. This is consistent with the dust grains being heated in clumpy, somewhat irregular distributions surrounding the H II region complexes, or that the grains are distributed uniformly, but are small thermally-spiked grains. The 15m emission is only marginally detected, but seems to be poorly correlated with the H II regions and some of its emission may lie inside the ring.
2) The Mid-IR emission spectral energy distribution is most consistent with emission from grains warmed by young stars. The shorter wavelength bands observed around 8-11m are contaminated by emission from Unidentified Infrared Bands (probably thermally spiked PAHs), whereas the longer wavelength band at 15m shows a weak thermal continuum similar to Knot B in the Antennae galaxies.
3) Radio observations, made at 3, 6 and 20 cm, reveal a crescent-shaped distribution of emission which peaks on the inside edge of the ring, but is not as closely associated with the H II region complexes as the Mid-IR emission. Spectral index variations around the ring suggest that about 30% of the emission at 6 cm is thermal, and is consistent with the observed H flux. This suggests that little optical extinction is present in the galaxy. The non-thermal component of the emission, which dominates the radio emission, is a synchrotron component which we associate with a cosmic ray (CR) population trapped in the disk of VII Zw 466. The enhancement in the radio flux in one side of the ring (giving it an apparent crescent-shaped distribution) is caused by either: i) a compressional amplification and trapping of the synchrotron emitting particles by the compression wave which is stronger on one side of the galaxy than the other (a result of the off-center nature of the collision), or ii) an enhancement in the number of Type II supernova on one side of the galaxy from the other. Both mechanisms seem plausible and both may play a role in defining the radio morphology.
4) By a number of different methods we calculate the Type II supernova rate in VII Zw 466 to be RSN = 0.045 0.1 (approximately 1 every 20 years) in the ring. A comparison between optical and radio observations suggests that VII Zw 466 has unusually low optical extinction (a result also suggested by optical spectroscopy-BAMC). Hence this galaxy would be an ideal candidate for automated supernova searches and for repeated radio imaging for radio supernova.
5) The difference in morphology between the radio and optical/Mid-IR distribution may result from the different way in which various components of a galaxy respond to the compressional wave which is expected to pass through the “target” disk in a ring-galaxy collision. The strength of the radio emission may respond directly to the overdensity and compression of the ISM (especially the cosmic-ray “fluid”), whereas the star formation and associated dust is more stochastic, resulting from parts of the disk being pushed into a star-formation mode in a non-uniform way, leading to a more scattered distribution of emission centers around the ring.
6) The galaxy G2, an edge-on disk a few diameters away from the ring, is strongly detected at Mid-IR and radio wavelengths, and has a similar spectrum to the ring galaxy. It is likely that the star formation activity in that galaxy has been enhanced because of the interaction with VII Zw 466. Previous H I observations and modelling have suggested that G2 is the “bullet” responsible for the formation of the ring in VII Zw 466.
Appendix A Upper Limits to the Molecular and Total Gas Content of VII Zw 466 and its companion VII Zw 466 (Cl):G2
In 2.2 we describe the OSO observations of VII Zw 466 and G2. No significant CO emission was detected from either of the two galaxies. Upper limits can be determined from the noise in the final spectra (=2.3 mK for VII Zw 466 and 10 mK for G2) and the H I linewidths ( km s-1 for VII Zw 466 and 84 km s-1 for G2; see ACS). The inferred limits on the H2 masses given in Table A1 were calculated using a standard CO to H2 conversion factor (N(H2)/I(CO)= 2.3 1020 mol cm-2 (K km s-1)-1; Strong et al. 1988). We caution that it is not known whether this factor is appropriate for collisional systems.
The limit on the value of log(M(H2)/LB) ratio for VII Zw 466 is -1.46 for VII Zw 466 and -0.93 for G2 (LB is based on the CCD photometry of Appleton & Marston 1997). Hence VII Zw 466 has a slightly lower than the average value measured in ring galaxies but not significantly (log(M(H2)/LB) = -1.180.41; Horellou et al. 1995). Given the star formation rate of 0.97 M/yr derived from the H imaging, it would seem that VII Zw 466 would take at least 1 Gyr to deplete its molecular gas mass, and this is longer than the dynamical time for the ring to propagate out of the disk ( 108 yrs–see ACS).
The results also allow us to limit the total gas to stellar luminosity. In ACS, it was suggested that the low neutral hydrogen to optical luminosity for G2 may be evidence for significant gas stripping as a result of its passage through the disk of VII Zw 466 in the past. The molecular-line observations provide constraints on any molecular gas which may be present in both galaxies. Based on the H I observations of ACS, we can now place limits of the total gas mass in both galaxies, and various gas properties of the galaxies. These are presented in Table A1. The results show that both VII Zw 466 and G2 have total gas to light ratios which are similar. The molecular upper limit on G2 is not sufficiently stringent to support the idea that G2 is gas poor (the current limit on molecular hydrogen is a factor of two higher than the detected H I mass).
| Name | RA(1950)aafrom 3.8cm VLA radio positions | DEC(1950)aafrom 3.8cm VLA radio positions | Fν(4.5m) mJy | Fν(9.62m) mJy | Fν(11.4m) mJy | Fν(15.0m) mJy |
|---|---|---|---|---|---|---|
| VII Zw 466 (Total) | 12 29 51.5 | 66 40 46 | 0.8 | 5.70 (1.00) | 5.52 (2.50) | 5.76 (2.50) |
| VII Zw 466 (N Knot) | – | 1.71 (0.25) | 1.56 (0.83) | 1.71 (0.63) | ||
| VII Zw 466 (E Knot) | – | 0.60 (0.10) | 0.31 (0.20) | 0.55 (0.25) | ||
| VII Zw 466 (W Knot) | – | 1.21 (0.18) | 1.65 (0.40) | 1.24 (0.43) | ||
| G1 | 12 30 01bbfrom optical position (Jeske 1986) | 66 40 30bbfrom optical position (Jeske 1986) | 1.82 (0.8) | 0.1 (0.05) | 0.4 | 0.3 |
| G2 | 12 29 59.0 | 66 39 55 | 1.0 | 7.63 (0.56) | 8.91 (1.2) | [3.34 (1.40)]ccuncertain flux-see text |
| B1 | 12 29 58.0 | 66 40 50 | 1.0 | 4.67 (0.42) | 4.08 (0.87) | 3.83 (1.00) |
| Name | mJy | mJy | mJy | ()aaspectral index of the form F1/F2=α | ()aaspectral index of the form F1/F2=α |
|---|---|---|---|---|---|
| VII Zw 466 | 1.81 | 0.97 | 0.69 | -0.51 | -0.63 |
| G1bb1 upper limits in units of mJy/beam area | 0.14 | 0.02 | 0.02 | — | — |
| G2 | 1.52 | 0.60 | 0.52 | -0.75 | -0.28 |
| B1 | 0.76 | 0.26 | 0.14 | -0.87 | -1.18 |
| Region | LW8/L7 | LW9/LW7 | Comment |
|---|---|---|---|
| Antenna Knot A | 1.74 | 4.91 | Starburst region with strong thermal continuum |
| Antenna Knot B | 0.91 | 0.99 | Starformation region in presence of [NeIII] |
| Antenna Knot Z | 1.08 | 0.70 | Starformation region with little [NeIII] |
| Arp 220 | 0.32 | 6.22 | Powerful starburst with strong Silicate absorption |
| VII Zw 466 | 0.97 | 1.01 | Ring galaxy as a whole |
| VII Zw 466 W Knot | 1.36 | 1.03 | Western knot in ring |
| Galaxy G2 | 1.17 | [0.43] | Uncertain flux in LW9 due to stripe |
| Galaxy B1 | 0.87 | 0.82 | Higher redshift galaxy |
| Knot NumberaaKnots defined in Figure 2a | Flux mJy | Flux (x 10-14) ergs s-1cm-2 | Notes |
|---|---|---|---|
| Knot 1+2 | 1.71 | 5.2 | northern knots |
| Knot 3 | 0.60 | 1.5 | eastern knot |
| Knot 4 | 0.05 | 2.3 | |
| Knot 5+6+7 | 1.21 | 6.8 | western complex |
| Knot 8 | 0.05 | 1.66 | north-western knot |
| Name | M(HI) | M(H2) | M(HI)/M(H2) | M(HI+H2) | LB | log(M(H2)/LB) | log(M(HI+H2)/LB) |
|---|---|---|---|---|---|---|---|
| 109 M⊙ | 109 M⊙ | 109M⊙ | 1010 L⊙ | M⊙/L⊙ | M⊙/L⊙ | ||
| VII Zw 466 | 4.1 | 1.2 | 0.29 | 4.1–5.3 | 3.44 | -1.46 | -0.81 |
| VII Zw 466:G2 | 1.2 | 2.1 | 1.75 | 1.2–3.3 | 1.82 | -0.93 | -0.74 |
References
- (1)
- (2) Abergel, A., et al., 1996, A&A, 315, L329
- (3) Appleton P.N. 1998, in Galaxy Interactions at Low and High Redshift, IAU 186, Eds. J. Barnes and D. Sanders (in press)
- (4) Appleton, P. N. & Marston T. 1997, AJ, 113, 201
- (5) Appleton, P. N., Charmandaris, V, & Struck, C. 1996, ApJ, 468, 532 (ACS)
- (6) Appleton, P. N. & Struck-Marcell, C. 1996, in Fund. Cosm. Phys., 16, 111
- (7) Appleton, P. N. & Struck-Marcell, C. 1987, ApJ, 318, 103
- (8) Biviano, A., Sauvage, M., & Roman, P., E.S.A/C.E.A Technical report, December 1997
- (9) Bransford, M. A, Appleton, P. N., Marston, A. P. & Charmandaris, V., 1998, ApJ, 116, 2757 (BAMC)
- (10) Cannon, R. D., Lloyd, C. & Penston, M. V. 1970, Obs, 90, 153
- (11) Cesarsky, C.J., et al., 1996, A&A, 315, L32
- (12) Charmandaris, V., Appleton, P. N. & Marston, A. P. 1993, ApJ, 414, 154
- (13) Charmandaris, V. et al., 1999a, A&A, 341, 69
- (14) Charmandaris, V. et al., 1999b, Ap&SS, (In Press)
- (15) Condon, J. J. & Yin, Q. F. 1990, ApJ, 357, 97
- (16) Delaney, M. 1998, ISOCAM Interactive Analysis User’s Manual, Internal Document No. SAI/96-5226/Dc (CEA-Saclay-France).
- (17) Jeske, N. A., 1986, Ph.D. thesis, University of California, Berkeley
- (18) Helou, G. & Bicay, M. D. 1993, ApJ, 415, 93
- (19) Higdon, J. L. 1993, Ph.D. Thesis, University of Texas at Austin
- (20) Higdon, J. L. 1996, ApJ, 455, 524
- (21) Horellou, C., Casoli, F., Combes, F., & Dupraz, C., 1995, A&A 298, 743
- (22) Kennicutt, R. C. 1983, ApJ, 272, 54
- (23) Longair, M. S. 1994, High Energy Astrophysics: Vol. 2, Stars galaxies and the Interstellar Medium, 2nd Edition, (CUP, Cambridge)
- (24) Léger, A. & Puget, J. L., 1984, A&A137, L5
- (25) Lynds, R. & Toomre, A. 1976, ApJ, 209, 382
- (26) Madden S. C., Vigroux L., & Sauvage M., 1997, in XVIIth Moriond Astrophysics Meeting: Extragalactic Astronomy in the Infrared, p. 229, (Eds. G. A. Mamon, Trinh Xuan Thuan, & J. Tran Thanh)
- (27) Marston T. & Appleton, P. N. 1995, AJ, 109, 1002
- (28) Mirabel, I. F. et al. 1998, A&A, 333, L1
- (29) Moshir, M., Kopman, G. & Conrow, T. A. O. 1992, in IRAS Faint Source Catalog Ver. 2, (Pasadena: IPAC, California Inst. of Technology)
- (30) Schweizer, F. 1997, in “Galaxies at low and high redshift”, IAU Symp. 186, Kyoto, Japan
- (31) Starck, J.-L., Claret, A.& Siebenmorgen, R., C.E.A. Technical Report, March 1996
- (32) Starck, J.-L., Abergel, A., Aussel H., et al., 1999, A&AS, 134, 135
- (33) Strong A.W., Bloemen J.B.G.M., Dame T.M. et al., 1988, A&A 207, 1
- (34) Struck, C. 1997, ApJS, 113, 269
- (35) Thompson, L. A & Theys, J. C. 1978, ApJ, 224, 796
- (36) Toomre, A. 1978, in “The Large Scale Structure of the Universe”, IAU Symp. 79, ed. M. S. Longair & J. Einasto, (D. Reidel, Holland), p109
- (37) Verstraete L., Puget, J. L. & Falgarone, E. et al., 1996, A&A, 315, L337
- (38) Vigroux, L. 1997, in XVIIth Moriond Astrophysics Meeting: Extragalactic Astronomy in the Infrared, p. 63, Eds. G.A. Mamon, Trinh Xuan Thuan, and J. Tran Thanh
- (39)