The 1995-1996 Decline of R Coronae Borealis – High Resolution Optical Spectroscopy
Abstract
A set of high-resolution optical spectra of R CrB acquired before, during, and after its 1995-1996 decline is discussed. All of the components reported from earlier declines are seen. This novel dataset provides new information on these components including several aspects not previously seen in declines of R CrB and other RCBs. In the latter category is the discovery that the decline’s onset is marked by distortions of absorption lines of high-excitation lines, and quickly followed by emission in these and in low excitation lines. This ‘photospheric trigger’ implies that dust causing the decline is formed close to the star. These emission lines fade quickly. After 1995 November 2, low excitation narrow (FWHM km s-1) emission lines remain. These appear to be a permanent feature, slightly blue-shifted from the systemic velocity, and unaffected by the decline except for a late and slight decrease of flux at minimum light. The location of the warm dense gas providing these lines is uncertain. Absorption lines unaffected by overlying sharp emission are greatly broadened, weakened, and red-shifted at the faintest magnitudes when scattered light from the star is a greater contributor than direct light transmitted through the fresh soot cloud. A few broad lines (FWHM km s-1) are seen at and near minimum light with approximately constant flux: prominent among these are the He i triplet series, Na i D, and [N ii] lines. These lines are blue-shifted by about 30 km s-1 relative to the systemic velocity with no change in velocity over the several months for which the lines were seen. It is suggested that these lines, especially the He i lines, arise from an accretion disk around an unseen compact companion, which may be a low-mass white dwarf. If so, R CrB is similar to the unusual post-AGB star 89 Her.
keywords:
Star:individual: R CrB: variables:other1 Introduction
R Coronae Borealis is the prototype of a class of very rare and peculiar supergiant stars with two distinctive primary traits, one photometric and the other spectroscopic. Photometrically, an RCB is distinct because it declines at unpredictable times by one to several magnitudes as a cloud of carbon soot obscures the stellar photosphere for weeks to months. Spectroscopically, the distinctive signature of an RCB is weak Balmer lines that indicate an atmosphere deficient in hydrogen. Two fundamental questions about RCBs remain unanswered: By what evolutionary paths are some stars with their normal H-rich atmospheres converted to RCBs with He-rich atmospheres? What are the physical processes that trigger and control development of the unpredictable minima?
In this paper, we discuss spectroscopic observations of the recent deep and prolonged minimum of R CrB and aim to address the second question. The decline that seems to have begun on or around 1995 October 2 proved to be the deepest and longest decline of recent years. Recovery from the minimum of the decline was slow; even about 1 year after the onset of the decline the star was 1 magnitude below its normal maximum. Throughout this period, we were able to obtain high-resolution optical spectra of the star at quasi-regular intervals.
Our discussion of this novel dataset provides new insights into the widely accepted model of RCB declines in which a cloud of carbon soot obscures the star (O’Keefe 1939). There is convincing empirical evidence that the cloud is a localized event and not a spherically symmetric phenomenon. In particular, the infrared excess of the star is largely unchanged during the decline showing that a large dust cloud exists independently of the new decline and that the largely unobscured star heats this cloud (Feast 1979, 1996). The dusty cloud with a radius of 100 is heated by absorbing about 10% to 20% of the stellar radiation (Forrest, Gillett & Stein 1971,1972; Rao & Nandy 1986).
How and where the soot condenses has been debated. If dust is to form under equilibrium conditions in a quasi-hydrostatic extension of the stellar atmosphere, the required low temperatures are found only far from the star - say, at 10-20 stellar radii. If regions of the atmosphere are compressed by a shock, the necessary low temperatures can be found for a time much closer to the star - say at 1-2 stellar radii. Observational and theoretical arguments for the ‘far’ and ‘near’ sites of dust formation are reviewed by Clayton (1996, also Fadeyev 1986). The initial fading of the star has been plausibly interpreted as due to the lateral growth of a dust cloud.
Earlier accounts of R CrB, RY Sgr and V854 Cen have identified the following principal spectroscopic components that are revealed as an RCB is obscured by soot (see Clayton 1996 for a general review of observational characteristics of RCBs in and out of decline, and of their evolutionary origins):
-
•
Sharp emission lines. These lines appear shortly after the onset of a decline and disappear just before the return to maximum light. Alexander et al. (1972) in an extensive study of photographic spectra of RY Sgr divided these emission lines into two types - E1 and E2. Payne-Gaposchkin (1963) earlier noted the two types. A defining characteristic of E1 lines is that they fade away after about two weeks from a decline’s onset. Membership in E1 has been summarized by the remark that “this spectrum consists of many lines of neutral and singly ionized metals” (Clayton 1996). To this must be added the comment that the excitation of the E1 spectrum of lines is higher than that of the E2 spectrum. E2 lines are present throughout the decline and are likely permanent features. Prominent in the E2 (and E1) spectrum are lines of ions such as Sc ii, Ti ii, Fe ii, Y ii, Ba ii, as well as neutral atoms, particularly Fe i. The emission lines are slightly blue-shifted with respect to the star’s systemic velocity.
Accounts of these lines were given by Payne-Gaposchkin (1963) and Cottrell, Lawson & Buchhorn (1990) for R CrB, and Alexander et al. (1972) for RY Sgr – see also Rao & Lambert (1993) on V854 Cen and Goswami et al. (1997) on S Aps, both in deep declines.
-
•
Broad permitted and forbidden emission lines. Seen in deep declines, these are are much broader than the sharp emission lines. In the case of V854 Cen, for example, the width (FWHM) of the broad lines was about 300 km s-1 but the sharp lines were unresolved with a FWHM less than about 20 km s-1 (Rao & Lambert 1993).
The first report of forbidden and permitted broad lines in the spectrum of an RCB in decline was Herbig’s (1949, 1968) discovery of [O ii] 3727Å and He i 3889Å in the spectrum of R CrB. Herbig was unable to determine that the line widths differed from that of the Sc ii et al. lines but attribution of the lines to the group of broad lines now seems evident.
-
•
Photospheric absorption lines. In the early phases of a decline, the sharp emission lines are superimposed on a photospheric spectrum that appears largely unchanged for those lines that do not go into emission. In deep declines, the photospheric spectrum changes. A weakening of the lines noted by Herbig (1949) was confirmed and discussed by Payne-Gaposchkin (1963) and Cottrell et al. (1990) for R CrB. The weakening was attributed to ‘veiling’, a term implying dilution of the photospheric spectrum by overlying continuous (or line) emission. In an observation of V854 Cen in a deep decline, the continuous spectrum was devoid of lines (Rao & Lambert 1993).
-
•
Shell absorption components. During the recovery to maximum light and into full recovery, blue-shifted broad absorption components of the Na i D, and Ca ii H and K lines are seen. A velocity shift of -150 km s-1 seems typical. Reports of these lines were given by Payne-Gaposchkin (1963), Rao (1974), Cottrell et al. (1990), and Lambert, Rao & Giridhar (1990) for R CrB, Alexander et al. (1972) and Vanture & Wallerstein (1996) for RY Sgr, and Clayton et al. (1993) and Rao & Lambert (1993) for V854 Cen.
In this study of R CrB’s 1995-1996 deep decline, we discuss these spectroscopic components with an emphasis on novel results. With our temporal and spectral coverage, new detailed information is provided on all of the previously seen principal components. Since the decline was preceded by a long interval in which R CrB was at or near maximum light, it is most likely that all of the spectroscopic changes are associated with the decline and none are residual effects of earlier declines. Following a description of the sequence of spectra acquired from 1995 to 1996, discussion is arranged chronologically beginning with descriptive remarks on the spectrum of the star prior to the decline, continuing with spectroscopic changes associated with the onset of the decline, and concluding with remarks on the several components present in the spectrum from about mid-decline through the extended period of minimum light and into the recovery phase. These descriptions are followed by interpretative remarks on a model of R CrB including a suggestion that this star may be a spectroscopic binary.
2 Observations
Spectra were obtained at the W. J. McDonald Observatory with either the 2.7m or the 2.1m reflector. The light curve of R CrB through the decline is shown in the lower panel of Fig. 1 where the sources of the photometry are identified. The upper panel gives radial velocity measurements and the predicted velocity variation due to pulsation (see below). The measurements serve to indicate the relation between our observations and the phase of the decline – see also Table 1.
| Date | JD - 2440000.0 | Mag.111Visual magnitude from AAVSO. V (given to second decimal from Fernie (1997) and Efimov (1997). | Telescope | Observer222Observers: DD = David Doss, GG = Guillermo Gonzalez, AH = Artie P. Hatzes, CRJ = C. Renée James, CJK = Chris Johns- Krull, REL = R. Earle Luck, KR = Klaus Reinsch, JT = Jocelyn Tomkin, VW = Vincent Woolf | Comments333This gives wavelength interval in Å for the 2.1m spectra. | ||
|---|---|---|---|---|---|---|---|
| 1995 | Jan 24 | 9742.01 | 5.9 | 2.1m | GG | 5720 - 7225 | |
| Feb 20 | 9768.97 | 5.9 | 2.1m | AH | 5590 - 7040 | ||
| Feb 23 | 9771.92 | 5.9 | 2.1m | AH | 5990 - 6960 | ||
| Mar 17 | 9793.96 | 5.9 | 2.1m | AH | 5990 - 6960 | ||
| Mar 19 | 9796.02 | 5.9 | 2.1m | AH | 5990 - 6960 | ||
| Mar 20 | 9797.00 | 5.9 | 2.1m | AH | 5990 - 6960 | ||
| Apr 14 | 9821.80 | 5.9 | 2.1m | REL/VW | 5720 - 7225 | ||
| Apr 18 | 9825.81 | 5.9 | 2.1m | GG | 5720 - 7225 | ||
| Apr 21 | 9828.78 | 5.9 | 2.1m | GG | 6280 - 8400 | ||
| May 15 | 9852.85 | 5.9 | 2.1m | GG | 5760 - 7300 | ||
| May 18 | 9855.82 | 5.9 | 2.7m | JT | |||
| May 21 | 9858.80 | 5.9 | 2.1m | VW | 3930 - 4275 | ||
| May 22 | 9859.70 | 5.9 | 2.1m | VW | 3930 - 4275 | ||
| Jun 10 | 9878.64 | 5.9 | 2.1m | GG | 5720 - 7225 | ||
| Jun 17 | 9885.64 | 5.9 | 2.7m | JT | |||
| Jun 19 | 9887.68 | 5.9 | 2.7m | JT | |||
| Jun 23 | 9891.69 | 5.9 | 2.1m | GG | 5760 - 7230 | ||
| Aug 7 | 9936.61 | 5.9 | 2.7m | JT | |||
| Aug 8 | 9937.62 | 5.9 | 2.7m | JT | |||
| Aug 9 | 9938.61 | 5.9 | 2.7m | JT | |||
| Sep 30 | 9990.62 | 6.1 | 2.7m | JT | |||
| Oct 2 | 9992.64 | 6.3 | 2.7m | JT | |||
| Oct 7 | 9997.58 | 6.8 | 2.1m | REL | 4880 - 5650 | ||
| Oct 8 | 9998.56 | 6.9 | 2.1m | REL | 4880 - 5650 | ||
| Oct 9 | 9999.56 | 7.0 | 2.1m | REL | 5720 - 7225 | ||
| Oct 11 | 10001.56 | 7.1 | 2.1m | REL | 5720 - 7225 | ||
| Oct 12 | 10002.55 | 7.3 | 2.1m | REL | 6550 - 8550 | ||
| Oct 13 | 10003.59 | 7.7 | 2.7m | JT | |||
| Oct 14 | 10004.56 | 8.0 | 2.7m | JT | |||
| Oct 15 | 10005.55 | 8.4 | 2.7m | JT | |||
| Oct 16 | 10006.61 | 8.8 | 2.1m | KR | 4460 - 5040 | ||
| Oct 17 | 10007.56 | 9.6 | 2.1m | KR | 4460 - 5040 | ||
| Oct 18 | 10008.56 | 10.1 | 2.1m | KR | 4460 - 5040 | ||
| Oct 18 | 10008.56 | 10.1 | 2.7m | DD | |||
| Nov 2 | 10023.54 | 12.2 | 2.7m | CRJ | |||
| Nov 12 | 10033.54 | 13.4 | 2.1m | CJK | 5760 - 7225 | ||
| Nov 14 | 10035.54 | 13.5 | 2.1m | CJK | 5760 - 7225 | ||
| Nov 15 | 10036.54 | 13.5 | 2.1m | CJK | 5760 - 7225 |
| Date | JD - 2440000.0 | Mag.444Visual magnitude from AAVSO. V (given to second decimal from Fernie (1997) and Efimov (1997). | Telescope | Observer555Observers: GG = Guillermo Gonzalez, AH = Artie Hatzes, SLH = Suzanne Hawley, CRJ = C. Renée James, CJK = Chris Johns- Krull, DLL = David L. Lambert, JT = Jocelyn Tomkin | Comments666This gives wavelength interval in Å for the 2.1m spectra. | ||
|---|---|---|---|---|---|---|---|
| 1996 | Jan 5 | 10088.00 | 13.57 | 2.7m | JT | ||
| Jan 19 | 10101.98 | 13.2 | 2.1m | GG | 5570 - 6780 | ||
| Feb 1 | 10114.96 | 13.7 | 2.1m | CJK | 5760 - 7225 | ||
| Feb 6 | 10119.99 | 13.50 | 2.7m | JT | |||
| Feb 8 | 10122.01 | 13.6 | 2.7m | JT | |||
| Feb 9 | 10123.01 | 13.6 | 2.7m | JT | |||
| Mar 2 | 10144.95 | 13.45 | 2.7m | SLH/DLL | |||
| Mar 10 | 10152.99 | 13.5 | 2.1m | AH | 5020 - 5910 | ||
| Mar 13 | 10155.90 | 13.4 | 2.1m | AH | 5020 - 5910 | ||
| Apr 9 | 10182.75 | 12.47 | 2.1m | GG | 5510 - 6790 | ||
| May 3 | 10206.90 | 10.8 | 2.7m | DLL | |||
| May 4 | 10207.88 | 10.7 | 2.7m | DLL | |||
| May 5 | 10208.85 | 10.40 | 2.7m | DLL | |||
| May 6 | 10209.85 | 10.5 | 2.7m | DLL | |||
| May 9 | 10212.82 | 10.07 | 2.1m | GG | 5720 - 7220 | ||
| May 31 | 10234.78 | 8.93 | 2.1m | CRJ | 5720 - 7300 | ||
| Jun 4 | 10238.77 | 8.88 | 2.1m | AH | 5840 - 7360 | ||
| Jun 5 | 10239.63 | 8.85 | 2.1m | AH | 5990 - 7820 | ||
| Jun 25 | 10259.72 | 8.1 | 2.1m | GG | 5480 - 6780 | ||
| Jul 8 | 10272.73 | 8.0 | 2.7m | CRJ | |||
| Jul 23 | 10287.65 | 7.4 | 2.7m | DLL | |||
| Jul 24 | 10288.61 | 7.5 | 2.7m | DLL | |||
| Jul 26 | 10290.64 | 7.5 | 2.7m | DLL | |||
| Oct 2 | 10358.55 | 7.0 | 2.7m | DLL | 5880 - 5902 |

At the 2.7m telescope, the coudé cross-dispersed echelle spectrograph (Tull et al. 1995) was used with the camera that gives a maximum (2-pixel) resolving power of R =. The detector was a Tektronix 2048 2048 CCD. The recorded spectrum ran from about 3800Å to 10000Å, but spectral coverage was incomplete longward of about 5500Å. A Th-Ar hollow cathode lamp providing a wavelength calibration was observed either just prior to or just after exposures of R CrB. The pixel-to-pixel variation of the CCD was removed using observations of a lamp providing a continuous spectrum. Typical exposure times for R CrB in decline were 30 minutes with multiple exposures co-added as necessary to improve the signal-to-noise ratio of the final spectrum. Occasionally, an early-type rapidly-rotating star was observed to provide a template of the telluric absorption lines.
The Sandiford Casségrain echelle spectrometer (McCarthy et al. 1993) was used at the 2.1m telescope. These spectra have a resolving power also of approximately R=60,000. Although the wavelength coverage at a single exposure (see Table 1) is less extensive than at the 2.7m, orders of the echelle are completely recorded for wavelengths shorter than about 7500Å. Calibration procedures were the same as for the 2.7m telescope.
| Date | U | B | V | R | I | |
|---|---|---|---|---|---|---|
| 1995 | Oct 18 | 10.0 | 10.5 | 10.1 | 9.6 | 9.0 |
| Nov 2 | 12.59 | 12.79 | 12.02 | 11.52 | … | |
| 1996 | Jan 5 | 13.67 | 14.05 | 13.57 | 13.05 | 12.07 |
| Feb 6 | 13.50 | 14.00 | 13.50 | 13.02 | 11.75 | |
| Mar 2 | 13.45 | 13.92 | 13.45 | 12.78 | 11.40 | |
| Apr 9 | 13.15 | 13.35 | 12.47 | 11.50 | 10.38 | |
| May 5 | 12.13 | 11.67 | 10.40 | 9.50 | 8.68 |
Our spectra were not flux calibrated at the telescope. An adequate calibration is possible using sets of observed UBVRI magnitudes (kindly supplied by Yu. S. Efimov and by J. Fernie) in which we interpolate to the dates of our observations. For spectra obtained early in the decline UBVRI magnitudes are unavailable. In these cases, we identified the visual magnitude as the V magnitude. Colors for these early observations were taken from UBVRI measurements on earlier declines of R CrB with a similar rate of decline. The range in colours from one decline to another is small and not a major source of uncertainty. Adopted UBVRI magnitudes are given in Table 2 for selected dates. Fluxes were computed from these magnitudes using Wamsteker’s (1981) calibration. Clayton et al. (1997) published a flux calibrated low resolution spectrum taken 1996 April 7. Our derived fluxes for 1996 April 9 are in good agreement with these published values.
3 Maximum Light
R CrB is known to be variable at maximum light. Photometric monitoring of R CrB principally by Fernie and colleagues is providing ample evidence of a continuous quasi-regular variation in light (Fernie 1989, 1991, 1995, 1997; Fernie & Seager 1994). Variability of the absorption line spectrum was detected long ago (Espin 1890). Recent observations at low (Clayton et al. 1995) and high spectral resolution (Rao & Lambert 1997) have begun to detail the changes.
3.1 Photospheric Radial Velocity
Our measurements of the photospheric radial velocity are based on a selection of 20 to 30 lines that we divide into two groups. Group A comprises high-excitation weak lines of N i, O i, Al ii, and S i. Group B is made up of strong lines of C i, O i, Si ii, Ca i, K i, Cr ii, and Ba ii. Velocities are derived from the central core of a line. Table 3 and Fig. 1 summarize these measurements covering 558 days from about 8 months before the decline to near complete recovery to maximum light.
At maximum light, the mean velocity of 22.5 km s-1 and the range of 6 km s-1 from observations made between 1995 January and 1995 August are the expected values for the star based upon earlier studies (cf. Raveendran, Ashoka & Rao 1986; Fernie & Lawson 1993; Rao & Lambert 1997). Throughout this interval, group A and B lines give the same velocity.
The historical data on R CrB’s radial velocity were searched for a dominant period. We collated radial velocity measurements based on spectra of coudé dispersion - see Keenan & Greenstein (1963), Rao (1974), Fernie et al. (1972), Gorynya et al. (1992), Fernie & Lawson (1993), and Rao & Lambert (1997). The set comprises 149 measurements from 1942 to 1995 when the star was not in decline. The dominant source of velocity variations is, of course, the atmospheric pulsation. Our periodogram analysis indicated a pulsation period near 42.7 days. Experimentation with periods around this value suggest that a period of 42.6968 days, a mean velocity of 22.5 km s-1, and a range of 6 km s-1 provides the best fit to the measurements over the half-century. Several investigators have mentioned that the pulsational period is not strictly constant; a particular value may represent the photometric data for an interval of one to two years. Slight variations of this period or small phase shifts seem to be indicated. For example, if the earliest measurements assembled by Keenan & Greenstein (1963) are dropped, the best-fitting period is lengthened slightly to 42.7588 days.
In Fig. 1, we show the measured velocities: filled circles denote either the mean velocity of group A and B lines where there is no significant difference between the two groups or the velocity of the A lines where there is a significant difference, and the open squares denote group B velocities where they differ from the A velocities by more than 2 km s-1. The line is the ‘historical’ sine curve with a period of 42.6968 days and a range of 6 km s-1 around a mean velocity of 22.5 km s-1. (The difference between a period of 42.6968 and of 42.7588 days is unimportant over this short interval of time.) Observations prior to the onset of the decline are closely matched by the sine curve.
Both group A and B lines depart in different ways from this curve at the onset but the difference between group A and B lines disappears after a few days. Then, the radial velocity shown by photospheric (group A and B) lines is systematically more positive throughout the deepest part of the decline than predicted by the sine curve. These deviations occur at a time when the absorption lines have very unusual profiles. Lines unaffected by emission show shallow asymmetric profiles quite unlike photospheric profiles seen at maximum light. These changes and the marked redshift are attributed to scattering of photospheric light by R CrB’s dusty envelope (Sec. 9.3). We presume that the obscured photosphere pulsated throughout according to the sine curve shown in Fig. 1. The two measurements from late in the recovery match well the predicted sine curve showing that the pulsation after the decline followed the ephemeris that matched the pre-decline observations. These observations indicate that, except for the photospheric disturbance at the onset (Sec. 4), the photosphere pulsated oblivious to the cloud of soot obscuring it from our view.
| Date | JD-2440000 | Line Selection777Velocity V is given in km s-1 followed by the number of lines n. | |||||
| All | Group A | Group B | |||||
| V | n | V | n | V | n | ||
| 1995 Jan 24 | 9742.01 | 21.2 | 22 | 21.0 | 9 | 21.3 | 13 |
| Feb 20 | 9768.97 | 24.3 | 16 | 24.0 | 9 | 24.7 | 7 |
| Feb 23 | 9771.92 | 25.4 | 17 | 25.1 | 9 | 25.8 | 8 |
| Mar 17 | 9793.96 | 20.1 | 17 | 19.8 | 9 | 20.5 | 8 |
| Mar 19 | 9796.02 | 21.4 | 15 | 20.4 | 7 | 22.3 | 8 |
| Mar 20 | 9797.00 | 21.3 | 14 | 20.3 | 7 | 22.4 | 7 |
| Apr 14 | 9821.80 | 23.8 | 22 | 22.5 | 9 | 24.7 | 13 |
| Apr 18 | 9825.81 | 26.6 | 24 | 25.1 | 11 | 28.0 | 13 |
| Apr 21 | 9828.78 | 23.2 | 22 | 21.6 | 10 | 24.6 | 12 |
| May 15 | 9852.85 | 24.1 | 24 | 22.5 | 10 | 25.0 | 14 |
| May 18 | 9855.82 | 24.3 | 25 | 23.7 | 10 | 24.7 | 10 |
| May 21 | 9858.80 | 25.3 | 3 | … | … | 25.3 | 3 |
| May 22 | 9859.70 | 25.6 | 2 | … | … | 25.6 | 2 |
| Jun 10 | 9878.64 | 19.7 | 21 | 19.2 | 21 | 20.0 | 13 |
| Jun 17 | 9885.64 | 21.0 | 27 | 20.2 | 10 | 21.4 | 17 |
| Jun 19 | 9887.68 | 21.2 | 26 | 20.6 | 12 | 21.4 | 14 |
| Jun 23 | 9891.69 | 21.0 | 21 | 19.8 | 10 | 21.8 | 11 |
| Aug 7 | 9936.61 | 21.5 | 26 | 20.9 | 12 | 22.0 | 14 |
| Aug 8 | 9937.62 | 22.8 | 26 | 22.0 | 11 | 23.0 | 15 |
| Aug 9 | 9938.61 | 23.7 | 29 | 23.2 | 13 | … | … |
| Sep 30 | 9990.62 | … | … | 19.9 | 13 | 24.8 | 16 |
| Oct 2 | 9992.64 | … | … | 22.6 | 12 | 26.4 | 16 |
| Oct 7 | 9997.57 | … | … | … | … | … | … |
| Oct 8 | 9998.55 | … | … | … | … | … | … |
| Oct 9 | 9999.56 | … | … | 18.8 | 7 | 24.8 | 10 |
| Oct 11 | 10001.55 | … | … | 18.7 | 9 | 27.3 | 11 |
| Oct 12 | 10002.55 | … | … | 19.4 | 9 | 29.9 | 7 |
| Oct 13 | 10003.59 | 22.9 | 26 | 17.9 | 13 | 29.5 | 12 |
| Oct 14 | 10004.56 | 14.9 | 16 | 14.6 | 14 | 17.0 | 2 |
| Oct 15 | 10005.55 | 15.0 | 16 | 14.8 | 14 | 15.9 | 2 |
| Oct 18 | 10008.56 | 14.4 | 14 | 14.0 | 13 | 13.5 | 1 |
| Nov 2 | 10023.54 | 15.0 | 15 | 16.0 | 11 | 14.0 | 4 |
| Nov 12 | 10033.54 | 15.8 | 5 | 15.3 | 2 | 16.9 | 3 |
| Nov 14 | 10035.54 | 13.6 | 2 | … | … | 13.6 | 2 |
| Date | JD-2440000 | Line Selection888Velocity V is given in km s-1 followed by the number of lines n. | |||||
| All | Group A | Group B | |||||
| V | n | V | n | V | n | ||
| 1996 Jan 5 | 10088.00 | 32.8 | 13 | 33.6 | 5 | 32.3 | 8 |
| Jan 19 | 10101.97 | 37.0 | 5 | 35.7 | 2 | 37.9 | 3 |
| Feb 1 | 10114.96 | 28.1 | 5 | 26.9 | 4 | 27.8 | 1 |
| Feb 6 | 10119.99 | 26.5 | 9 | 26.5 | 9 | … | … |
| Feb 8 | 10122.01 | 31.4 | 8 | 31.8 | 3 | 31.2 | 5 |
| Feb 9 | 10123.01 | 30.4 | 8 | 29.7 | 4 | 30.4 | 4 |
| Mar 2 | 10144.95 | 30.6 | 10 | 30.8 | 7 | 29.9 | 3 |
| Mar 10 | 10152.99 | 34.0 | 3 | … | … | 34.0 | 3 |
| Mar 13 | 10155.90 | 34.5 | 2 | … | … | 34.5 | 2 |
| Apr 9 | 10182.74 | 28.5 | 10 | 28.6 | 5 | 27.9 | 5 |
| Apr 9 | 10182.77 | 28.3 | 13 | 27.2 | 5 | 29.3 | 8 |
| May 3 | 10206.90 | 28.7 | 13 | 28.5 | 8 | 29.0 | 5 |
| May 4 | 10207.88 | 29.1 | 19 | 28.4 | 10 | 29.9 | 10 |
| May 5 | 10208.85 | 29.5 | 19 | 29.2 | 9 | 29.8 | 10 |
| May 6 | 10209.85 | 29.3 | 19 | 29.0 | 9 | 29.5 | 10 |
| May 9 | 10212.82 | 25.5 | 13 | 24.5 | 7 | 26.7 | 6 |
| May 9 | 10212.83 | 25.5 | 19 | 24.4 | 7 | 26.2 | 12 |
| May 31 | 10234.78 | 20.5 | 19 | 21.1 | 7 | 20.2 | 12 |
| Jun 4 | 10238.77 | 21.5 | 19 | 21.6 | 7 | 21.4 | 12 |
| Jun 5 | 10239.63 | 21.9 | 24 | 21.9 | 10 | 21.9 | 14 |
| Jun 25 | 10259.72 | 23.1 | 13 | 21.9 | 7 | 24.8 | 6 |
| Jul 8 | 10272.73 | 20.3 | 22 | 21.6 | 7 | 19.7 | 15 |
| Jul 23 | 10287.65 | 17.1 | 25 | 15.8 | 10 | 18.1 | 15 |
| Jul 24 | 10288.61 | 16.4 | 22 | 15.0 | 11 | 17.8 | 11 |
| Jul 26 | 10290.64 | 16.0 | 14 | 15.4 | 8 | 17.3 | 6 |
3.2 Sharp Emission Lines at Maximum light
At maximum light, strong low excitation lines of neutral atoms and singly-charged ions show an apparent doubling in their absorption cores, as first seen by Payne-Gaposchkin (1963), and Keenan & Greenstein (1963) and confirmed from high-resolution CCD spectra by Lambert et al. (1990). The doubling is considered to result from the superposition of an emission component on the photospheric absorption core. Our present spectra confirm that the emission is probably a permanent feature at maximum light. An excellent spectrum obtained on 1995 May 18 clearly shows emission in Sc ii 4246Å, Sr ii 4077 and 4215Å, the Na i D lines, and the Ca ii infrared triplet lines, representing the emission spectrum E2. The emission is at a velocity of 18 1 km s-1 or shifted to the blue by about 5 km s-1 relative to the photosphere’s systemic velocity. Fig. 2 shows the Sc ii 4246Å line on three occasions in 1995 prior to the decline, two occasions right at the onset of the decline, and when the star had faded by about 1.6 magnitudes. The emission core is present prior to onset with an intensity that appears slightly variable but this variation may reflect a varying continuum flux resulting from the pulsation. Emission at the same velocity is striking in the 1995 October 13 spectrum. Continuing the sequence, Fig. 3 shows the May 18 maximum light spectrum, the October 13 spectrum, and the October 18 spectrum when the star had faded by 4 magnitudes. On this latter spectrum, weaker emission is clearly present in all the photospheric lines in this region. Incipient emission is present affecting these lines in the October 13 spectrum shown in Figure 2.
Our inference is that sharp emission lines are a permanent presence. As we show below, these sharp emission lines are of constant velocity, unreddened, and of constant flux until the photosphere is dimmed by about 4 magnitudes. These are surely clues to the location of the lines’ emitting region.


4 The Onset of the Decline - Photospheric Activity
Our spectra reveal remarkable changes in high-excitation photospheric lines over a fortnight’s interval beginning with the onset of the decline. It seems probable that the changes betray information about the mysterious trigger of an RCB decline. In particular, this discovery sites the trigger in the star’s photosphere and eliminates some ideas about the cause of the decline: i.e., the decline is not brought on by passage of a circumstellar cloud across the disk of the star, or by spontaneous condensation of soot in the cool outer reaches of the atmosphere.
The changes are well illustrated in Figure 4 showing comparisons of the spectra obtained on 1995 September 30 and 1995 August 9. On September 30 R CrB remained close to maximum light but by October 2, the date on which the next spectrum was acquired, it had begun to fade. Beginning with the September 30 spectrum, there is a clear velocity difference (Table 3, Fig. 1) between the group A and B photospheric lines, as measured from their line cores. Unfortunately, it is not possible to date precisely the onset of this velocity difference except to note that it was not present from August 7 to 9. The difference increased almost monotonically from about 5 km s-1 on 1995 September 30 to about 12 km s-1 by 1995 October 13 when the star had faded to V 7.7. Since the group B lines are formed closer to the surface than the group A lines, we infer that shallower photospheric layers were falling in towards the deepest visible layers at velocities in excess of the sound speed ( km s-1). Shortly after October 13, emission appears in the core of a group B line (Fig. 4). Transition from a broader than usual absorption line to an emission line in the wing of an absorption line occurred between 1995 October 9 and 13. Emission persisted to just prior to 1995 November 2 (V) when the profiles of group B lines again resembled photospheric lines observed near maximum light, and the velocity difference between group A and B lines was less than 2 km s-1 with a mean velocity blue-shifted by about 8 km s-1 relative to the systemic velocity. These emission lines belong to the class of E1 lines.

In late September, the photospheric velocities according to the 42.6968 day sine curve should have been close to their maximum value of about 26 km s-1. Lines of group B, the strong to very strong lines of C i, O i, and other species, are close to the expected velocity but lines of group A, high excitation weak lines of N i and other species, are blue-shifted with respect to the predicted maximum velocity. Group B lines on September 30 are are also broadened relative to their August 7 profiles and to the group A profiles in this early phase of the decline. For all lines, the red wing remains at about the same velocity but there is additional absorption on the blue side of group B lines. In contrast, the group A profiles are largely unchanged, although shifted in velocity. Although the group B lines later show an emission component, it is unlikely that these differences in profile are initially or solely due to emission altering an underlying unchanging absorption profile because the equivalent widths of the affected lines are larger in September 30 than in August 9. The profile changes during onset of the decline are considerably more extreme than those occuring during regular pulsations at maximum light (Rao & Lambert 1997).
These emission lines associated with the onset – the ‘transient’ or E1 lines – are to be distinguished from the sharp emission (E2) lines present in and out of a decline. A distinguishing feature of the onset-related or transient emission lines is their large range of excitation potential. At the top end are lines with lower excitation potential in the range 6.5 to 9.5 eV. Such lines are not contributors of sharp (E2) lines. Lines of lower excitation potential are blends of a transient and a sharp line and include Li i, Ca i, Fe ii, Ni i, and La ii transitions. Another notable contributor of transient but not sharp lines is the C2 Swan system (see below). Significantly, group A lines do not appear in emission. The fluxes of the C i transient emission lines provide an estimate of the excitation temperature. The strongest lines are optically thick in that lines from the same multiplet do not scale with the gf-values of the lines. Lines that do appear to be optically thin suggest an excitation temperature of about 8400K. This temperature is definitely higher than that estimated from the sharp emission lines. The velocity of the transient C i emission lines is 20 to 30 km s-1, i.e, a velocity between that of the group A absorption lines and the red-shifted absorption component accompanying transient emission lines.
On 1995 October 18 almost all lines showed a red absorption component or an inverse-P Cygni profile.999Inverse P Cygni profiles for low excitation lines were observed by Vanture & Wallerstein (1995) on a spectrum of RY Sgr taken during the recovery from its 1993 deep minimum. High excitation lines were not seen in this spectrum. Fig. 5 is a montage of emission lines with the red-shifted absorption indicated. Many lines are a blend of transient and sharp emission components at a very similar velocity. The red absorption component is not a portion of the photospheric line not filled in by emission. This assertion is based on the fact that the full array of lines gives the same velocity for this component: 43 km s-1 from 90 lines or a red shift of 30 km s-1 with respect to the mean velocity of group A and B lines or 20 km s-1 relative to the photosphere’s systemic velocity. If the red absorption were a residual of the photospheric line, we would expect the apparent velocity to vary with the strength of the overlying emission. More significantly, the depth of the red absorption for many lines is deeper than the photospheric line depth at the same velocity from the line core, as clearly seen in the Ba ii 5854Å line (Fig. 6). The red-shifted absorption is also a transient phenomenon and by 1995 November 2 had disappeared.
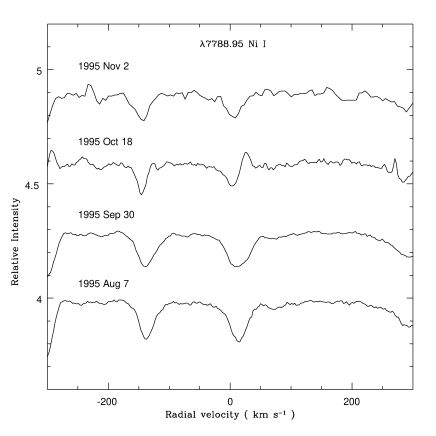
Curiously, a few lines, e.g., Ni i 7789 Å (Fig. 7), exhibit a P Cygni profile with the absorption component at the photospheric velocity. Oddly, P Cygni profiles appear restricted to a few Ni i multiplets and high multiplets of Fe i (e.g., RMT1107). The P Cygni profile was not seen on or after 1995 November 2. The difference between P Cygni and inverse P Cygni profiles could be due to a velocity differential between the layer providing the absorption line and that providing the emission line. Since the latter appears at about the same velocity for all lines, the absorption line is shifting such that weak lines (e.g., Ni i) formed at the top of the photosphere are blue-shifted relative to lines formed deeper in the atmosphere (e.g., O i): the velocity shifting to more positive velocities for lines formed at shallower depths in the photosphere.


An additional absorption component is seen in the strong Na i D lines following the onset of the decline. In addition to changes in their photospheric profiles, the Na i D lines showed on 1995 September 30 additional absorption in their blue wing (Fig. 8). (Similar changes occurred in the Ca ii infrared triplet lines.) This absorption which appears to be a narrow component is at about -3 km s-1 or blue-shifted by nearly 30 km s-1 relative to the anticipated photospheric velocity.

Our spectra show that membership in the E1 class of emission lines must be extended to include high-excitation lines of C i, O i, and other species.101010Some earlier reports based on photographic spectra did note a filling in of C i lines in the blue but red lines were not observed photographically. Our spectra show transient weak emission cores in the stronger C i lines in the blue (e.g., RMT6 at 4762-4776Å). The primary factor behind the evolution of the E1 spectrum is the changing physical conditions in the emitting regions and not the occultation of these regions by the developing dust cloud. The mix of line profiles from P Cygni to inverse P Cygni is difficult to understand if occultation by remote dust is dominant but more readily understood if the transient lines are emitted by atmospheric layers experiencing shocks. Emission in the high-excitation lines lasts a brief while. At its disappearance, the absorption profiles are returned to their pre-decline condition (see below) because, we suggest, the disturbed atmospheric layers have relaxed to approximately their normal state. If occultation by the fresh dust cloud were to control the transient lines’ appearance, it would be necessary to suppose that the optical depth to the photosphere were less than that to the lines’ emitting region. This seems unlikely. Moreover, shock excited C i emissions are present in RY Sgr during its pulsation cycle (Cottrell & Lambert, unpublished observations) at maximum light, similar to the emissions seen above. If future observations show that behaviour of high-excitation lines in 1995 was typical of all declines, an explanation in terms of occultation by dust will be excludable.
5 R CrB around Minimum Light – The Sharp Emission Line Spectrum
5.1 Introduction
After 1995 November 2 (V = 12.2), the emission line spectrum comprises low excitation lines of mainly singly-ionized metals. Representative line profiles are shown in Fig. 5 for 1995 October 18: the C i 8335Å line is a transient line, but lines such as Fe i 5405 and 5371Å are sharp lines. Evolution of the emission line spectrum is shown by Fig. 9 and 10.


The sharp emission lines appear composed of two or three components which we label C1, C2, and C3 in order of increasing velocity. The lines are resolved; instrumental (FWHM) width as measured from the Th comparison lines is about 5 km s-1 but the C2 component has a FWHM of about 14 km s-1. The emission lines are not broader than the same lines in absorption at maximum light: the base width of the emission and absorption lines are both about 40 km s-1. The principal component (C2) is at 20 km s-1 or displaced by - 3 km s-1 from the systemic velocity. This shift is slightly smaller than reported at earlier declines for R CrB and RY Sgr.
5.2 Forbidden Lines
In all previous discussions of the sharp emission line spectrum of R CrB stars in decline, identified lines were exclusively permitted lines. Indeed, permitted lines comprise the vast majority of sharp lines in our spectra. Searches for forbidden lines, where reported, were described as unsuccessful. Since forbidden lines may provide data on physical conditions in the emitting gas, we searched for a variety of forbidden lines.
We have identified sharp forbidden lines for the first time. Identifications include [C i] 8727, 9823, and 9850Å, [O i] 5577, 6300, and 6363 Å, and [Ca ii] 7291 and 7323Å.111111[Ca ii] lines had been identified previously in the 1977 decline of R CrB (Herbig 1990) and in RY Sgr by Asplund (1995) but the spectral resolution did not permit a clear differentiation between sharp and broad emission in these lines. The [O ii] 3727Å must have been present but our spectra have too low a S/N ratio at that wavelength. , and several detections of [Fe ii] lines. Forbidden lines have the profile (component structure) and the velocity of the permitted sharp lines.
[C i]. The 9850Å [C i] line was seen first on 1995 October 13 and was last seen on 1996 May 5. The excited 8727Å line was present on 1995 October 13 but unfortunately later spectra did not include this wavelength region. The estimated flux ratio for 1995 October 13 is F(8727)/ [F(9850) + F(9823)] = 2.4 0.3 where the contribution of the 9823Å line is estimated from that of 9850Å and the known branching ratio.
[O i]. The lines 6300, 6363, and 5577Å are present. The 6363Å line (Fig. 5) was first seen on 1995 October 15, and like the [C I] 9850Å line was present throughout the decline. We estimate that the flux ratio [F(6300) + F(6363)]/f[5577] throughout the decline.
[Ca ii]. The 7291Å and 7323Å lines are the strongest forbidden lines that are sharp (Fig. 11). Strong sharp components seen for the two forbidden lines and the permitted infra-red triplet are superimposed on weak broad emission lines. Relative fluxes in the forbidden and the permitted infra-red and H/K lines are discussed below.

[Fe ii]. Unsuccessful searches for [Fe ii] lines were reported from photographic spectra by Herbig (1949) and Payne-Gaposchkin (1963) for R CrB in decline, and by Alexander et al. (1972) for RY Sgr. Our spectra show weak [Fe ii] emission lines from 1995 October 18 to 1996 February 6. Fig. 12 shows three lines from the 1996 February 6 spectrum. Radial velocities of the lines coincide with that of the central component of the permitted lines. The flux ratio of forbidden to permitted lines evolved with the former becoming relatively stronger until about the middle of the deepest part of the decline. For example, the flux ratio of the 4244Å [Fe II] to the 4233Å Fe II lines increased from 0.008 on 1995 October 18, to 0.13 on 1995 November 13, and to 0.45 on 1996 February 6.

5.3 Evolution of Sharp Emission Lines
Our extensive coverage - temporal and spectroscopic - encouraged us to examine fully the rich sharp line spectrum. Prior to 1995 October 18 and after 1996 May 5, the emission was too weak for reliable measurement and, where present, superimposed on a photospheric line. Observed line profiles were decomposed into their 2 or 3 components, assumed here to be gaussian in form, and equivalent width, FWHM, and velocity were measured using IRAF routines for each component. As far as possible, the same lines were measured on each spectrum from 1995 October 18 to 1996 May 5. Decomposition of a complex profile implies perhaps that each component is physically distinct. This is not necessarily so as the emitting region may be a single geometrical structure with three dominant regions in relative motion. Since the C2 and C3 and possibly the C1 components are present throughout at fixed relative velocities, the structures they represent would appear to be physically related in some sense, e.g., cloudlets on a uniformly expanding or rotating ring.
The dataset is applied to answering the following questions relating to the appearance of the sharp emission lines:
-
•
By how much are the components reddened? Obviously, some reddening is interstellar and some circumstellar in origin. Detection of a difference in the reddening of different components or a change during the decline would be exciting clues to the relative location of gas and dust.
-
•
What are the components’ velocities? Is there a change in velocity during the decline? Do the radial velocities and line widths vary systematically with the type of the line, i.e., neutral atom or singly-charged ion, low or high upper state excitation potential? Demonstrable variations or the lack of them are clues to the relative locations of the emitting gas and the freshly made dust.
-
•
How do the fluxes of the components change during the decline? Is there a reduction in flux that is correlated with the fading of R CrB during the decline? Again, these measurements offer clues to the locations of emitting gas and absorbing dust.
-
•
What are the physical conditions of the emitting regions? Estimates of temperature and electron density are provided fairly directly from relative fluxes of small or large sets of the emission lines.
The answers to these questions provide clues to the location of the emitting gas in and around R CrB, as we discuss in Section 9.5.
5.3.1 Reddening
In decline, the reduction in flux from the photosphere of a R CrB star is largest in the blue and least in the red (cf. Clayton 1996). This observation implies not unexpectedly that photospheric radiation is dimmed and reddened by small dust particles. Significantly, the emission lines appear to be unaffected by this reddening (cf. Clayton 1996). In the case of R CrB, Payne-Gaposchkin (1963) commented “the chromosphere has continued to decline in brightness but is affected slightly (if at all) by the reddening that alters the energy distribution”. An interpretation of this result is that an optically thick dust cloud partially obscures the emitting region; the observed emission comes from the unobscured (i.e, unreddened) parts of the emitting region. Of course, the sharp emission lines are subject to interstellar and circumstellar reddening but this has been shown to be small for R CrB: EB-V 0.05 mag. (Rao 1974; Asplund et al. 1997).
Here, we examine whether the different emission line components are affected by reddening. We exploit the fact that our spectra provide several cases of lines at rather different wavelengths arising from the same upper level. Then, there is a simple relation between the emission line fluxes of pairs of optically thin lines
| (1) |
where Wλ is the equivalent width of a line, F is the observed flux in the spectrum at the wavelength of the line having the wavelength , and A is the transition probability for spontaneous emission in the line.
| Ratio | Predicted | Observed ratio | |||||||||||||
| () | ratio | Date | |||||||||||||
| 95 Oct 18 | 95 Nov 2 | 96 Jan 5 | 96 Feb 6 | 96 Mar 2 | 96 May 5 | ||||||||||
| C1 | C2 | C3 | C2 | C3 | C1 | C2 | C3 | C2 | C3 | C1 | C2 | C3 | C2 | ||
| 6492/4341 | 0.42 | … | 0.48 | … | 0.21 | … | … | 0.35 | … | 0.42 | … | … | … | … | 0.37 |
| 8979/4341 | 0.10 | … | 0.09 | … | … | … | … | … | … | … | … | … | … | … | … |
| 5189/4533 | 0.28 | … | … | … | 0.42 | 0.28 | 0.24 | 0.43 | 0.31 | … | … | 0.54 | 0.33 | 0.32 | … |
| 6491/4534 | 0.022 | … | … | … | 0.03 | … | … | 0.05 | … | … | … | 0.10 | 0.04 | … | 0.10 |
| 6491/5189 | 0.08 | … | … | … | 0.07 | … | … | 0.11 | … | 0.12 | 0.07 | 0.19 | 0.13 | 0.06 | 0.22 |
| 5129/5186 | 1.05 | 0.99 | 0.82 | 1.28 | … | … | … | … | … | 0.91 | 1.20 | 1.00 | 1.05 | 1.10 | … |
A set of Ti ii lines was chosen. Accurate transition probabilities were taken from Martin, Fuhr, & Wiese (1988). Flux ratios of red to blue lines from the same upper state were estimated and are compared in Table 4 with the predicted ratios for unreddened optically thin lines. When the Ti ii lines were resolvable into 2 or 3 components, the observed ratio was estimated separately for each component. Inspection of Table 4 shows that the observed ratios are fairly consistent with these predictions that assume no reddening. The conclusion is clear. Emission lines are very little reddened by the soot causing the decline: the limit E mag may be set. Note that the photometric colours changed very little until late in the decline: Table 2 shows (B - V) from 1995 October 18 to 1996 March 2 increasing to 0.9 and 1.3 on 1996 April 9 and 1996 May 5 respectively.
5.3.2 Radial Velocities
Radial velocities were measured for a large number of sharp emission lines. When possible, velocities of components C1, C2, and C3 were recorded along with the FWHMs. Measurements were grouped by species (neutrals and ions) and excitation potential of the emitting level (). Results are summarized in Table 5. Measurements for selected dates are shown as a function of in Fig. 13 for neutral atoms and Fig. 14 for singly-charged ions.
| Sharp Lines | Broad Lines | |||||||
| Date | JD | C1 | C2 | C3 | He I | He I | [N II] | |
| –2440000 | 7065Å | 3889Å | 6583Å | |||||
| 1995 Oct 18 | 10008.56 | 6.0 | 20.1 | 32.0 | -8.8 | … | … | |
| Nov 2 | 10023.54 | … | 19.3 | 35.0 | -7.9 | … | … | |
| Nov 12 | 10033.54 | … | … | … | -8.7 | … | -14.4 | |
| 1996 Jan 5 | 10088.00 | 9.0 | 19.0 | 33.5 | -2.6 | -5.6 | 1.1 | |
| Feb 6 | 10119.99 | … | 17.7 | 32.0 | -4.9 | -14.4 | -3.6 | |
| Feb 9 | 10123.01 | … | … | … | … | … | -14.8 | |
| Mar 2 | 10144.95 | 3.8 | 18.2 | 32.8 | -7.9 | -10.3 | … | |
| Apr 9 | 10182.74 | 8.5 | 18.0 | … | … | … | … | |
| May 5 | 10208.85 | 6.7 | 18.3 | 42.2 | … | 1.1: | … | |
The mean velocity of the central and often dominant C2 component is 18 km s-1 corresponding to a blueshift of about 4 km s-1 relative to the systemic velocity. When the components are well sampled, the velocity separation of C3 (red) from C2 (central) is 15 2 km s-1 and of C1(blue) from C2(central) is 11 2 km s-1. Thus, the separations of the outer components from the central one are approximately equal. Perhaps more importantly, the average velocity of the C1 and C3 components is the systematic velocity to within the errors of measurement. The absolute velocities evolve only slightly, if at all, from the first appearance of the emission lines to late in the recovery. The observed range in velocity of the C2 component is at most about 3 km s-1 (Table 5) declining from 20 km s-1 on 1995 October 18 to 18 km s-1 during and after the deepest part of the decline. A component’s radial velocity on a given date is the same for neutrals and ions and is independent of and line flux. A weak velocity gradient with may be present on occasions.


Neutral and ionized lines have similar FWHM on the same spectrum. Measurements of the ionized lines’ FWHM are summarized in Fig. 15. The few neutral lines suitable for measurement hint at a larger linewidth on occasions but this may reflect a bias in measuring broader and likely stronger neutral lines; the difference is not more than about 3 km s-1. The FWHM of C2 lines is the same for all lines independent of species and . The distribution of measurements off a single spectrum is consistent with a very narrow distribution of the intrinsic FWHMs. The mean FWHM of C2 varies very little from one observation to another and has a mean value of 10 to 14 km s-1 uncorrected for the instrumental broadening of nominally 5 km s-1. FWHM measurements for C1 and C3 show a broader distribution which reflects in part the difficulty of measuring these often weaker components. On average, their mean FWHM is similar to that of the C2 component but there are some real differences: C3’s FWHM is less than that of C2 on 1995 October 18, and the distribution of FWHM for C3 and possibly C1 is distinctly broader than for C2 during the deepest part of the decline (see Fig. 15 for 1996 January 5 and February 6).
5.3.3 Time-dependent Flux Variations
As Fig. 9 clearly shows a sharp line’s integrated flux does not decline in step with the diminution of the photospheric flux; a line’s equivalent width would remain constant in the event that line and photosphere were similarly affected. The difference between the two is striking. Measurements of selected lines show that the integrated flux of a line is approximately the same on 1995 October 18 as on the pre-decline maximum light spectrum of 1995 May 18 despite the fading from V = 5.9 to V = 10.1, a factor of 50. By 1995 November 2 and V = 12.2, the line flux had declined by 50% as the star had faded a factor of 330 from maximum light. At its faintest, the star was at V or a factor of 1100 below maximum light, yet the line flux had been reduced not to 0.09% of its 1995 October 18 value but only to 8% on 1996 January 6, 13% on 1996 February 6, and 22% on 1996 March 2. This increasing trend continued, reaching 30% on 1996 May 5. This extraordinary difference between ‘continuum’ and lines is a valuable clue to the relative locations of the obscuring soot cloud and the emitting region of the sharp lines. (Our use of photometric magnitudes to calibrate the continuum fluxes assumes that the lines in a photometric bandpass do not contribute an appreciable amount of flux. This is certainly the case for the V and R bandpasses.)
Inspection shows that flux ratio of the components C2, and C3 is not constant throughout the decline. At minimum light, the ratio C3/C2 is about 0.8 according to measurements of the spectra of 1996 January 5 and February 6. Spectra from early in the decline (1995 October 18 and November 2) and in the recovery phase (1996 April 9 and May 5) show a stronger C2 component with C3/C2 of about 0.3. The spectrum of 1996 March 2 gives an intermediate ratio of about 0.4. There is a hint in the measurements that the ratio C3/C2 is larger for lines of low . These results are well shown by the evolution of the Ba II 6142Å line (Fig. 10). The C1 component which is less clearly seen may retain a constant flux ratio C1/C2 over the entire decline.
5.4 Physical Conditions in the Emitting Region
Ratios of line fluxes provide estimates of the physical conditions (temperature and density) of the emitting gas. Since the line profiles are independent of species, the excitation potential, and similar across the collection of spectra, it is reasonable to suppose that the gas is reasonably homogeneous and that estimates obtained from one species are widely applicable.
Forbidden lines are well known diagnostics. For the interpretation of the [C i] and [O i] line ratios we use a program written by Surendiranath (private communication) based on collision strengths from Mendoza (1983). Temperature T 4000K and electron density ne cm-3 are indicated by the [C i] ratio given in Sec. 5.2. The corresponding [O i] ratio implies T K and ne cm-3. These results are in fair agreement considering that our spectra were not directly flux-calibrated. The emitting region is warm and fairly dense.
Fluxes of the permitted lines were analysed to obtain excitation temperatures. We considered the species Ti ii, Fe i, and Fe ii that are well represented by sharp emission lines and for which reliable transition probabilities are available. These were taken from Martin et al. (1988) for Ti ii, and from Lambert et al. (1996) for Fe i and Fe ii. We found that the lines were predominantly optically thin by checking that the fluxes of lines from the same upper level were proportional to the ratio of the lines’ transition probabilities. Lines were assumed to be unreddened. Excitation temperatures were derived by the procedure adopted by Pandey et al. (1996) for MV Sgr: a quantity F is derived from the line fluxes where
| (2) |
where is an emission line’s equivalent width, and is the flux in the continuum at the wavelength of the emission line. A Boltzmann plot of logF against excitation potential of the transition’s upper level has a slope that provides the reciprocal temperature = 5040/T where T is the excitation temperature. Sample Boltzmann plots are shown in Fig. 16 and 17.


The striking result is that the excitation temperatures appear to be roughly constant over the several months spanned by the observations. Component 2, the dominant one, has an excitation temperature near 4000K throughout the minimum. Component 3 may be systematically slightly cooler. Component 1 which is detectable in few lines has a temperature close to that of C2. The fact that lines spanning several eV in excitation energy and from three species define a single excitation temperature shows that this temperature is probably close to the kinetic temperature at a value confirmed by the [C i] line ratio and in fair agreement with that inferred from the [O i] lines.
Knowledge of the excitation temperatures enables the ratio of neutral to ionized iron densities to be estimated: e.g., Fe+/Fe = 103.3 and 103.5 for components C2 and C3 on 1996 February 6. There is essentially no change in these ratios over the duration of the decline. Application of Saha’s equation of ionization equilibrium to iron on the assumption that ionisation and excitation are described by the same temperature gives cm-3 to within a factor of a few. This range includes the estimate from the forbidden lines. An estimate of the total pressure is obtainable from an application of Saha’s equation to the ionization of carbon and the assumption that C/He = 1%: the gas pressure is approximately 0.03 dynes cm-2 and the gas density is about 2 g cm-3. These estimates are slight underestimates if partial ionization of carbon is suppressed and electrons are contributed by abundant metals. Extrapolated as an isothermal atmosphere, extension of the photosphere corresponding to log = 0.5 (Asplund et al. 1999) reaches the above gas pressure and density at about 10 scale heights or a mere 0.04 above the photosphere where the gas pressure is about 500 dynes cm-2 at Rosseland mean optical depth (Asplund et al. 1997) and is the stellar radius. Even if carbon is fully singly-ionized, the inferred height corresponds to only 0.05. Payne-Gaposchkin (1963) had earlier noted that the temperatures of the emitting region were a little cooler than the stellar temperature but the pressures were markedly less than photospheric values. (Clayton et al. (1992) claim T about 6000K and about cm-3 for V854 Cen. The temperature is consistent with ours, but our above estimated is substantially smaller. These estimates are derived from a set of lines that we would expect are a mix of sharp and broad lines. It is not clear what T and mean when sharp and broad lines are mixed up.) The observation that the sharp lines are not fully eclipsed by the fresh soot cloud, and the size estimates from the [Fe ii]/Fe ii flux ratios and from the absolute fluxes (see below) show that the emitting region cannot be right above the photosphere. Two interesting questions are obvious. Where around R CrB can one expect emitting gas at a relatively high pressure? Why are the regions immediately above the photosphere not seen in the spectrum?
An estimate of the radial distance is possible from the ratio of forbidden and permitted Fe ii lines. Viotti (1976) predicted the flux ratio of 4244Å [Fe ii] to 4233Å Fe ii. Essential radiative and collisional processes were included in the statistical equilibrium calculations. Undoubtedly, better atomic data are now available but these predictions may suffice to indicate the approximate distance for the region of formation. Viotti assumes that the region is irradiated by a photosphere at 10000K, a higher temperature than is appropriate for R CrB. The fact that the line fluxes and the continuum fading are nearly decoupled suggests that either the region is irradiated by the unobscured star throughout the decline or the excitation of the lines is not dependent on the receipt of photospheric radiation.
Viotti predicts the flux ratio as a function of the dilution factor W and the customary variable neT-0.5. The observed ratios (see above) run from about 0.008 on 1995 October 18 to 0.13 and 0.45 on 1995 November 13 and 1996 February 6. For the appropriate values of neT-0.5 , the flux ratio is a simple function of the dilution factor and, hence, of the distance of the region of line formation in terms of the stellar radius. The observed flux ratios imply distance of 2, 18, and 35 stellar radii for the three dates in question. The first estimate is probably erroneous as the Fe ii line is expected to be a blend of a sharp and a transient line. The other estimates indicate that the region of formation of the sharp lines is distant from the star, a result consistent with their flux being unaffected by the decline until a considerable fading had occurred.
An estimate of the volume from which sharp lines are emitted may be obtained from the emission line fluxes. We use the [O i] lines for this purpose as their excitation is surely by electron collisions and oxygen is expected to be neutral. If the small amount of interstellar and circumstellar extinction is neglected, the equivalent radius of the emitting volume is given by
| (3) |
where is the radius of the star, is the integrated line flux, is the emission coefficient per neutral atom and per electron, is the distance of the star, and (O i) is the density of oxygen atoms. Adopting plausible values - = 100, = 1.35 kpc, from Surendirenath, and T K with , and an O/C abundance ratio of 10-0.2, we find . This assumes that all electrons are contributed from the ionization of carbon for which we assume Saha’s equation and local thermodynamic equilibrium. Alternative assumptions such as full ionization of carbon atoms, or no ionization of carbon with electrons donated by metals do not yield widely different estimates (say, ). It seems clear that the region emitting the sharp lines is quite distant from the star (say, about 20) and therefore very thin; if the region is a spherical shell, its thickness is for a shell radius of 20. This is consistent with a single-peaked profile for the emission lines; a thick shell would give emission lines that are double-peaked with a separation between the peaks of approximately twice the expansion velocity.
Comparison of the fluxes in the Ca ii and [Ca ii] lines confirms the electron densities. At low electron densities and low radiation intensity, the number of photons emitted in the infrared triplet lines equal those emitted in the two forbidden lines. On 1996 February 9, a representative date in the deepest part of the decline, the flux in the triplet lines is about an order of magnitude greater than that in the forbidden lines. Since collisional de-excitation of the 2D state, the common level of triplet and forbidden lines, is expected for n cm-3, the low relative intensity of the forbidden lines is explained. A puzzle offered by the apparent absence of a sharp emission line in the H and K lines is sketched below.
6 Broad Emission Lines
Discovery of broad lines may be traced back to Herbig (1949) who found He i 3889Å, Ca ii H and K, and the Na i D emission lines to be broad (FWHM km s-1). The presence of the high excitation He i line in the set of broad lines implies that these lines have a different origin to the sharp emission lines that are all of low excitation (Payne-Gaposchkin 1963).
Our spectra greatly extend the list of broad lines. Permitted lines include the He i 3889, 5876, 7065, and 10830Å lines, the Na i D lines, the Ca ii H and K lines and the infrared triplet lines 8498, 8542, and 8662Å, the K i lines at 7664 and 7699Å. These identifications of He i lines remove all uncertainty about the correct identification of the 3889Å line (Herbig 1949; Payne-Gaposchkin 1963). Forbidden broad lines include the [N ii] lines at 6548 and 6583Å, the [O ii] lines at 7319-7331Å, and the [Ca ii] lines at 7291 and 7323Å. Our detection of the [O ii] lines implies that Herbig’s (1949, 1968) detections of the [O ii] 3727Å doublet at the 1949 and 1968 deep minima refer also to a broad line. Finally, our spectra also suggest that the C2 Swan and CN Violet system bands are composed of broad lines at minimum light.
6.1 The He i Lines
Neutral helium provides three lines from the triplet series: 3889Å (2s 3S - 2p 3P∘), 5876Å (2p 3P∘ - 3d 3D), and 7065Å (2p 3P∘ - 3s 3S). The triplet 10830Å is surely present at minimum light but the observed bandpass did not usually include the line. The line was strongly in emission on 1996 May 8 when 7065 and 5876Å did not rise above the local continuum but 3889Å was obviously in emission. Other triplet lines were searched but not found. Singlet lines (e.g., 5015Å 2s 1S - 3p 1P∘), which would be of comparable intensity for a source in thermal equilibrium, are not present. Their absence shows, as expected, that the He i emission lines result largely from over-population of the metastable 2s 3S level. Profiles of the three detected lines on 1996 March 2 are shown in Fig. 18.
Fig. 19 traces the evolution of the 3889Å line which was seen first (barely!) in emission on 1995 October 18 and reached its maximum equivalent width in the 1996 January 5 spectrum. Spectra taken in decline prior to 1995 October 18 had not included the 3889Å region so its first appearance in emission is not known. Emission was present until 1996 May 8 and all signs of emission had disappeared by 1996 July 8. Unfortunately, none of the several spectra obtained between May and July included this line. Emission at 3889Å extends from -280 to +280 km s-1 at the base with perhaps a slight change with line strength. Inspection of Fig. 19 shows that sharp emission lines prominent when the He i emission line was weak do not mar the line’s profile when it was at its strongest from 1996 January to 1996 March. The reason for this is simple and an important clue to the relative locations of the sharp and broad line emitting gas: the flux of sharp emission lines decreased by a large factor after 1995 November 2 but the broad lines’ flux was essentially unchanged throughout the decline.
The 5876Å line is present in absorption at maximum light (Keenan & Greenstein 1963). First appearance of this line in emission occurred on 1996 February 1; it was not present in either absorption or emission in 1995 November 12-15. The line was last seen in emission on 1996 March 13; the next spectrum - 1996 April 9 - again shows neither absorption nor emission. Since the photospheric line is a blend of He i and C i (Lambert & Rao 1994), absence of an absorption implies emission filling in the coincident C i lines (and adjacent lines). Absorption of about the expected strength of the He i - C i blend was present from 1996 May 4 to the end of the series of observations.
The 7065Å line first appeared in emission above the continuum on 1995 October 18 but was not obviously present on 1995 October 12. It remained as a distinct emission feature until 1996 February 2; the next spectra at 7065Å from early 1996 May showed very weak emission at the central velocity of the expected broad emission and, hence, we suspect the broad emission at 7065Å was present. Even this hint of the broad line was absent in 1996 June and on subsequent dates.
The He i emission profiles are well fitted by a Gaussian whose width (in km s-1) is the same for the three lines and appears constant over the interval in which the emission lines are prominent. For the well observed 3889Å and 7065Å lines the mean widths are 322 km s-1 and 323 km s-1 respectively. The radial velocities of the lines (Table 5) show that the emission at minimum light is systematically blue-shifted with respect to the mean photospheric (i.e., systemic) velocity by up to 31 km s-1. The velocity shift is constant over the period for which the broad lines are measureable. A similar velocity shift is found for the [N ii] lines. Unfortunately, the other broad permitted and forbidden lines are too blended for accurate measurement of their velocity.
When emission is strong (1996 February), the 7065Å line is red-shifted by about 3 km s-1 with respect to the 3889Å line. This is at the limit of measurement; the shift is about 1% of the line widths. The sense of the shift is consistent with the supposition that the 3889Å and, possibly also, the 7065Å line are optically thick: we use the wavelength of the strongest component of these 3S - 3P triplets to compute the radial velocities. Since the weakest component of the 3889Å line is 4.2 km s-1 to the blue and 23 km s-1 to the red for the 7065Å line, the effect of optical depth is to introduce a change in the lines’ effective wavelengths.
The fluxes of the He i lines remained constant to within the errors of measurement of about 30%. This is in contrast to the flux of a sharp line that declined by about a factor of ten between 1995 October 18 and 1996 January and February when the star was at its faintest.
A striking feature of the He i lines is the low intensity of 5876Å relative to 3889Å and 7065Å. The flux ratios are measured to be F(7065)/F(5876) and F(3889)/F(5876) .121212Asplund (1995) measured similar flux ratios at the 1993 deep minimum of RY Sgr: F(7065)/F(5876) = 4.3 and F(3889)/F(5876) = 44. We may assume that the broad lines are little affected by reddening and certainly not by the reddening from dust in the cloud responsible for the decline itself. These ratios are quite different from those expected for optically thin lines produced by the recombination of He+ ions at low density: for example, prediction is that F(7065)/F(5876) = 0.12 and F(3889)/F(5876) = 0.81 for gas at T = 10000K and cm-3 (Aller 1984). The major discrepancy seems to be that the 5876Å flux is relatively low. Observed and predicted ratios may be reconciled if the lines are optically thick and the electron density is high permitting collisional excitation: Surinderinath et al.’s (1986) calculations suggest the physical conditions T K and to cm-3. These are quite different from the conditions of the sharp lines’ emitting region.
A remarkable aspect of the He i broad lines is the constancy of their flux. Between the first appearance in mid-October 1995 to their last appearance in early May 1996, the flux in the 3889Å and in the 7065Å lines was constant to within 10%, a variation that must equal or even better (!) the measurement errors from the rather indirect calibration of our spectra. The constancy of flux contrasts with the case of the sharp lines whose flux in the deepest part of the decline (1996 January-February) fell to 10% that measured in mid-October 1995 and out of decline. Our flux estimates for forbidden lines, especially the [N ii] 6583Å line show that their flux was also constant. This condition likely applies too to the Ca ii and Na i D lines but accurate measurements are compromised by underlying and overlying absorption. This marked difference between the broad and sharp lines shows that their emitting regions are well separated. The broad line region is not occulted by the fresh cloud of soot. Equally as striking is the fact that the 3889Å flux is just 24% less than that measured at the time of the 1962 minimum when photographic spectra were calibrated against UBV photometry (Rao 1974). Although additional measurements are highly desirable, it appears that the broad line region is a long-lived feature of R CrB.


6.2 The Permitted and Forbidden Ca ii Lines
The Ca+ ion contributes the 3968Å and 3934Å resonance (H and K) lines, the infrared triplet of lines at 8542Å, 8662Å, and 8498Å, and the forbidden lines at 7291.47Å and 7323.89Å (Risberg 1968). The H and K resonance lines are a transition from the 4s 2S ground state to the second excited state (4p 2P∘), which serves as the upper state of the infrared lines. The lower state of the infrared lines, 3d 2D, and the ground state are connected by the forbidden lines. In optically thin environments, the ratio of the emission coefficients of the H and K lines to the infrared triplet lines is set by a branching ratio favouring the H and K lines. In a low density gas optically thin to the infrared triplet lines, the number of photons emitted in the infrared triplet lines equals the number emitted in the forbidden lines. In light of these expectations, it is of interest to examine the similarities and diffferences between the permitted and forbidden Ca ii profiles and fluxes.
Broad emission in the H and K lines was seen first on 1995 October 15. On the previous spectrum (1995 October 2) to cover these lines, the lines have essentially their photospheric absorption profile. On the next spectrum - 1995 November 2 - the lines have the basic profile that they retained throughout the decline (Fig. 20): a broad profile with a red peak stronger than the blue peak. Emission was last seen on 1996 May 6 and the photospheric absorption spectrum had returned by 1996 July 8.
Emission in the infrared triplet lines was first seen on 1995 October 13 as sharp emission in the 8542Å line; the other two lines of the triplet were not on the observed portion of the spectrum. The previous spectrum - 1995 October 2 - showed a photospheric absorption line at 8542Å. The sharp emission in the triplet lines was seen until 1996 July 26 when it was superimposed on a photospheric absorption line. A broad component underlying the sharp feature was seen from 1996 January 5 to 1996 March 2.
Emission in the forbidden lines was dominated by a sharp feature but weak underlying broad emission was seen on 1996 January 5 and February 6. It is likely that this broad emission was present for a longer time but several spectra included not the 7291Å line but that at 7323Å whose broad emission, if present, is masked by stronger broad emission from [O ii] lines. The sharp emission line in the [Ca ii] lines was seen first on 1995 October 18 and last seen on 1996 March 2. Emission was not present on or before 1995 October 2 and on or after 1996 May 8. The signature of emission on 1995 October 18 is clear but the spectrum of 1995 November 2 shows no signs on emission.
The flux in the broad infrared triplet lines relative to that in the H and K lines is approximately equal to the branching ratio and, hence, the gas emitting the broad lines appears to be optically thin to the H and K lines. The flux in the forbidden lines is about a factor of 10 less than that in the infrared triplet lines which suggests that collisional deexcitation of the 2D level is occurring which is expected considering the high densities derived from the He i lines.
The H and K profiles differ from those of He i and [N ii]. While the width of the Ca ii emission at its base is essentially identical to that of the He i and other broad lines, the H and K lines are distinguished by a marked asymmetry: the red wing is a factor of two stronger than the blue wing. This asymmetry is not due to sharp Ca ii emission augmenting the red wing. Although interstellar absorption is present at -20 km s-1, it is too narrow to affect the asymmetry of the broad line. We suppose that the asymmetry is caused by absorbing gas at a velocity of -50 to -100 km s-1 relative to R CrB’s systemic velocity. This gas which is not seen in the Na i D profiles may be gas ejected in earlier declines that is photoionized by the interstellar radiation field and now containing very few neutral sodium atoms.
An intriguing puzzle is presented by the H and K profiles is the obvious lack of a contribution from a sharp emission line. If the gas were optically thin to these lines, the flux of the infrared triplet lines would imply a flux in the H and K lines that is about five times the observed flux in the broad H and K lines but Fig. 20 shows that the sharp line emission, if present at all, is a small fraction of the broad line flux. High optical depth in the H and K lines through the sharp line emitting region may account in part for this puzzle.

6.3 The K i Resonance Lines
The K i resonance lines at 7664 and 7699Å are present as a composite of sharp and broad lines.131313Telluric O2 cross this wavelength region. Division of the R CrB spectrum by that of a hot star observed at a similar airmass provides an O2 -free spectrum. Owing to a small instrumental shift, the division produces sharp inverse P Cygni profiles at the wavelengths of the O2 lines. Such a profile mars the K i 7664Å line. The broad K i and [N ii] lines have similar profiles (Fig. 21). The velocity shift between the broad emission lines and the sharp lines is obvious. The K i sharp line corresponds to components C2 and C3 with no more than a slight contribution from the C1 component. The C2 components of the sharp lines and probably also the broad emission lines are in the intensity ratio of 2 to 1 for the 7664Å and 7699Å lines indicating that the emitting regions are optically thin to these lines. The C3 component appears to come from somewhat optically thick gas because the intensity ratio is closer to 1:1 than 2:1.

6.4 The Na i D Lines
The Na i D lines are the strongest features in the visual region of R CrB’s spectrum in decline. Fig. 22 shows representative profiles that are a composite of sharp and broad emission lines with sharp interstellar absorption, and, in the recovery from minimum light, a high velocity (blue-shifted) absorption line. The K i and Na i profiles are quite similar; the higher abundance of Na is presumably responsible for the appearance of absorption components in the Na i D but not the K i lines. A problem peculiar to Na i D is that the smaller separation between the two resonance lines (6Å versus 35Å for K i) results in a blending of the broad D1 and D2 lines. Despite the blending, it is clear that the velocity width of the Na i D lines is quite similar to that of all other broad lines. The sharp Na i D component has contributions from C1, C2, and C3 at all times.

6.5 The [N ii] Lines
Our spectra provide clear detections of the [N ii] 6583Å line. The accompanying weaker line at 6548Å is present with the expected lower intensity set by the branching ratio. The excited forbidden line at 5754Å was never detected. The 6548Å line was first seen on 1995 November 2 but was not present on 1995 October 18. Emission was seen through to 1996 March 2 but not on 1996 April 9. When the line was detected with good signal-to-noise, the profile was clearly double-peaked (Fig. 23).
The mean velocity separation of the two peaks is 124 19 km s-1 with no evidence of a change during the period of the observations. If treated as overlapping gaussian profiles, the blue component is found to be possibly slightly broader than the red one (19565 km s-1 versus 16337 km s-1 for the FWHMs). The FWHM of the complete line is 279 km s-1 from 12 observations and does not change during the decline. The [N II] line is systematically blue-shifted with respect to the photospheric velocity and also to the sharp lines.
There are small but distinct differences between the [N ii] and He i emission lines: the [N ii] line is double-peaked but the He i lines are symmetrical, and the He i lines are systematically broader by about 40 km s-1. The fact that the velocity offset from the photospheric lines is large and similar for all of these broad lines suggests that their regions of line formation are related.
A rough estimate of the volume emitting the broad [N ii] lines is obtainable by using the lower limit to the flux ratio of the 6583Å and 5755Å lines. The analogous flux ratio of [O ii] lines (see below) involves the 7320-7330Å blend and 3727-3729Å. Both lower limits imply cm-3 at T K. Surendiranath’s emission coefficients with the assumptions used for the calculation of the sharp line region imply a radius of the broad line region . Unfortunately, neither T nor are well constrained. A higher is possible with a contraction of the emitting volume scaling approximately as .

6.6 The [O ii] Lines
Broad emission near 7330Å is primarily due to [O ii] with a minor contribution from the [Ca ii] 7323Å line (Fig. 11). The shape of the emission indicates that it is a blend of the four expected [O ii] lines: 7319.99Å (2D5/2 – 2P3/2) and 7318.92Å (2D5/2 – 2P1/2) providing ‘one’ line and 7330.73Å (2D3/2 – 2P3/2) and 7329.66Å (2D3/2 – 2P1/2) providing the second ‘line’. (Wavelengths are taken from Moore 1993.) These two ‘lines’ are blended into one asymmetric broad line. The shape of the profile suggests that the dominant contribution is made by the pair of lines (7319.99Å and 7330.73Å) from the 2P3/2 upper state, as expected. No attempt has been made to deconvolve the line into its four [O ii] and one [Ca ii] components. The line width is quite consistent with those measured for the [N ii] 6583Å line. Unfortunately, the [O ii] 3727Å doublet was never recorded with adequate signal-to-noise ratio.
6.7 Molecular Emission Features
C2. Absorption bands of the C2 Swan system are weakly present in the spectrum of R CrB at maximum light with a variable strength. At the onset of the decline, the C2 lines go into emission: Fig. 24 shows the 5165Å bandhead in emission on 1995 October 18 when transient emission lines were strong. Emission had weakened by 1995 November 2 when the presence of C2 in absorption or emission is difficult to establish. The next observation covering 0-0 band shows it to be in emission (Fig. 24). Even casual inspection of Figure 24 shows that the C2 lines are not sharp on 1996 January 5. If they were, the emission spectrum would be the inverse of the normal absorption spectrum with probably less mutilation by atomic lines. Striking features of the emission spectrum are that the head is missing, the rotational structure is unresolved, and the peak intensity is displaced from 5165Å, the wavelength of the head in absorption, to about 5162Å. A quite similar band profile was present at a minimum of V854 Cen (Rao & Lambert 1993) and attributed to C2 line formation in cold gas: P branch lines of low rotational quantum number have wavelengths near 5162Å. The line width suggests that the regions responsible for the broad C2 and the various atomic broad lines may be related but, in view of the different physical conditions required for C2 and He i emission, the regions cannot be co-located. The C2 emission consists of many blended lines so that it is not a simple matter to derive the radial velocity of the molecular gas. The great width of the C2 lines may indicate motion - turbulent or organized - of the gas or it may arise because the emitting molecules are between us and the scattering layer that is presumed to broaden the photospheric lines (see below).

A search was made for lines of the C2 Phillips bands. The lower electronic level for the Phillips system is the ground state of the molecule. The Swan system’s lower level is the lowest triplet level lying slightly above the ground (singlet) level. A combination of observations of Swan and Phillips bands would provide data on the excitation of the molecule and, hence, clues to the location of the molecular gas. Our search for Phillips lines provided nothing more than tantalising hints of absorption and emission lines. We postpone further discussion pending a full search for 2-0 and 3-0 lines which fall in regions containing telluric lines.
CN. The = 0 sequence of CN violet system bands was seen in emission first by Herbig (1949) when R CrB was in a deep decline (V ). Additional observations were reported by Payne-Gaposchkin (1963) and Herbig (1968). In our observations, the = 0 sequence is first seen in emission on 1995 October 18 with a rotational structure suggesting the individual CN lines are sharp. At the next observation of the sequence on 1996 February 6, the appearance of the band has changed dramatically: individual lines are no longer resolved and the bandhead has shifted to the blue. At this time, the CN and C2 bands have similar appearance. The blue-shifting of the CN band in decline was noted by Herbig (1949).
7 High-Velocity Absorption Lines
A striking feature of the Na i D profiles at earlier declines has been the appearance of a strong broad blue-shifted absorption. This decline was no exception: Fig. 22 shows such absorption in the 1996 May 5 spectrum. Blue-shifted absorption was noted first by Payne-Gaposchkin (1963) in spectra taken during recovery from the 1960 minimum. It was seen again in the recovery from the 1988 minimum ( Cottrell et al. 1990; Lambert et al. 1990). Clayton (1996) remarks that high-velocity absorption lines have been seen “early in declines and again just before return to maximum light”. No absorption was seen early in this decline. A similar statement applies to the 1988-1989 decline when high-velocity absorption was seen clearly first at 100 days after the onset and possibly at a lower velocity at 80 days after the onset. At these times R CrB was at a visual magnitude of about 10 which it had reached about 30 days into the decline.
In this minimum, we first detect high-velocity absorption in the 1996 April 9 spectrum when the star was at V = 12.2 and recovering from minimum light. Comparison of Na i D profiles obtained at the same visual magnitude in the descent to and recovery from minimum light (spectra 2 and 7 in Fig. 22) shows that the broad emission profiles of Na i D are essentially identical except for the weak shell absorption in the spectrum taken on the recovery. As the recovery progressed, the shell absorption changes: the equivalent width of D1 increased from 0.078Å on 1996 April 9 to 0.73Å on May 5 as the mean velocity changed from -85 km s-1 to -113 km s-1. The profile is asymmetric with the red wing steeper than the extended blue wing. The velocity of the deepest part of the profile increases from -85 km s-1 on 1996 April 9 to -190 km s-1 on July 25 (Fig. 25). In late 1996 July, the profile split into several components . By 1996 October 2, the shell absorption had disappeared.
Shell absorption is not present in the Ca ii H and K lines. Superposition of Na i D and Ca ii profiles shows quite clearly that shell absorption is absent in the latter profile. There is a hint of shell absorption in the best K i profiles.

Although reports of shell absorption are scarce, the above evolution appears typical. Certainly, the maximum velocity in the 1988-1989 and the present decline are similar. In the former decline, maximum velocity was attained in just 100 days from onset of the decline instead of the nearly 300 days taken in the recent decline which may reflect the fact that the 1988-1989 decline was shallower (minimum V = 11.2 against 13.6). Payne-Gaposchkin (1963) reported a velocity of -275 km s-1 for shell absorption from the 1960 minimum. This is appreciably higher than we find. She also reported shell absorption in the Ca ii H and K lines which the recent decline did not show. The sparse dataset encourages the view that shell absorption appears only during the recovery from minimum light. Extrapolation of the velocity of the maximum absorption and the extrema of the absorption (Figure 25) implies that the shell’s acceleration began in early 1996 January close to the mid-point of the 150 day interval at minimum light. In the case of stars exhibiting frequent declines (e.g., V854 Cen), shell absorption may appear at other phases because it may be difficult to tie the shell absorption to the responsible decline. Additionally, shell lines may be present and lack an associated decline; gas from clouds off the line of sight may intrude onto our line of sight.
8 Photospheric Lines at Minimum Light
Soot formation above the photosphere is considered to be the agent responsible for the decline. As discussed above, the trigger for soot formation appears to be seated in the photosphere. Here, we investigate if the decline leaves a mark on the photosphere in the form of a change of chemical composition which we determine for several dates during the decline excluding the times when the star was at its faintest. This exclusion is necessary because the absorption line spectrum is then ‘veiled’, i.e., the lines are shallow and very broad. Discussion of the chemical composition is followed by remarks on the veiled photospheric lines.
8.1 Chemical Composition
Spectra from the following four epochs were selected for measurement:
-
•
1995 September 30 - the decline began at about this time.
-
•
1995 October 18 - the star had faded to V .
-
•
1995 November 2 - the decline of the star’s brightness had continued and the star was close to V at this time.
-
•
1996 May 5 - recovery was underway with the star at V 10.4.
This quartet of spectra were compared with that obtained prior to the decline on 1994 April 2 when the star was close to maximum light in its pulsational cycle (Rao & Lambert 1997). Comparison of the measured equivalent widths shows that the lines in the 1995 September 30 spectrum are up to a factor of 2 stronger than in the pre-decline maximum light spectrum. At the other three epochs, the equivalent widths are quite similar to the pre-decline case.
Our method of analysis follows that developed for the comprehensive abundance analysis of RCB stars (Asplund et al. 1999 - see also Rao & Lambert 1996). We use the line-blanketed H-poor atmospheres computed by Asplund et al. (1997). An abundance ratio C/He = 1% by number is adopted. The microturbulence is derived from Fe i, and C i lines by the usual condition that the derived abundance be independent of the equivalent width. A selection of Fe i and Fe ii lines and the condition of ionization equilibrium are used to fix the atmospheric parameters Teff and log . As an additional constraint on Teff in 3 of the 5 cases, we use the low excitation [O i] 6363Å line and high excitation permitted O i lines. The parameters Teff = 6700 K, log = 0.0, and the microturbulence of 7 km s-1 fit the selected indicators. That a single model suffices is not surprising because Rao & Lambert (1997) showed that the atmospheric pulsation results in only small variations of the parameters.
| Species | Date | ||||||||
| 1994 Apr 2 | 1995 Sep 30 | 1995 Oct 18 | 1995 Nov 2 | 1996 May 5 | |||||
| log 141414 Normalized such that log = 12.15 where is the atomic weight. | log | 151515 = [X/Fe] - [X/Fe]1994Apr2 where [ X/Fe] = log()RCrB - log()⊙ | log | log | log | ||||
| H i | 6.91 | 7.02 | -0.3 | 6.48 | -0.3 | 6.38 | -0.3 | 7.05 | 0.2 |
| Li i | 2.42 | 2.93 | 0.1 | … | … | 2.33 | 0.1 | … | … |
| C i | 8.92 | 9.31 | 0.0 | … | … | 8.81 | 0.1 | 8.99 | 0.1 |
| C ii | … | … | … | 9.23 | … | … | … | … | … |
| N i | 8.13 | 8.40 | -0.1 | 7.66 | -0.3 | 7.91 | 0.0 | 7.80 | -0.3 |
| 8.46 | 8.91 | 0.1 | … | … | … | … | 8.67 | 0.3 | |
| O i | 8.39 | 8.94 | 0.2 | 8.26 | 0.0 | 8.40 | 0.2 | 8.76 | 0.4 |
| Na i | 6.17 | 6.66 | 0.1 | 5.72 | -0.3 | 5.85 | -0.1 | 6.27 | 0.2 |
| Mg i | 6.87 | 7.38 | 0.1 | … | … | 6.81 | 0.1 | 7.10 | 0.2 |
| Mg ii | … | … | … | … | … | 6.49 | … | 6.75 | … |
| Al i | 5.75 | 5.99 | -0.1 | … | … | 5.65 | 0.1 | 5.70 | 0.0 |
| Al ii | … | … | … | 5.81 | … | … | … | 6.10 | … |
| Si i | 7.03 | 7.08 | -0.3 | 6.47 | -0.4 | 6.69 | -0.2 | 6.85 | -0.1 |
| Si ii | 7.18 | … | … | … | … | 6.85 | … | 7.14 | … |
| S i | 6.57 | 6.90 | -0.1 | 6.35 | -0.1 | 6.56 | 0.2 | 6.69 | 0.2 |
| Ca i | 5.23 | 5.58 | 0.0 | … | … | 5.15 | 0.1 | 4.77 | -0.4 |
| Fe i | 6.32 | 6.71 | … | … | … | 6.14 | … | 6.14 | … |
| Fe ii | 6.26 | 6.63 | … | 6.13 | … | 6.06 | … | 6.23 | … |
| Ni i | 5.46 | 5.82 | 0.0 | … | … | 5.31 | 0.0 | 5.62 | 0.2 |
| Zn i | 3.81 | 4.36 | 0.2 | 3.56 | -0.1 | 3.73 | 0.1 | 4.17 | 0.4 |
| Y ii | 1.42 | 1.79 | 0.0 | … | … | … | … | … | … |
Results for the abundances are summarized in Table 6. There is a suggestion that the abundances derived from the 1995 September 30 are consistently higher than at other times by about 0.3 to 0.5 dex. Relative abundances X/Fe are, however, almost identical for this and other spectra. It is likely that the apparent difference in composition reflects the atmospheric disturbance that subsequently initiated the decline. Since such a disturbance is not modelled by the adopted suite of model atmospheres, the result is the apparently anomalous abundances. Perhaps, significantly the carbon abundance derived from the 1995 September 30 spectrum is much closer to the adopted input abundance than is the case for the other spectra. In fact, the derived and input abundance are identical to within the errors of measurement: Table 6 gives the derived abundance as 9.30.3 and the input value is 9.5. At other times, the derived carbon abundance is 0.5 to 0.7 dex less than the input value. Since carbon dominates the continuous opacity, the equivalent width of (weak) C I lines should be independent of the abundance. Asplund et al. (1999) dub the inconsistency between the derived and input carbon abundances ‘the carbon problem’. After consideration of possible resolutions of the problem, they conclude that the key lies in the atmospheric structure. It may then be significant that, at the time when the photosphere is disturbed, that the carbon problem is considerably mitigated.
If the ratio X/Fe is taken as a more secure estimator of chemical composition, it may be claimed that the photospheric composition is unaffected by the decline. This is most probably not unexpected. There are, however, examples of luminous supergiants with highly peculiar compositions resulting from the efficient separation of elements according to their condensation temperature. For example, certain RV Tauri variables are highly deficient in Ca, Fe, and Sc but not in S and Zn (Giridhar, Lambert & Gonzalez 1998). Many of these stars have dusty wind and/or circumbinary diskss in which a separation of dust from gas may occur. If such a separation and return of (dust-free) gas to the atmosphere can occur for RV Tauri stars, might it not occur for R CrB? The lack of change in the X/Fe ratios, as signified by the quantity in Table 6, suggests that it did not occur at the 1995-1996 decline. Of course, the abundance anomalies resulting from a dust-gas separation may differ considerably for RV Tauri and R CrB owing to the large difference in chemical compositions, and in pulsational amplitudes that are considerably larger for the RV Tauri variables. In addition, the presence of high-velocity absorption in Na i D lines shows that at least some metals are in the gas that is ejected with the dust. Sodium, however, has a relatively low condensation temperature. Calcium has a much higher condensation temperature so that it is intriguing that high-velocity absorption was not seen at this decline in the Ca ii H and K lines.
8.2 Profiles of Absorption Lines
Previous reports of the spectra of RCBs in deep declines have noted the weakness of the photospheric absorption lines. Adjectives ‘veiled’ and ‘diluted’ have been applied to describe the appearance of the lines. High-resolution spectra of V854 Cen in a deep decline showed the lines to be absent even though the continuum was recorded at a signal-to-noise ratio more than adequate to detect all but the weakest lines (Rao & Lambert 1993). Our spectra betray the evolution of the absorption line spectrum from a normal photospheric spectrum to a veiled spectrum at minimum light. (In the early stages of the decline, some high-excitation lines are filled in by emission. The apparent disappearance of these absorption lines is not an example of veiling.)
Low excitation lines at minimum are irretrievably blended with their own sharp emission line. Then, to study the evolution of absorption lines we consider high excitation lines that after the disappearance of their transient emission lines return on 1995 November 2 to their pre-decline profile and equivalent width. On the next spectrum (1995 November 12), these strong lines appear greatly weakened. A superior spectrum from 1996 January 5 shows the lines weakened, broadened and red-shifted (Fig. 26). These are ‘veiled’ lines which at this decline were present when the star was fainter than V. Table 7 summarizes measurements of a set of strong lines. The normal absorption lines return by 1996 May 5.
| Maximum Light161616Measurements from Rao & Lambert (1997) to show approximate range. | In Decline | ||||||||||||||||
| 1994 Apr2 | 1994 Apr29 | 1995 Nov2 | 1996 Jan5 | 1996 Feb6–9 | |||||||||||||
| line | Wλ171717Equivalent width in mÅ. | HW181818Full width at half maximum line depth in km s-1. | Wλ | HW | HW | Vd | Wλ | HW | V | Wλ | HW | V | |||||
| O i 6158Å | 365 | 40 | 343 | 40 | 356 | 40 | -8 | 188 | … | 11 | … | … | 10 | ||||
| Si ii 6347Å | 594 | 43 | 527 | 43 | 552 | 44 | -11 | 265 | 67 | 15 | 234 | 63 | 13 | ||||
| Si ii 6371Å | 469 | 34 | 374 | 34 | 471 | 39 | -10 | 269 | 81 | 11 | 139 | 52 | 7 | ||||
| H i 6563Å | 547 | 52 | 497 | 52 | 425 | … | -5 | 220 | 69 | 10 | … | … | 12 | ||||
| S i 6743Å | 130 | 27 | 149 | 27 | 130 | 26 | -12 | … | 40 | … | … | 53 | 13 | ||||
| S i 6749Å | 184 | 28 | 178 | 28 | 160 | 27 | -11 | … | … | 17 | 81 | … | 5 | ||||
| S i 6757Å | 192 | 28 | 196 | 28 | 197 | 29 | -11 | … | 40 | … | 96 | 75 | … | ||||
| In Decline | |||||||||||
|---|---|---|---|---|---|---|---|---|---|---|---|
| 1996 Mar2 | 1996 Apr9 | 1996 May5 | |||||||||
| line | Wλ | HW | V | Wλ | HW | V | Wλ | HW | V | ||
| O i 6158Å | 248 | … | 11 | 280 | … | 6 | 383 | 45 | 8 | ||
| Si ii 6347Å | … | … | … | 392 | 46 | 16 | … | … | … | ||
| Si ii 6371Å | 243 | 64 | 10 | 276 | 35 | 7 | 479 | 40 | 8 | ||
| H i 6563Å | … | … | 8 | … | … | 9 | 523 | 49 | 7 | ||
| S i 6743Å | 69 | 36 | 9 | 116 | 32 | 9 | 157 | 33 | 4 | ||
| S i 6749Å | 84 | 37 | … | 136 | 31 | 6 | 201 | 32 | 6 | ||
| S i 6757Å | 130 | 46 | 9 | … | … | … | 224 | … | 5 | ||

9 New Insights from Spectroscopy of the 1995-96 Decline
Spectroscopy of the 1995-1996 decline provides detailed evidence on R CrB and its environs that we now endeavour to relate to the generic model that envisages a fresh localized cloud of soot forming and obscuring the photosphere. Four principal spectroscopic components and/or events should be noted. First, there is the photospheric disturbance occurring at the onset, an event we refer to as the ‘trigger’, that provided distorted absorption line profiles and transient emission lines. Second, there are the many sharp emission lines of neutral and singly-ionized metals that appear largely unaffected by the decline. Third, there are the broad emission lines of He i and other species. Fourth, there is a veiling of the photospheric lines at minimum light. Fifth, there is the appearance following minimum light of high-velocity blue-shifted absorption in the Na i D lines. We discuss each of these aspects.
9.1 The Photospheric Perturbation and Transient Emission Lines
Spectra taken at the onset of the decline show a disturbed photosphere with upper layers falling down and the deepest layers moving up at a velocity greater than that expected from the extrapolation of the previously regular pulsation. The photometric decline appears to have occurred when the photosphere was expected to have its maximum velocity of recession. In a few days following onset, the transient emission lines appear at a velocity close to the mean photospheric velocity. We identify the disturbed absorption lines and transient emission lines as signatures of a shock.
Transient emission lines appear about 2 weeks after the first observations of the distorted photospheric lines but incipient emission seems to be present somewhat earlier. There must be a physical relation between the affected photospheric absorption lines and the transient emission lines. It seems unlikely that the regions of formation are exactly co-located. A possibility is that the shock to which the photospheric disturbance is attributed migrates outward to initiate emission in lower density regions. Emission in O i high-excitation lines and in molecular C2 lines is unlikely to arise from the same layer of the atmosphere. We suppose that the high-excitation emission lines arise from gas heated immediately behind the shock. A possibility suggested by theoretical studies of pulsating R CrB atmospheres is that the low atmosphere contains more than one shock; for example, Woitke (1997) obtains steady-state solutions for a regularly pulsating atmosphere in which a shock propagates outward each pulsation but at times 2 shocks are supported by a pulsation, and the velocity of the principal shock (relative to the star) varies with pulsational phase from about zero to close to the velocity .
In models considered by Woitke (1997 - see also Woitke, Goeres & Sedlmayr 1996), emission lines are formed in hot gas immediately behind a shock. Cooling times for the hot gas appear to be very short –less than a day for a typical model (Woitke 1997) – and, therefore, the persistence of the transient emission lines over a couple of weeks implies that shock propagation maintains the emission line spectrum. Further behind the shock in the expanded gas, densities and temperatures are lowered with the result that cooling times are lengthened. It is in this post-shocked gas that conditions may be conducive to dust formation provided the gas is sufficiently distant from the star.
Defining the shock velocity to be that of the pre-shock gas in the reference frame of the shock, Woitke’s calculations for a R CrB-like star show that dust may form closer to the star for higher velocities of the outward moving shock: for example, = 50 km s-1 provides for dust formation as close as 0.5 to the stellar photosphere but at = 20 km s-1 dust cannot be formed closer than about 3 to the surface. The velocity of the emitting gas relative to the star, , depends on the velocity of the shock through the gas and the velocity of this gas relative to the star. If the atmosphere is static, . (Woitke [1997] finds a velocity of for the case of a representative periodic shock.) The observed radial velocity of the emission lines depends on the location and size of the shocked region on the earth-facing hemisphere. A small region near the centre of the hemisphere will give emission lines at the shock’s velocity but lines from an off-centre region will have a smaller radial velocity that vanishes for a region at the limb. Emission from a large region will have a mean velocity between and zero. If the shock propagates through infalling gas, will be reduced by the infall velocity. In the 1995 decline, there is evidence from the photospheric line profiles at the onset and from the red-shifted absorption feature accompanying the transient emission lines that gas was infalling at about 30 km s-1 relative to photospheric lines. This gas may be ahead of the ‘dusty’ shock or possibly related to a deeper inward moving shock. The transient emission lines are typically redshifted by about 7 to 17 km s-1 relative to the group A absorption lines that are blue-shifted by about 10 km s-1 relative to the predicted photospheric velocity. These velocities seem to imply passage of a shock through infalling gas.
Observations suggest a causal relation between the appearance of the shock and the onset of the decline. The delay between the occurrence of the shock in the photosphere and the formation of dust higher in the atmosphere appears to have been short. However, the lack of spectra between 1995 August 9 and September 30 means that the birthdate of the photospheric shock is not known with precision. The presence of infalling gas prompts speculation that the trigger preceded the decline. Perhaps, the previous pulsation began the sequence of events that led to the decline. If it can be shown that the appearance of the photospheric shock and the onset of the decline are contemporaneous, it would seem that two shocks have to be invoked because dust cannot form behind a photospheric shock and that shock will require at least several days to propagate out to the heights at which temperatures in the post-shock gas are sufficiently cool for dust to form. In this case, one might expect to observe different radial velocities for lines formed in the two shocks and, hence, different radial velocities for high and low excitation lines and evidence of two velocity components in some lines. These effects were not seen.
R CrB is a regular pulsator but declines, apparently shock initiated, occur at random intervals. This decline occurred at maximum pulsational velocity which seems to be the phase at which RY Sgr (Pugach 1977) and V854 Cen (Lawson et al. 1992) may also go into decline. Evidence of photospheric shocks in the form of line splitting has not been seen in the course of the pulsation, but is seen in RY Sgr (Danziger 1963; Cottrell & Lambert 1982; Lawson 1986; Lawson, Cottrell & Clark 1991; Clayton et al. 1994), a larger amplitude pulsator. One supposes that a pulsation of slightly above average amplitude occurs leading to the phenomena seen here at the 1995 onset. ( RY Sgr with a larger velocity amplitude pulsation but an otherwise very similar atmosphere is not more prone than R CrB to declines, and V854 Cen with a small velocity amplitude is especially susceptible to go into decline [Lawson & Cottrell 1997].)) This scenario may explain the decay of the transient emission lines. Stellar pulsation leads to periodic development and propagation of shocks that prove inadequate for the spawning of dust. An abnormal shock develops, possibly related to an abnormal pulsation, and dust grows in the unusually cool post-shock gas. This shock propagates outwards spawning dust. Transient emission lines come from lower altitudes primarily where gas densities are higher. At the passage of the next and regular shock, the gas is cycled through the shock but the post-shock gas is now warmer and unable to sustain dust growth or the flux in the transient emission lines. If the abnormal shock is not repeated, transient emission lines may last no more than about a single pulsational period of 40 days, as is observed. Dust formation continues at higher altitudes as the abnormal shock moves up, and the next normal shock encountering cooler and dustier gas than usual may also spawn dust.
If the seat of the trigger is the photosphere and its pulsations, there is the hope that continuous monitoring of R CrB will establish the time delay between a photospheric disturbance and the onset of a photometric decline. Such monitoring would also reveal whether the 1995 decline was typical or not. If the trigger is seated higher in the atmosphere, its first appearance may be unobservable spectroscopically except perhaps in the ultraviolet.
9.2 The Broad Emission Lines: Is R CrB a binary?
The broad emission lines betray the presence of hot dense high-velocity gas whose siting in the atmosphere of R CrB itself raises many problems. Our alternative site is an accretion disk around a compact companion to the supergiant, i.e., we propose that R CrB is a spectroscopic binary. Our interpretation was suggested in part by the discovery of broad emission lines in the spectrum of the white dwarf Mira B (Joy 1926, 1950). Deutsch (1958) recognized that (H-rich) gas captured from the wind fed by Mira A, the long-period variable, could be responsible for the emission lines. Warner (1972), Livio & Warner (1984), and Reimers & Cassatella (1985) invoked an accretion disk around Mira B as the site of the emission lines.
Introduction of the secondary and its accretion disk solves two principal puzzles presented by the broad lines - what is the excitation source for the He i lines, and why are the lines so broad? The fundamental energy source is the deep gravitational potential well provided by a white dwarf companion; gas flowing through the accretion disk is heated by ‘friction’. The width, as we show below, is simply due to the Keplerian velocity of gas in the disk close to the white dwarf. More fundamentally, a realization that R CrB is a binary with a compact companion suggests that this and some other R CrB stars may be the fruits of stellar evolution of a binary system.
Spectroscopic similarities between the width of R CrB’s broad emission lines and those from Mira B and other systems with accretion disks around white dwarfs provide suggestive but not conclusive proof that R CrB is also accompanied by a disk and a white dwarf. The clearest proof would come from radial velocity variations of R CrB itself and of the broad line emitting region.
The broad lines are detectable only when R CrB is about 5 or more magnitudes below maximum light. In the 1995-1996 decline the He i lines were detectable with profiles adequately defined for a radial velocity measurement for about 6 months (Table 5). To within the measurement errors, the velocity of the broad lines was constant. The only other measurement of the He i lines appears to be that by Herbig (1949) of the 3889Å line in 1949 February at a velocity essentially identical to that reported here which implies that either the observations sampled the radial velocity curve at a similar velocity or that R CrB is a single star and the He i lines are emitted by gas associated with R CrB itself.
In our search for orbital motion of R CrB, we examined the 149 measurements of radial velocity referred to in Sec. 3.1. As noted there, the complete set suggests a pulsational period of 42.6968 days or, if the oldest measurements are omitted, a period of 42.7588 days. In either case, there is little evidence for a longer-term (i.e., orbital) velocity variation. If R CrB is a spectroscopic binary, the lack of a detectable orbital velocity variation implies that the -velocity must be close to the mean velocity of 22 km s-1 and the (projected) velocity amplitude of R CrB is less than about 3 km s-1. (A notable oddity is the apparent absence of a pulsational variation in the measurements reported by Fernie et al. [1972]. This may be due to an unfortunate distribution of the measurements with respect to phase. These measurements may be fitted by the mean curve if it is displaced about 4 km s-1 to higher velocities. Perhaps, this displacement is the result of orbital motion.)
If the He i lines are associated with gas moving with the velocity of the secondary, the velocity amplitude of the secondary star is at least 30 km s-1, the velocity difference between the He i lines and the systemic velocity in the 1995-1996 decline. These estimates of the velocity amplitudes imply a mass ratio independent of the inclination of the orbit to the line of sight. The orbital period must be sufficiently long that the 6-month long observations of an essentially constant radial velocity from the He i lines are consistent with the predicted (slow) velocity variation. Although the required period is dependent on the orbital eccentricity, a period longer than about 2 years would seem to be demanded.
Brightness variations at 3.5m were reported by Stecker (1975) to be periodic with a period of 1100 days. This suggestion was reconsidered by Feast et al. (1997) who estimated that the period might be 1260 days. No suggestion was made that such a period was an orbital period. Since the warm infrared emitting dust is relatively distant from the star, the orbital diameter (see below) may be much smaller (say a few stellar radii) and ‘interference’ between the infrared flux and the location of the secondary seems unlikely. Optical polarization measurements of R CrB (Stanford et al. 1988; Clayton et al. 1997) indicate a preferred direction for ejection and/or accummulation of dust which conceivably could be an orbital plane; Clayton et al. propose a bipolar geometry.
It is readily shown that a circular orbit corresponding to a period of (say) 1260 days and a mass ratio of 10 corresponds to a separation of the two stars of about 630, and maximum radial velocity amplitudes of 2.3 and 23 km s-1 for a 2 R CrB star and a 0.2 companion respectively. The photospheric radius of R CrB is about 100 which is substantially smaller than the Roche lobe (). The secondary, if a compact object, is much smaller than its Roche lobe. These geometrical parameters are not greatly sensitive to the choice of period and mass ratio. In the accretion disk that is fed presumably by R CrB’s wind, Keplerian velocities of 200 km s-1 are attained at about 0.5 from the secondary. The observed velocities are dependent on the angle of inclination to the line of sight. The broad optically thick He i lines are presumed to be emitted by these inner regions of the disk. The broad forbidden lines are emitted by a much more extended region, say if cm-3. In order for the broad forbidden lines to reflect, as we assume, the orbital motion of the secondary, their emitting volume must be approximately centred on the secondary with a radius less than the separation between the two stars. This separation is about 6. With a slight increase in the assumed , can be made less than this separation.
The binary scenario makes qualitative sense geometrically. The least satisfactory aspect of the scenario concerns the stellar masses inferred from the lower limit to the mass ratio, an observational limit that is not dependent on the assumed orbital inclination. A mass of 2 for R CrB is about the maximum conceivable given the space distribution of these stars. At first glance, a white dwarf mass of less than 0.2 seems hardly credible. A lower mass for R CrB, say 1, implies a lower mass for the white dwarf, say 0.1. A mass of 0.1 - 0.2 for a white dwarf is less than the average mass of a white dwarf in the field or in a cataclysmic binary (Warner 1995). In a survey of cool white dwarfs, Bergeron, Ruiz & Leggett (1997) obtain masses for 108 stars of which only 8 have masses , and none have masses less than 0.25. A similar analysis of hotter white dwarfs (Bergeron et al. 1995) also found a scarcity of very low mass stars. Bergeron et al. (1997) note that some of the stars with masses less than 0.4 are double degenerate binaries for which their analytical technique underestimates the mass by perhaps a factor of 2. Others appear to be truly single stars for which “common envelope evolution is required to produce these low-mass degenerates because the Galaxy is not old enough to have produced them from single star evolution.” This inference may be a a clue to the evolutionary origin of R CrB: is it the product of common envelope evolution?
One can, however, find empirical support for the low secondary mass from the binary 89 Her (Arellano Ferro 1984; Waters et al. 1993). This well known F2 supergiant has an infrared excess and a spectrum rich in ‘sharp’ emission lines, characteristics shared with R CrB. Waters et al. remark that, on the assumption that the primary has a mass of 0.6, the most probable mass for the secondary is 0.086 with an a priori 90% probability that the secondary’s mass is less than 0.15. The orbital period of 89 Her is 288 days.
The He i broad lines presumably arise from the inner regions of the accretion disk. The disk’s cooler outer reaches may provide the lower excitation lines such as the Na i D lines. It is, perhaps, difficult in this scenario to understand why the widths of all broad lines are so similar. An alternative scenario such as a hot bi-polar wind raises the question of what powers the wind, a question that is quite naturally answered in the context of an accretion disk around a compact object.
The binary model is testable. Since declines occur at random intervals, the broad emission lines detected during these declines should be detected with both positive and negative velocity displacements relative to the systemic velocity. Studies of well observed RCBs show that declines occur at random times and thus cannot be linked to particular orbital phases.
With fascination, we note that Alexander et al. (1972) report a velocity difference of about 66 km s-1 between the broad emission line 3889Å and RY Sgr’s mean velocity. This difference was found on two occasions separated by about 200 days. This shift is of opposite sign to that we find for R CrB. Spite and Spite (1979) reported broad Na i D lines from RY Sgr redshifted by 37 km s-1 relative to Na i D and other sharp emission lines. At RY Sgr’s 1993 minimum, Asplund (1995) found broad and sharp Na i D lines at the same radial velocity and remarked that ‘this is contrary to the findings of Spite and Spite (1979) at the 1977 minimum’. Interestingly, the mean pulsational velocity also appears to change suggesting that RY Sgr may be in orbit around an unseen companion. Alexander et al. (1972) show the mean velocity between -5 and -10 km s-1 for 1969 and -10 to -12 km s-1 for 1970 but measurements by Lawson, Cottrell & Clark (1991) for 1988 give the mean velocity as -21 km s-1. A range of at least 10 to 15 km s-1 is indicated over a long period. Thus, there is data to suggest RY Sgr may be a binary.
Other reports of He i lines include the detection of the 7065Å line from S Aps (Goswami et al. 1997) where the line is essentially at the same velocity as the sharp emission lines but the broad Na i D lines are blue-shifted by about 100 km s-1 implying that in this star the broad He i and broad Na i D lines have a different kinematical origin. The He i 3889Å line was detected from U Aqr (Bond, Luck & Newman 1979), RS Tel (Feast & Glass 1973), and V CrA (Feast 1975). With the exception of S Aps, radial velocity measurements of the He i were not reported for these stars. In light of the fact that RCB’s may have radial velocity amplitudes of 10-20 km s-1 from pulsations (Lawson & Cottrell 1997), it will require dedication to search for low amplitude orbital velocity variations.
9.3 The Veiled Photospheric Spectrum
When R CrB faded to below V the character of the absorption line spectrum changed, as noted in Sec. 8.2. Key changes of character are a redshift of the line core amounting to 10-20 km s-1, development of line broadening and extended red wings, and a 50% decrease in equivalent width. These changes are qualitatively attributable to multiple scattering of the photospheric photons by circumstellar dust that is moving out from the star.
Van Blerkom & Van Blerkom (1978 - see also Herbig 1969, and Kwok 1976) summarize Monte-Carlo calculations of stellar light scattered off dust in a radially expanding, spherically symmetric, and optically thick cloud. If the velocity of expansion is larger than the velocity width of a stellar line, multiple scattering via the attendant Doppler shifts broadens and redshifts the line. When the optically thick shell is also geometrically extended, the core of the emergent line profile is shifted by about the shell’s expansion velocity with a red wing extending to a few times the expansion velocity. Qualitatively, this prediction matches the profiles observed around minimum light with the velocity of expansion indicated to be about 25 km s-1. On the other hand, if the cloud is optically thick but geometrically thin, the line is only slightly red-shifted and broadened. Van Blerkom & Van Blerkom give an eloquent explanation for the difference between profiles scattered by geometrically thick and thin shells. Spherical symmetry is probably not required, but to create a redshift, scattering clouds must be moving away from us. Indeed, the cloud causing the decline blocks the star so that we see light from the far side scattered off the receding dust also on the far side. It is perhaps surprising that the apparent redshift of the scattered photospheric lines is so small in light of the expansion velocity suggested by the high-velocity Na i D components (next section). Clouds causing the decline must be between us and the star. Scattering within such clouds will impose no more than a very small Doppler shift on the scattered photons observed at Earth.
Transition of the normal photospheric profiles to the broadened shallow profiles occurs when the light scattered by the extended cloud and received at earth is more intense than the light that penetrates the cloud causing the decline. If the extended cloud is a semi-permanent collection of clouds and photospheric light reaches this shell from all parts of the star except that blocked by the cloud causing the observed decline, one expects that no decline of R CrB can be fainter than about V . It has been assumed previously (e.g., Whitney et al. 1992 for V854 Cen) that the light received during a long flat decline is not direct light absorbed by the new cloud but light that is scattered by the other clouds. Our high resolution spectra rather directly confirm this assumption in the case of R CrB - see also Rao & Lambert (1993) for confirmation for V854 Cen.
Scattering of starlight off dust will not change an absorption line’s equivalent width but the broadened shifted lines seen at minimum light have a 50% smaller equivalent width than their counterparts at other times. This could be an apparent change due to very severe broadening and the loss of very extended wings due to the limited S/N ratio of the spectra. Observations of the high-velocity absorption in the Na i D lines suggests gas and, therefore, dust clouds can move at 200 km s-1. Scattering off such clouds will broaden lines by 200 to 300 km s-1 and result in very shallow very broad lines that will be difficult to detect except at high S/N ratio. Thermal emission by the ensemble of distant dust clouds or the cloud causing the decline is unlikely to dilute the line spectrum.
Additional information could be gleaned from the wavelength dependence of the broadening and dilution of the absorption lines. Unfortunately, strong absorption lines at wavelengths shorter than those of the line sample considered here are low-excitation lines whose absorption profile is obscured by overlying sharp emission. Clayton et al. (1997) finds from spectropolarimetry near minimum light that red light is stellar light passing directly through the new dust cloud but the blue light is scattered off an extended dusty region, a region they identify as a bipolar flow off R CrB. This identification seems at odds with our scenario but Clayton et al.’s observation refers to early 1996 April when our spectra show the absorption line spectrum to be returning to its normal form. Regrettably, spectropolarimetry at minimum light has not been reported. However, as predicted by our model, the spectropolarimetric observations of V854 Cen at deep minimum do not show a change in position angle with wavelength (Whitney et al. 1992).
9.4 High-velocity Ejection of Gas
Broad absorption lines blue-shifted by 100-200 km s-1 were seen in the Na i D lines during the recovery from minimum light. Their presence appears to be related to recovery from minimum light. In the recovery from this decline, absorption was not seen in the Ca ii H and K lines implying that the ejecta were primarily neutral.
As argued in the previous section, direct light passing through the cloud causing the decline is a very minor contributor to total light at magnitudes fainter than about 12.5 in the visual. Then, the gas associated with this cloud cannot be seen in absorption at minimum light. As the recovery progresses, the cloud thins and direct light transmitted through the cloud dominates the spectrum. This thinning is seen in the return of the photospheric absorption line spectrum to its normal appearance. At this stage, sodium atoms in the associated gas are detectable in the spectrum. Acceleration of the gas is due to the radiation pressure on the grains and the momentum transfer by collisions between dust and gas. The velocity - time plot for the broad absorption lines (Fig. 25) suggests acceleration began in early 1996 January when the star was at minimum light. The average acceleration is about 1 km s-1 day-1. Perhaps fortuitously this is close to the prediction illustrated by Fadeyev (1988 - see his Figure 4). An alternative view is that acceleration of the gas began earlier but was undetected because from mid 1995 November to early 1996 April the contribution of light transmitted through the cloud to the total light was very slight. In this picture, the initial velocity of about 80 km s-1 was attained over a longer period extending from the onset of decline when dust first formed to the first appearance of the high-velocity Na i D absorption lines, an interval of about 100 days. In the initial stages, the gas at a low expansion velocity would be difficult to detect owing to blending with the strong sharp emission line. A series of spectra throughout a decline that led to a minimum in which the photosphere was directly observable throughout should betray the acceleration of the gas in the dust cloud responsible for the decline.
There has been an extended debate about the initial location of dust formation. Scenarios are usually characterized as ‘near’ and ‘far’ from the star. ‘Near’ and ‘far’ imply formation at about 2 and 20 stellar radii respectively. The acceleration is a potential clue to the location of the dust. Fadeyev’s calculation refers to gas forming at about 20 - 25 stellar radii from the star. Approximate equality of observed and predicted accelerations implies that the dust and gas by early 1996 was at this distance. Our discovery of the photospheric trigger implies that dust condensed initially much closer to the star. All other things being equal, the radiative force on the grains scales inversely with the square of the distance from the star. Then, the acceleration of dust formed ‘near’ the star would be about 400 times greater than Fadeyev’s prediction. Although the gas would have lagged behind the dust, one expects this acceleration of the dust to have led to an observable high velocity in resonance lines such as the Na i D and Ca ii H and K lines. This was not observed. There are several ways to reduce the initial acceleration in the case that dust forms near the star. Not only does the radiative force increase with decreasing distance from the star but so does the drag exerted by the gas because presumably the gas density in the cloud is higher near the star. In the initial phases of the decline when dust formation may be a continuing process, the dust to gas ratio is low and the drag on the grains necessarily higher than later in the decline. Additionally, dust formation near the star may result in a lower dust to gas ratio yet with adequate dust to initiate a decline. After the cloud becomes very optically thick, stellar photons will be multiply scattered and most likely absorbed such that the outer parts of the cloud experience a much reduced radiative force. In short, predictions about the initial acceleration of dust and gas formed near the star seem presently uncertain.
A change in the gas to dust ratio may occur as the cloud disperses and recovery to maximum light commences. Before dispersal of the cloud, sodium atoms and calcium ions may be largely condensed out onto the grains. As dispersal ensues, the equilibrium ratio of free atoms to atoms condensed onto grains necessarily shifts in favour of the former as collisions between atoms/ions and grains decrease in frequency as the grains separate. Moreover, photons now penetrate the cloud and ejection of atoms from grains may proceed at an accelerated rate. This simple picture of an very optically thick cloud at minimum light accounts for the correlation between the appearance of the broad lines and the onset of the recovery phase.
9.5 Sharp Emission Lines - A Circumbinary Disk?
A variety of observational clues point to the location of the gas emitting the sharp emission lines. There are now strong indications that the lines are present at all times and, in sharp contrast to the transient lines, are not a product of the decline. Perhaps most significant is the fact that the lines, except for a drop in flux which occurs much later than the decline of the photospheric flux, are quite unaffected by the decline; their velocity, profile, and degree of excitation and ionization are unchanged from onset to recovery. There is no evidence for interaction between the decline’s fresh dust cloud and the emitting region from which we suppose that the late drop in flux is caused by occultation of a part of the emitting region and not by a quenching of the region.
Although observational material is limited, it appears that the results gathered here are representative of earlier declines of R CrB, and of declines of RY Sgr, and V854 Cen. In particular, the sharp emission lines show a blueshift of up to about 10 km s-1 relative to the stellar systemic velocity in all well studied cases. This consistency and the absence of redshifts shows that the asymmetry observed at Earth is quite unlikely to result from an asymmetric distribution of gas and dust around the star; an asymmetric distribution constructed without knowledge of the Earth’s location must provide redshifts as well as blueshifts across a sample of RCBs.
We shall assume that the emitting gas is distributed symmetrically with respect to either R CrB, the putative companion, or the binary. The gas is sited about 20 from the star in a thin layer. One possibility is that the gas is in a wind off R CrB, the companion, or the binary. The wind may be spherically or axially symmetric. Distribution of the permanent dust clouds affects the observed line flux and profile. We assume the dust is distributed in either a spherical shell or a torus. A non-spherical or toroidal distribution of dust is suggested by the observational indications for a preferred plane for dust ejection. Since the dust shell’s radius is seemingly much larger than the binary separation (6?), the distinction between a shell centred on R CrB or its companion is immaterial. As viewed from Earth, the emission lines are blue-shifted with respect to R CrB. Gas moving away from us must then be either partially occulted by the star and/or seen through the dust in the extended dust cloud.
An expanding spherical shell with atoms everywhere within it moving outwards at a constant velocity provides a flat-topped emission profile for optically thin lines with a width 2 (Beals 1931) when the atomic emission coefficient has a profile much narrower than 2, and in other circumstances the observed profile is a convolution of the flat-topped shell profile and that of the atomic emission coefficient. In the present case, the two profiles would seem to be of comparable width with km s-1 so that their convolution produces a quasi-Gaussian profile. The observed blueshift of about 4 km s-1 implies a relative reduction of intensity from the receding half of the emitting region.
If gas and dust are distributed in spherical shells of radii and respectively, the star occults a very small fraction of the receding gas: fraction of gas shell that is occulted is for . With the dust exterior to the gas, all regions of the gas shell are seen through the front of the dust shell and approaching and receding regions are subject to the same extinction. In short, this geometry does not provide a blue-shifted emission line of the magnitude observed. Of course, one may suppose the gas shell’s receding half to be thinner than the approaching half but then the model is in conflict with the seemingly universal evidence for blue-shifted sharp emission lines. A larger blueshift would result if the emitting gas is placed outside the dust shell (i.e., ) but this seems in conflict with estimates of the shell radii.
If the dust is confined to a torus, a line of sight grazing the lip of the torus provides a better view of the far side of the torus than the nearside. If the gas inside the central hole of the torus is expanding radially, the net profile of the visible emitting gas will be redshifted not blueshifted. An inward flow of gas does not seem likely, and, therefore, we reject this model. If the gas is rotating and the gas on the farside from the observer’s view is rotating towards us, a blue-shift is expected. But, as the direction of rotation must differ from one RCB to another, this geometry would provide redshifts as often as blueshifts across a sample of RCBs. It does seem, however, that blueshifts are universal. We reject models with gas and dust in tori.
Our third possibility considers a spherically symmetric wind and a toroidal distribution of dust. If the inner radius of the dust torus is less than the inner radius of those portions of the wind emitting the sharp lines, the effect of the dust torus is to decrease the intensity of the redshifted relative to the blueshifted photons. The effect is a maximum for a line sight perpendicular to the torus and vanishes for lines of sight in the plane of the torus. This geometry may be the simplest that meets the observational conditions including the existence of a preferred plane for dust ejection. The line of sight to R CrB must obviously lie close to the preferred plane or declines would not be seen. Unfortunately, such a direction minimizes the blueshift. The allowed misalignment between plane and line of sight and, hence, the magnitude of the blueshift, depends on the thickness of the torus, the inner shell radius of the torus, on the degree of asymmetry in the wind, and the allowed ejection angle of dust near the star. Within this parameter space, it should be possible to generate the observed blueshift.
An outstanding question remains - how is gas distant from the star maintained at the physical conditions of the sharp line emitting gas. Recall that the gas pressure is representative of that within a few pressure scale heights of the photosphere. Is it possible that the sharp lines are emitted by compressed gas behind a shock that develops in the wind far from the star? Are the broad lines with their larger blue shifts related to the wind and its shock?
10 Concluding Remarks
Our study of R CrB’s 1995-1996 decline has provided a wealth of new data on this fascinating episode. It is noteworthy that this decline was preceded by a long period at which the star was at or near maximum light and, therefore, the spectroscopic phenomena are almost certainly attributable to the 1995-1996 decline and not to the tailends of earlier declines. This situation may be sharply contrasted with the case of V854 Cen which declines so frequently that spectroscopic changes resulting from one decline may overlap those of another.
Onset of the 1995-1995 decline is strikingly correlated with a disturbance of the photospheric lines followed by the short-lived appearance of emission lines including lines of high excitation that we refer to as transient lines and seem to be the E1 lines according to Alexander et al.’s (1972) use of the terms E1 and E2. The sharp emission or E2 lines are present throughout the decline unchanged till the star is well into the minimum (mV about 11 to 12). Their emitting region is remote from the star and is affected to a much lesser extent than the photosphere by the growth of the dust cloud responsible for the 1995 decline. Our new data are especially extensive for the broad permitted and forbidden lines. An intriguing result is the velocity shift of about 30 km s-1 of the broad lines relative to R CrB’s mean radial velocity and to the sharp emission lines. If this shift is interpreted as orbital motion of the broad lines’ emitting gas relative to R CrB, we argue that the secondary must be a low mass object such as a white dwarf of about 0.2. We noted the parallel with another enigmatic binary, 89 Her. If the broad He i lines are attributed to the accretion disk around the white dwarf, one is provided with a natural explanation for the heating and velocity of the emitting gas. We noted that our proposal that R CrB is a previously unsuspected binary is testable with patience.
A key task for the future is to measure R CrB’s broad lines’ radial velocity at a series of deep declines, or, at maximum light, from the broad lines that are expected to be present in ultraviolet spectra obtainable with the Hubble Space Telescope. The C ii 1335Å multiplet is definitely present at maximum light in R CrB (Holm et al. 1987) Unfortunately, the IUE spectra from 1978-1984 lack the resolution to assign the feature to the broad line category. The fact that R CrB’s 1335Å flux remained sensibly constant from maximum light into a decline at depth of about 4 magnitudes is suggestive of an association with the broad-line region probed by our spectra. Unfortunately, the sharp lines in the 1995-1996 decline also exhibited near-constant flux until the star had declined by more than 5 magnitudes.
Optical and ultraviolet spectroscopy of other RCBs in decline and at maximum light is also of great importance. Optical observations in deep declines where broad emission lines may appear should be most valuable. Accurate velocities are needed for comparison with the systemic velocities that, in many cases, have yet to be determined to the desired accuracy. The C ii 1335Å multiplet is present in RY Sgr’s spectrum (Holm & Wu 1982; Clayton et al. 1999). This multiplet and C iv 1550Å are present in V854 Cen’s spectrum at maximum light (Lawson et al. 1999); the photospheric contribution to the spectrum was undetectable on the available IUE spectra. The 1550Å line is not present in RY Sgr’s spectrum at maximum light above the photospheric continuum as observed with HST/STIS (Clayton et al. 1999). None of these observations of ultraviolet spectra provide the spectral resolution to distinguish broad from sharp emission lines. We would expect the C iv 1550Å doublet to belong to the category of broad lines. The C ii lines at 1335 and also at 2325Å (Clayton et al. 1992; Clayton et al. 1993) might be a mix of broad and sharp lines.191919For V854 Cen observed at minimum light, Clayton et al. (1993) claimed that low-resolution IUE spectra showed splitting or doubling at a particular pulsational phase. Our examination of these IUE spectra in the final archive shows the lines to single and unsplit, a conclusion also reached by Lawson et al. (1999). In our picture, broad lines from an accretion disk around a secondary star cannot be affected by shocks in the primary’s photosphere. Observational evidence for profile variations of a broad line correlated with the primary’s pulsation would be incompatible with our attribution of these lines to an accretion disk. Lawson et al. (1999) and Clayton et al. (1992) found fading of flux in the suspected broad lines in UV region (eg. Mg ii etc.) in some declines. It is possible on occasion when the ejected dust cloud grows to large dimensions, it could occult part of broad emission line region resulting in some reduction in emission line flux.
At issue is not simply whether R CrB has a companion. The presence of a companion may be a long awaited clue to the evolutionary origins of these stars. The RCB family is largely homogeneous according to chemical composition. Asplund et al. (1999 - see also Lambert & Rao 1994, and Rao & Lambert 1996) show that a majority of known RCB stars have a composition quite similar to that of the eponym. A minority have strikingly different compositions. The similarity suggests that the majority may have a common origin. Then, if R CrB is a binary, one might expect the other majority members also to be binaries. One proposal for forming RCBs invokes a binary – the merger of a He white dwarf with a C-O white dwarf (Schönberner 1986, 1996; Iben, Tutukov, & Yungelson 1996). The pair began as main sequence stars and a common envelope event began the merger process that may be completed by the emission of gravitational radiation. As considered to date, this process produces an RCB as a single star. This model is most unlikely to account for the wide binary that is conjectured here for R CrB; the merger process requires contact between the white dwarfs but the separation between R CrB and its companion in our model is about 105 times larger. Then, a clear demonstration that R CrB is a binary will imply that either R CrB was formed by mass transfer across a wide binary or the companion is a relatively innocent bystander. The latter possibility will be difficult to sustain if it can be shown that binarity is common among the majority sample.
What is clearly needed from observers is a concerted long term exploration of RCBs, both in decline and at maximum light. Ultraviolet spectroscopy should reveal broad lines even at maximum light. Observations of these lines repeated at intervals may reveal the orbital velocity variations of the secondary and its accretion disk. Spectroscopy of RCBs in deep declines should be pursued and velocity measurements made on the broad emission lines. These should eventually show the orbital velocity of the secondary. Precise and frequent observations of the RCBs velocities may reveal the orbital velocity of the RCB primary, but this will be difficult as the pulsational amplitude may exceed the orbital amplitude in most cases. The ultimate goal is an important one: understanding the evolutionary origins of the most enigmatic of variable stars.
11 Acknowledgements
This paper is dedicated to Mike Marcario who monitored R CrB at our request and alerted us to the onset of the 1995 decline. Sadly, Mike died before the paper was completed. We thank the AAVSO, Yu. Efimov and Don Fernie for unpublished photometry, Peter Cottrell for comments on a draft of the paper, Suzanne Hawley for assistance at the telescope, A. V. Raveendran and R. Surendiranath for their assistance with calculations, and Peter Woitke for helpful conversations about shocks. We are grateful to Yaron Sheffer for providing IUE spectra at short notice and to the referee, Geoff Clayton, for several helpful comments. This research was supported in part by the National Science Foundation (grant AST 9618414).
References
- [1] Alexander J.B., Andrews P.J., Catchpole R.M., Feast M.W., Lloyd Evans T., Menzies J.W., Wisse P.N.J., Wisse P., 1972, MNRAS, 158, 305
- [2] Aller L.H., 1984, Physics of Thermal Gaseous Nebulae, Reidel, Dordrecht
- [3] Arrellano Ferro A., 1984, PASP, 96, 641
- [4] Asplund, M., 1995, A&A, 294, 763
- [5] Asplund M., Gustafsson B., Kiselman D., Eriksson K. 1997, A&A, 318, 521
- [6] Asplund M., Gustafsson B., Lambert D.L., Rao N.K., 1999, A&A, in press
- [7] Beals C.S., 1931, MNRAS, 91, 966
- [8] Bergeron P., Ruiz M.T., Leggett S.K., 1997, ApJS, 108, 339
- [9] Bergeron P., Wesemael F., Lamontagne R., Fontaine G., Saffer R.A., Allard N.F., 1995, ApJ, 449, 258
- [10] Bond H.E., Luck R.E., Newman M.J., 1979, ApJ, 233, 205
- [11] Clayton G.C., 1996, PASP, 108, 225
- [12] Clayton, G.C., Ayres, T.R., Lawson, W.A., Drilling, J.S., Woitke, P., Aslpund, M., 1999, ApJ, 515, 351
- [13] Clayton G.C., Bjorkman K.S., Nordsieck K.H., Zellner N.E.B., & Schulte-Ladbeck R.E., 1997, ApJ., 476, 870
- [14] Clayton, G.C., Lawson, W.A., Cottrell, P.L., Whitney, B.A., Stanford, S.A., de Ruyter, F., 1994, ApJ, 432, 785
- [15] Clayton, G.C., Lawson, W.A., Whitney, B.A., Pollacco, D.L., 1993, MNRAS, 264, L13
- [16] Clayton G.C., Whitney B.A., Meade M.R., Babler B., Bjorkman K.S., Nordsieck K.H., 1995, PASP, 107, 416
- [17] Clayton, G.C., Whitney, B.A., Stanford, S.A., Drilling, J.S., Judge, P.G., 1992, ApJ, 384, L19
- [18] Cottrell P.L., Lambert D.L., 1982, Observatory, 102, 149
- [19] Cottrell P.L., Lawson W.A., Buchhorn M., 1990, MNRAS, 244, 149
- [20] Danziger I.J., 1963, Ph. D. Thesis, Australian National Univ.
- [21] Deutsch A.J., 1958, AJ, 63, 49
- [22] Efimov Yu.S., 1997, private communication
- [23] Espin T.E., 1890, MNRAS, 51, 12
- [24] Fadeyev Yu.A., 1986, in Hunger K., Schönberner D., Rao N.K., eds., Hydrogen Deficient Stars and Related Objects, Dordrecht: Reidel, p.441
- [25] Fadeyev Yu.A., 1988, MNRAS, 233, 65
- [26] Feast M.W., 1975, in Sherwood V.E., Plaut L., eds, Variable Stars and Stellar Evolution, Dordrecht, Reidel, p.129
- [27] Feast M.W., 1979, Bateson F.M., Smak J., Ulrich I.M., eds., Changing Trends in Variable Star Research, Univ. of Waikato, Hamilton, p.246
- [28] Feast M.W., 1996, in Jeffery C.S., Heber U., eds., Hydrogen-Deficient Stars, ASP Conf. Ser.,96 , 3
- [29] Feast, M.W., Carter, B.S., Roberts, G., Marang, F., Catchpole, R.M., 1997, MNRAS, 285, 317
- [30] Feast M.W., Glass I.S., 1973, MNRAS, 161, 293
- [31] Fernie J.D., 1989, PASP, 101, 166
- [32] Fernie J.D., 1991, PASP, 103, 1091
- [33] Fernie J.D., 1995, private communication
- [34] Fernie J.D., 1997, private communication
- [35] Fernie J.D., Lawson W.A. 1993, MNRAS, 265, 899
- [36] Fernie J.D., Seager S., 1994, PASP, 106, 1138
- [37] Fernie J.D., Sherwood V., DuPuy D.L., 1972, ApJ, 172, 383
- [38] Forrest W.J., Gillett F.C., Stein W.A., 1971, ApJ, 170, L29
- [39] Forrest W.J., Gillett F.C., Stein W.A., 1972, ApJ, 178, L129
- [40] Giridhar S., Lambert D.L., Gonzalez G., 1998, ApJ, 509, 366
- [41] Gorynya N.A., Rastorguev A.S., Samus, N.N. 1992, Soviet Astr. Letters, 18, 142
- [42] Goswami A., Rao N.K., Lambert D.L., Smith V.V., 1997, PASP, 109, 270
- [43] Herbig G.H., 1949, ApJ, 110, 143
- [44] Herbig G.H., 1953, Observatory, 73, 71
- [45] Herbig G.H., 1968, Mém. Soc. Roy. Sci. Liège, 18, 353
- [46] Herbig G.H., 1969, Mém. Soc. Roy. Sci. Liège, 19, 13
- [47] Herbig G.H., 1990, private communication
- [48] Holm A.V., Hecht J., Wu C.-C., Donn B., 1987, PASP, 99, 497
- [49] Holm A.V., Wu C.-C., 1982, Kondo Y., Mead J., Chapman R.D., eds., Advances in Ultraviolet Astronomy: Four Years of IUE Research, NASA CP-2238, p.429
- [50] Iben I. Jr., Tutukov A.V., Yungelson L.R., 1996 in Jeffery C.S., Heber U., eds., Hydrogen-Deficient Stars, ASP Conf. Ser., 96, 409
- [51] Joy A.H., 1926, ApJ, 63, 281
- [52] Joy A.H., 1954, ApJS, 1, 39
- [53] Keenan P.K., Greenstein J.L. 1963, Contr. Perkins Obs., Ser. II, 13, 198
- [54] Kwok S., 1976, JRASC, 70, 49
- [55] Lambert D.L., Heath J., Lemke M., Drake J.J., 1996, ApJS, 103, 183
- [56] Lambert D.L., Rao N.K., 1994, JAA, 15, 47
- [57] Lambert D.L., Rao N.K., Giridhar S., 1990, JAA, 11, 475
- [58] Lawson W.A., 1986, in Hunger K., Schönberner D., Rao N.K., eds., Hydrogen Deficient Stars and Related Objects, Dordrecht: Reidel, p.211
- [59] Lawson W.A., Cottrell P.L., 1997, MNRAS, 285, 266
- [60] Lawson W.A., Cottrell P.L., Clark M., 1991, MNRAS, 251, 687
- [61] Lawson W.A., Cottrell P.L., Gilmore A.C., Kilmartin P.M., 1992, MNRAS, 256, 339
- [62] Lawson, W.A., Maldoni, M.M., Clayton, G.C., Valencic, L., Jones, A.F., Kilkenny, D., van Wyk, F., Roberts, G., Marang, F., 1999, AJ, in press
- [63] Livio M., Warner B., 1984, Observatory, 104, 152
- [64] Martin G.A., Fuhr J.R., Wiese W.L., 1988, J. Phys. Chem. Ref. Data, 17, No. 3
- [65] McCarthy J.K., Sandiford B.A., Boyd D., Booth J., 1993, PASP, 105, 881
- [66] Mendoza C., 1983 in Flower D.R., ed., Planetary Nebulae, Dordrecht, Reidel, p.43
- [67] Moore C.E., 1993, Tables of Spectra of Hydrogen, Carbon, Nitrogen, and Oxygen Atoms and Ions, CRC Press, Boca Raton
- [68] O’Keefe J.A., 1939, ApJ, 90, 294
- [69] Pandey G., Rao N.K., Lambert D.L., 1996, MNRAS, 282, 889
- [70] Payne-Gaposchkin C., 1963, ApJ., 138, 320
- [71] Pugach A.F., 1977, Inf. Bull. Variable Stars, 1277
- [72] Rao N.K., 1974, Ph.D. Thesis, Univ. Cal. Santa Cruz
- [73] Rao N.K., Lambert D.L., 1993, AJ, 105, 1915
- [74] Rao N.K., Lambert D.L., 1996, in Jeffery C.S., Heber U., eds., Hydrogen-Deficient Stars, ASP Conf. Ser., 96, 43
- [75] Rao N.K., Lambert D.L., 1997, MNRAS, 284, 489
- [76] Rao N.K., Nandy K., 1986, MNRAS, 222, 357
- [77] Raveendran A.V., Ashoka B.N., & Rao N.K., 1986, in Hunger K., Schönberner D., Rao N.K., eds., Hydrogen Deficient Stars and Related Objects, Dordrecht: Reidel, p.191
- [78] Reimers D., & Cassatella A., 1985, ApJ, 297, 275
- [79] Risberg G., 1968, Ark. Fys., 37, 231
- [80] Schönberner D., 1986, in Hunger K., Schönberner D., Rao N.K., eds., Hydrogen Deficient Stars and Related Objects, Dordrecht: Reidel, p.471
- [81] Schönberner D., 1996 in Jeffery C.S., Heber U., eds., Hydrogen-Deficient Stars, ASP Conf. Ser., 96, 433
- [82] Spite F., Spite M., 1979, A&A, 80, 61
- [83] Stanford S.A., Clayton G.C., Meade M.R., Nordsieck K.H., Whitney B.A., Murison M.A., Nook M.A., Anderson C.M., 1988, ApJ, 325, L9
- [84] Stecker D.W., 1975, AJ, 80, 451
- [85] Surendiranath R., Rangarajon K.E., Rao N.K., 1986, in Hunger K., Schönberner D., Rao N.K., eds., Hydrogen Deficient Stars and Related Objects, Dordrecht: Reidel, p.199
- [86] Tull R.G., MacQueen P.J., Sneden C., Lambert D.L., 1995, PASP, 107, 251
- [87] Van Blerkom J., Van Blerkom D., 1978, ApJ, 225, 482
- [88] Vanture A.D., Wallerstein G., 1995, PASP, 107, 244
- [89] Viotti R., 1976, ApJ, 204, 293
- [90] Wamsteker W., 1981, A&A, 97, 329
- [91] Warner B., 1972, MNRAS, 159, 95
- [92] Warner B. 1995, Cataclysmic Variables, Cambridge Univ. Press, Cambridge
- [93] Waters L.B.F.M., Waelkens C., Mayor M., Trams N.R., 1993, A&A, 269, 242
- [94] Whitney B.A., Clayton G.C., Schulte-Ladbeck R.E., Meade M.R., 1992, AJ, 103, 1652
- [95] Woitke P., 1997, Thesis, Tech. Univ. Berlin
- [96] Woitke P., Goeres A., Sedlmayr E., 1996, A&A, 313, 217