Contribution to the proceedings of ‘Astrophysical Dynamics’
(Evora, April 14-16, 1999); to appear in Ap&SS.
Preprint available at http://www.xray.mpe.mpg.de/~skomossa
Abstract
We present here an analysis of the X-ray properties of a sample of LINER galaxies observed with the ROSAT PSPC and HRI instruments. A spatial analysis shows that the bulk of the X-ray emission is consistent with arising from a point source; some extended emission appears at weak emission levels. The X-ray spectra are formally best described by a powerlaw with photon index or thermal emission from a Raymond-Smith plasma with highly subsolar abundances (). Several emission mechanisms that might contribute to the observed X-ray spectra are discussed. In particular, we take the very subsolar abundances derived from Raymond-Smith fits as an indication of a more complex emission mechanism, like the presence of a second hard component or plasma out of equilibrium.
1 Introduction
Low-ionization nuclear emission line regions, LINERs, are characterized by their optical emission line spectrum which shows a lower degree of ionization than active galactic nuclei (AGN). Their major power source and line excitation mechanism have been a subject of lively debate ever since their discovery. If powered by accretion, they probably represent the low-luminosity end of the quasar phenomenon and their presence has relevance to, e.g., the evolution of quasars, the faint end of the Seyfert luminosity function, the soft X-ray background, and the presence of SMBHs in nearby galaxies. A detailed study of the LINER phenomenon is thus very important. X-rays are a powerful tool to investigate the presence of an active nucleus within the LINER galaxies via X-ray variability and luminosity, and to explore the physical properties of LINERs in general. An analysis of ASCA spectra of several low-luminosity AGN including 5 LINERs (Ptak et al. 1999) revealed the presence of a hard powerlaw–like emission component plus soft thermal emission.
Here, we present a study of 13 LINERs observed in the soft X-ray spectral region (0.1–2.4 keV) with the instruments on-board ROSAT. All of them were targets during the ROSAT all-sky survey, some of them detected for the first time in X-rays, and for 8 of them additional pointed PSPC and/or HRI observations are available. Luminosities given below are based on =75 km/s/Mpc; distances of very nearby galaxies were taken from Tully’s (1988) catalog.
2 Results of the X-ray analysis
The results can be summarized as follows (see Komossa et al. 1999 for the full analysis):
-
•
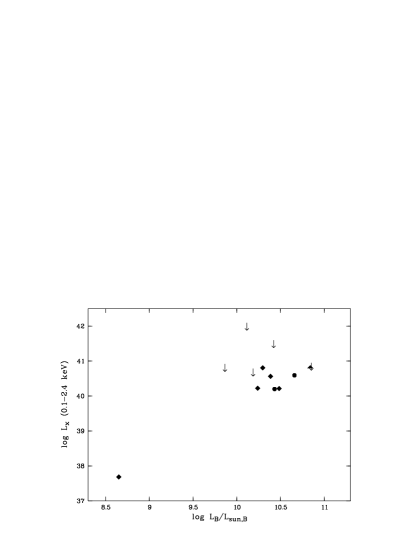
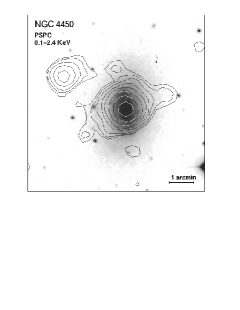
X-ray luminosities range between (NGC 404) and 40.8 (NGC 4450). The ratios /, when compared to early-type galaxies, are located in the intermediate region of the diagram (Fig. 1; see Komossa et al. 1999 for an explicit comparison with elliptical galaxies) and similar emission mechanisms may contribute to the observed X-ray luminosities.
-
•
Whereas the bulk of the X-ray emission from the LINERs is consistent with arising from a point source there is some extended emission seen at weak emission levels in some sources.
-
•
We do not detect any short timescale (hours to weeks) temporal variability. This is consistent with the earlier suggestion that LINERs may accrete in the advection-dominated mode. Only one source, NGC 2768, is slightly variable on a timescale of months.
-
•
The X-ray spectra of the LINER galaxies show some spectral variety. Half of them are best described by a powerlaw of photon index whereas the other ones are best matched by a Raymond-Smith model with 0.6 keV and heavily depleted metal abundances. Below, we discuss possible explanations for the unusually low inferred abundances.
3 X-ray emission mechanisms
Some sources are best described by a single AGN-like powerlaw with X-ray luminosity above that expected from discrete stellar sources. These spectra most likely indicate the presence of low-luminosity AGNs in the centers of these LINER galaxies. We concentrate here on possible explanations for the very low metal abundances (1/10 – 1/20 solar) formally derived for the other sources when a Raymond-Smith model is fit.
Presence of a second hard component. One way to avoid heavily depleted abundances is to invoke a second hard X-ray spectral component (see the discussion in Buote & Fabian 1998, Komossa & Schulz 1998, and Komossa et al. 1998 for details). The second component could be of powerlaw shape and originate from a low-luminosity AGN (LLAGN), or it could be hot thermal emission from an extended component. The two possibilities cannot be distinguished by spectral fits to ROSAT data.
Alternatively, the emitting gas might show a range of temperatures. Strickland & Stevens (1998) carefully discussed this possibility by simulating an expanding superbubble under the assumptions of axial symmetry and collisional ionization equilibrium (CIE). They find that by fitting a single-temperature model to ROSAT data instead of a multi-temperature one, the true metal abundances are heavily underestimated.
However, nature may be even more complicated. If the plasma is not in CIE, the density and temperature structure of the emitting region cannot be reproduced by a finite one-parameter family of curves with merely differing temperatures, since each ionization stage of each ion would have its ‘own temperature’.
Non-equilibrium effects in a hot extended plasma component. When applying Raymond-Smith or similar codes, the assumption of CIE has to be kept in mind. In optically thin plasmas such an assumption can never be strictly fulfilled, since collisional ionization and radiative recombination are not statistically inverse processes, and therefore can only hold in an approximate sense. If in addition the plasma is in motion, e.g. due to its origin in a superbubble or galactic wind, the adiabatic cooling timescale can be shorter than any timescale associated with atomic processes. The resulting spectrum may then be dominated by a strong contribution from delayed recombination of highly ionized species (Breitschwerdt & Schmutzler 1994, 1999). The kinetic temperature of the electrons in the X-ray emitting plasma is typically much lower than in a CIE plasma, and collisional ionization contributes mainly to very soft X-ray or UV emission. Thus a two- or multitemperature plasma can be mimicked, as far as the spectral resolution of current X-ray detectors is concerned. Sub-solar ‘Raymond-Smith abundances’ can also be obtained with non-CIE spectra from a galactic outflow, folded through the ROSAT detector response matrix, as we have verified by preliminary calculations of non-CIE models.
In conclusion, both effects (the presence of a LLAGN and non-equilibrium plasma) are likely to play a role to some extent. The importance of the latter also depends on the origin of the gas. The galaxies of the present sample are mostly type S0 and SA. Whereas in ellipticals the extended gas is ‘old’ and the standard equilibrium assumptions may be justified, in spirals a contribution from a young starburst that drives superwinds is well possible. In that case the gas is likely to be far from equilibrium (see the discussion in Breitschwerdt et al. 1999 and these proceedings).
Given the spectral variety of LINERs with contributions from several emission components, future studies of both, spectra of individual objects as well as larger samples will certainly give further insight into the LINER phenomenon which provides an important link between active and ‘normal’ galaxies.
References
- [] Breitschwerdt D., Schmutzler T., 1994, Nat 371, 774
- [] Breitschwerdt D., Schmutzler T., 1999, A&A in press; astro-ph/9902268
- [] Buote D.A., Fabian A.C., 1998, MNRAS 296, 977
- [] Komossa S., Schulz H., Greiner J., 1998, A&A 334, 110
- [] Komossa S., Schulz H., 1998, A&A 339, 345
- [] Komossa S., Böhringer H., Huchra J., 1999, A&A, in press
- [] Ptak A., Serlemitsos P., Yaqoob T., Mushotzky R., 1999, ApJS in press; astro-ph/9808159
- [] Strickland D.K., Stevens I.R., 1998, MNRAS 297, 747
- [] Tully R.B.: 1988, Nearby galaxies catalog, Cambridge Univ. Press