Is I Zw 18 a young galaxy?
Abstract
Hubble Space Telescope (HST)111Based on observations obtained with the NASA/ESA Hubble Space Telescope through the Space Telescope Science Institute, which is operated by AURA, Inc. under NASA contract NAS5-26555. colour - magnitude diagrams in , and along with long-slit Multiple Mirror Telescope (MMT)222Ground-based spectroscopic observations presented herein were obtained with the Multiple Mirror Telescope, a facility operated jointly by the Smithsonian Institution and the University of Arizona. spectrophotometric data are used to investigate the evolutionary status of the nearby blue compact dwarf (BCD) galaxy I Zw 18. We find that the distance to I Zw 18 should be as high as 20 Mpc, twice the previously accepted distance, to be consistent with existing observational data on the galaxy: colour-magnitude diagrams, the high ionization state of the gas and presence of WR stars in the main body, and the ionization state of the C component. The spectral energy distribution (SED) of the main body of I Zw 18 is consistent with that of a stellar population with age 5 Myr. However, the presence of large-scale shells observed around the main body suggests that star formation began 20 Myr at the NW end and propagated in the SE direction. Our analysis of colour-magnitude diagrams and of the spectral energy distribution of the C component implies that star formation in this component started 100 Myr ago at the NW end, propagated to the SE and stopped 15 Myr ago. Thus, I Zw 18 is likely to be one of the youngest nearby extragalactic objects.
Key Words.:
galaxies: evolution – galaxies: formation – galaxies: ISM – galaxies: photometry – galaxies: starburst – galaxies: stellar content1 Introduction
I Zw 18 remains the most metal-poor blue compact dwarf (BCD) galaxy known since its discovery by Sargent & Searle (1970). Later spectroscopic observations by Searle & Sargent (1972), Lequeux et al. (1979), French (1980), Kinman & Davidson (1981), Pagel et al. (1992), Skillman & Kennicutt (1993), Martin (1996), Izotov, Thuan & Lipovetsky (1997c), Izotov & Thuan (1998), Vílchez & Iglesias-Páramo (1998), Izotov & Thuan (1999) and Izotov et al. (1999) have confirmed its low metallicity with an oxygen abundance of only 1/50 the solar value.
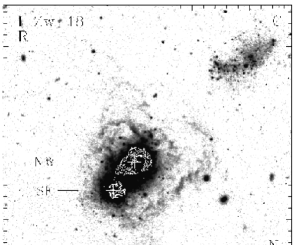
Zwicky (1966) described I Zw 18 as a double system of compact galaxies, which are in fact two bright knots of star formation with an angular separation of 58. These two star-forming regions are referred to as the brighter northwest (NW) and fainter southeast (SE) components (Fig. 1) and form what we will refer to as the main body. Later studies by Davidson, Kinman & Friedman (1989) and Dufour & Hester (1990) have revealed a more complex optical morphology. The most prominent diffuse feature, hereafter component C (Fig. 1), is a blue irregular star-forming region 22″ northwest of the NW component. Dufour, Esteban & Castañeda (1996a), van Zee et al. (1998) and Izotov & Thuan (1998) have shown the C component to have a systemic radial velocity equal to that of the ionized gas in the NW and SE components, thus establishing its physical association to I Zw 18. Furthermore, van Zee et al. (1998) have shown that this component is embedded in a common H I envelope with the main body.
Searle & Sargent (1972) and Hunter & Thronson (1995) have suggested that I Zw 18 may be a young galaxy, recently undergoing its first burst of star formation. The latter authors concluded from HST images that the colours of the diffuse unresolved component surrounding the SE and NW regions are consistent with a population of B and early A stars, i.e. with no evidence for older stars.
Ongoing star formation in the main body of I Zw 18 is implied by the discovery of a population of Wolf-Rayet stars in the NW component (Izotov et al. 1997a; Legrand et al. 1997; de Mello et al. 1998). Flux-calibrated optical spectra of the C component (Izotov & Thuan 1998; van Zee et al. 1998) reveal a blue continuum with weak Balmer absorption features and faint H and H in emission. Such spectral features imply that the H II region is ionized by a population of early B stars and suggest that the C component is older than the main body of I Zw 18. Izotov & Thuan (1998) have suggested an age sequence from the C component ( 200 Myr ) to the SE region ( 5 Myr ) of active star formation.
Dufour et al. (1996b) have discussed new HST imagery of I Zw 18, including the C component, which is resolved into stars. Based on the analyses of colour-magnitude diagrams, they concluded that star formation in the main body began at least 30 – 50 Myr ago and is maintained to the present, as is apparent in the SE component. Martin (1996) and Dufour et al. (1996b) have discussed the properties of expanding superbubbles of ionized gas driven by supernova explosions and have inferred dynamical ages of respectively 15 – 27 Myr and 13 – 15 Myr. As for the age of the C component, Dufour et al. (1996b) found in a vs. colour-magnitude analysis a well defined upper stellar main sequence indicating an age of the blue stars of 40 Myr. However, numerous faint red stars were also present in the colour-magnitude diagram implying an age of 100 – 300 Myr. Dufour et al. (1996b) therefore concluded that the C component consists of an older stellar population with an age of several hundred Myr, but which has experienced recently a modest starburst in its southeastern half as evidenced by the presence of blue stars and H emission.
Recently, Aloisi, Tosi & Greggio (1999) have discussed the star formation history in I Zw 18 using the same HST WFPC2 archival data ( i.e. those by Hunter & Thronson (1995) and Dufour et al. (1996b)). They compared observed colour-magnitude diagrams and luminosity functions with synthetic ones and concluded that there were two episodes of star formation in the main body, a first episode occuring over the last 0.5 – 1 Gyr, an age more than 10 times larger than that derived by Dufour et al. (1996b), and a second episode with more intense activity taking place between 15 and 20 Myr ago. No star formation has occurred within the last 15 Myr. For the C component, Aloisi et al. (1999) estimated an age not exceeding 0.2 Gyr.
Garnett et al. (1997) have presented measurements of the gas-phase C/O abundance ratio in both NW and SE components, based on ultraviolet spectroscopy with the Faint Object Spectrograph (FOS) onboard HST. They determined values of log C/O = –0.63 0.10 for the NW component and log C/O = –0.56 0.09 for the SE component. These ratios, being significantly higher than in other metal-poor irregular galaxies, apparently require that carbon in I Zw 18 has been enriched by an older generation of stars. Garnett et al. (1997) concluded that I Zw 18 must have undergone an episode of star formation several hundred million years ago.
Using the same HST ultraviolet spectra, Izotov & Thuan (1999) have rederived the C/O abundance ratio in both NW and SE components of I Zw 18. They obtained lower values of log C/O equal to –0.77 0.10 for the NW component and –0.74 0.09 for the SE component. With these lower C/O ratios, I Zw 18 does not stand apart anymore from other low-metallicity BCDs. Furthermore, the C/O ratios are in excellent agreement with those predicted by massive star nucleosynthesis theory. Therefore, no preceding low-mass carbon-producing stellar population needs to be invoked, thus, supporting the original idea that I Zw 18 is a young galaxy undergoing its first episode of star formation (Searle & Sargent 1972). The main source of the differences ( 0.2 dex) with the values derived by Garnett et al. (1997) comes from the adopted electron temperatures. Izotov & Thuan (1999) use higher electron temperatures (by 1900 K and 2300 K respectively for the NW and SE components) as derived from recent MMT spectral observations in apertures which match more closely those of the HST FOS observations used to obtain carbon abundances.
Thus, despite the extensive multiwavelength studies of I Zw 18, its evolutionary status remains controversial. Increasing evidence is accumulating, however, in favor of the idea that this BCD underwent its first episode of star formation less than 100 Myr ago. The first line of evidence is based on heavy element abundance ratios. Izotov & Thuan (1999) have studied these ratios in a sample of low-metallicity BCDs. They found that all galaxies with heavy element mass fraction /20, including I Zw 18, show constant C/O and N/O abundance ratios which can be explained by element production in massive stars ( 9 ) only. Intermediate-mass stars ( 3 9 ) in these galaxies have not had time to die and release their C and N production. Izotov & Thuan (1999) put an upper limit to the age of the order of 100 Myr for these most metal-deficient galaxies. The chemical evidence for a young age of galaxies with /20 is supported by photometric and spectroscopic evidence. Thuan, Izotov & Lipovetsky (1997) and Papaderos et al. (1998) have argued, on the basis of colour profiles and spectral synthesis studies, that the second most metal-deficient galaxy known after I Zw 18, the BCD SBS 0335–052 with /40, is a young galaxy with age less than 100 Myr. Using the same techniques in addition to colour-magnitude diagram studies, Thuan, Izotov & Foltz (1999a) have shown that the age of the BCD SBS 1415+437 with /21 is also less than 100 Myr.
In view of the contradictory conclusions reached by different authors based on the same HST data set, we have decided to address anew the issue of the age of I Zw 18 by reexamining the HST data. We use the archival HST WFPC2 , and images to construct colour-magnitude diagrams for I Zw 18. We complement the imaging data with high signal - to - noise ratio Multiple Mirror Telescope (MMT) spectroscopic observations. These data are interpreted with the help of spectral energy distributions (SEDs). Spectroscopic observations are crucial for this type of analysis as they allow to correct SEDs for contamination by emission from ionized gas.
In Sect. 2 we discuss the photometric and spectroscopic data. A determination of the distance to I Zw 18 and constraints on its age from vs. and vs. colour-magnitude diagrams are given in Sect. 3. In Sect. 4 age constraints inferred from the spectral energy distributions are discussed. Hydrodynamical age constraints from observations of large expanding shells of ionized gas are considered in Sect. 5. We summarize our results in Sect. 6.
| Parameter | Main bodya | C componenta | Ref. |
|---|---|---|---|
| RA(J2000) | 09h34m02.10s | 09h33m59.68s | 1 |
| DEC(J2000) | +55∘14′238 | +55∘14′423 | 1 |
| (mag) | 16.03 | 19.06 | 1 |
| (mag) | –0.96 | — | 1,2,3 |
| (mag) | –0.21 | –0.08 | 1 |
| (mag) | 0.24 | 0.15 | 1 |
| (mag) | –0.12 | — | 1,2,3 |
References: 1 – Dufour et al. (1996b); 2 – Hunter & Thronson (1995); 3 – this paper.
aMagnitudes and colours are corrected for interstellar extinction ( = 0.25 mag, = 0.07 mag, = 0.04 mag, Dufour et al. 1996b). magnitudes are taken from Dufour et al. (1996b), magnitudes are measured in this paper within the circular aperture with radius = 10″ using HST observations by Hunter & Thronson (1995).
2 Observational data
2.1 Photometric data
| Filter | WFPC2 quadrant | PI | Epoch | Exposure time | Image root name |
|---|---|---|---|---|---|
| (sec) | |||||
| F336W | PC | Hunter | 29 Oct 1994 | 4200 | u2cg0101t, u2cg0102t, u2cg0103t |
| F450W | WF3 | Dufour | 03 Nov 1994 | 4600 | u2f90102t, u2f90103t |
| F555W | WF3 | Dufour | 03 Nov 1994 | 4600 | u2f90104t, u2f90105t |
| F702W | WF3 | Dufour | 03 Nov 1994 | 5400 | u2f90101t, u2f90201t, u2f90202t |
| F814W | PC | Hunter | 30 Oct 1994 | 6600 | u2cg0301t, u2cg0302t, u2cg0303t |
Our main goal here is to study the evolutionary status of I Zw 18, the integrated photometric properties of which are shown in Table 1, as a whole (i.e. including both the main body and the C component) by means of colour-magnitude diagrams (CMD). To construct the CMDs, we use archival deep (F450W), (F555W) and (F702W) HST observations ( PI: Dufour, GO-5434, November 1994) where both the main body and the C component were imaged with the WFPC2 camera. Additionally, for the measurement of the total magnitudes (Table 1), we use (F336W) and (F814W) PC1 images of the main body (PI: Hunter, GO-5309, November 1994). and observations of the C component have not yet been done by HST. Images reduced by the standard pipeline at the STScI were retrieved from the HST archives. They are listed in Table 2.
The next steps of data reduction included combining all observations with the same filter, removal of cosmic rays using the IRAF333IRAF: the Image Reduction and Analysis Facility is distributed by the National Optical Astronomy Observatories, which is operated by the Association of Universities for Research in Astronomy, In. (AURA) under cooperative agreement with the National Science Foundation (NSF). routine CRREJ, and correction for geometric distortion by producing mosaic images. The latter procedure introduces small photometric corrections of 0.02 mag for objects near the edge of CCD chip (Holtzman et al. 1995a), like the C component, and are even smaller for objects located far from the edge, like the main body.
Figure 1 shows the HST WFPC2 image of I Zw 18 in the band. A filamentary low surface brightness (LSB) emission pattern extending far away from the main body of I Zw 18 can be seen. A number of distinct super-shells are visible within this LSB envelope of the main body, testimony to a large scale perturbation of the surrounding gaseous component and suggesting that emission by ionized gas contributes a significant fraction of the integrated luminosity of the system. This is obviously not the case for the C component in which weak H emission is barely seen and is localized in a compact region (Dufour et al. 1996b).
To construct the CMDs, we use the DAOPHOT package in IRAF. The point-spread function in each broad-band filter is obtained with the PSF routine in an interactive mode, by examining and extracting 5 – 10 stars in relatively uncrowded fields. The photometry of point sources is done with a 2-pixel radius circular aperture. Instrumental magnitudes are then converted to magnitudes within an aperture of radius 05, adopting corrections of –0.19 mag in and and –0.21 mag in (Holtzman et al. 1995a). They are finally transformed to magnitudes in the standard Johnson-Cousins photometric system using the prescriptions of Holtzman et al. (1995b).
2.2 Spectroscopic data
Spectroscopic observations of I Zw 18 were carried out with the MMT on the nights of 1997 April 29 and 30. Signal-to-noise ratios S/N 50 were reached in the continuum of the bright central part. Observations were made in the blue channel of the MMT spectrograph using a highly optimized Loral 3072 1024 CCD detector. A 15 180″ slit was used along with a 300 groove mm-1 grating in first order and an L-38 second-order blocking filter. This yields a spatial resolution along the slit of 03 pixel-1, a scale perpendicular to the slit of 1.9 Å pixel-1, a spectral range 3600 – 7500 Å, and a spectral resolution of 7 Å ( FWHM ). For these observations, CCD rows were binned by a factor of 2, yielding a final spatial sampling of 06 pixel-1. The total exposure time was 180 minutes broken up in six subexposures, 30 minutes each, to allow for a more effective cosmic-ray removal. All exposures were taken at small airmasses ( 1.1 – 1.2 ), so no correction was made for atmospheric dispersion. The seeing during the observations was 07 FWHM. The slit was oriented in the position angle P.A. = –41∘ to permit observations of the NW and SE components and the SE tip of the C component simultaneously. The spectrophotometric standard star HZ 44 was observed for flux calibration. Spectra of He-Ne-Ar comparison lamps were obtained before and after each observation to provide wavelength calibration.
Data reduction of spectral observations was carried out at the NOAO headquarters in Tucson using the IRAF software package. This included bias subtraction, cosmic-ray removal and flat-field correction using exposures of a quartz incandescent lamp. After wavelength mapping, night-sky background subtraction, and correcting for atmospheric extinction, each frame was calibrated to absolute fluxes. One-dimensional spectra were extracted by summing, without weighting, different numbers of rows along the slit depending on the exact region of interest. We have extracted spectra of two regions: (1) the brightest part of the main body with size 15 85 centered on the NW component and (2) the southeastern tip of the C component within an aperture 15 3″. The observed and extinction-corrected emission-line intensities in the main body of I Zw 18 are listed in Table 3.
The ionic and elemental abundances have been derived following the procedure by Izotov et al. (1994, 1997c). The extinction coefficient (H) and the absorption equivalent width (abs) for the hydrogen lines obtained by an iterative procedure are included in Table 3 together with the observed flux and the equivalent width of the H emission line. The electron temperature (O III) was determined from the [O III] 4363/ (4959 + 5007) flux ratio and the electron number density (S II) from the [S II] 6717/6731 flux ratio. The ionic and elemental abundances are shown in Table 4 together with ionization correction factors (ICFs). They are in good agreement with the abundances derived by Skillman & Kennicutt (1993), Izotov & Thuan (1998), Vílchez & Iglesias-Páramo (1998) and Izotov et al. (1999).
| Ion | ()/(H) | ()/(H) |
|---|---|---|
| 3727 [O II] | 0.34730.0035 | 0.35470.0038 |
| 3835 H9 | 0.01950.0021 | 0.09710.0141 |
| 3868 [Ne III] | 0.15190.0028 | 0.15370.0029 |
| 3889 He I + H8 | 0.11910.0026 | 0.19560.0052 |
| 3968 [Ne III] + H7 | 0.14460.0026 | 0.21700.0048 |
| 4101 H | 0.20720.0027 | 0.27200.0042 |
| 4340 H | 0.42040.0034 | 0.47010.0043 |
| 4363 [O III] | 0.06390.0022 | 0.06280.0022 |
| 4471 He I | 0.02630.0019 | 0.02570.0019 |
| 4686 He II | 0.02490.0019 | 0.02400.0019 |
| 4861 H | 1.00000.0053 | 1.00000.0056 |
| 4959 [O III] | 0.69270.0042 | 0.66050.0042 |
| 5007 [O III] | 2.08350.0092 | 1.98220.0092 |
| 5876 He I | 0.08380.0017 | 0.07680.0017 |
| 6300 [O I] | 0.00900.0014 | 0.00810.0013 |
| 6312 [S III] | 0.00910.0012 | 0.00820.0011 |
| 6563 H | 3.04880.0126 | 2.74500.0129 |
| 6678 He I | 0.02910.0012 | 0.02590.0012 |
| 6717 [S II] | 0.03340.0014 | 0.02970.0013 |
| 6731 [S II] | 0.02160.0014 | 0.01920.0013 |
| 7065 He I | 0.02510.0011 | 0.02210.0011 |
| 7135 [Ar III] | 0.01950.0011 | 0.01720.0011 |
| (H) dex | 0.0900.005 | |
| (H)a | 3.500.02 | |
| (H) Å | 685 | |
| (abs) Å | 3.00.1 | |
ain units of 10-14 ergs s-1cm-2.
| Parameter | Value |
|---|---|
| (O III)(K) | 19300400 |
| (O II)(K) | 15500300 |
| (S III)(K) | 17700300 |
| (S II)(cm-3) | 1010 |
| O+/H+(105) | 0.2800.014 |
| O++/H+(105) | 1.2210.058 |
| O+3/H+(105) | 0.0420.004 |
| O/H(105) | 1.5440.060 |
| 12 + log(O/H) | 7.1890.017 |
| Ne++/H+(105) | 0.1940.010 |
| ICF(Ne) | 1.26 |
| log(Ne/O) | –0.7990.033 |
| S+/H+(107) | 0.4570.022 |
| S++/H+(107) | 2.6190.377 |
| ICF(S) | 1.67 |
| log(S/O) | –1.4780.045 |
| Ar++/H+(107) | 0.4730.030 |
| ICF(Ar) | 2.00 |
| log(Ar/O) | –2.2130.026 |
3 Stellar population ages from colour-magnitude diagrams
The superior spatial resolution of HST WFPC2 images combined with the proximity of I Zw 18 permits to resolve individual bright stars and study stellar populations in this galaxy by means of colour - magnitude diagrams. Such a study has been done by Hunter & Thronson (1995) for the main body in the , and bands. Their photometry shows a broad main sequence of massive stars and blue and red supergiants. The NW component contains the brightest and reddest, presumably most evolved stars, spanning a range 2 – 5 Myr in age. The stars in the SE component are likely to be even younger.
Dufour et al. (1996b) were able to resolve the C component into stars and found it to be older than the NW and SE components. On the basis of vs. colour-magnitude diagrams, they concluded that star formation started in the main body several tens of Myr ago and in the C component several hundred of Myr ago. In this section we re-analyze the observations by Dufour et al. (1996b) and re-examine their conclusions concerning the age of the stellar content of I Zw 18. In order to compare observed to theoretical CMDs and derive ages, a precise distance to I Zw 18 is needed, which we discuss next.
3.1 The distance to I Zw 18
For the nearest galaxies, distances can be derived from colour-magnitude diagrams themselves by measuring the apparent magnitude of the tip of the red giant branch clump (e.g. Schulte-Ladbeck, Crone & Hopp 1998; Lynds et al. 1998). However, red giants are too faint to be seen in more distant galaxies (such as I Zw 18), and other methods must be used. Any such distance determination should always be checked for consistency, i.e. galaxy properties derived from CMD analysis such as the age of the stellar populations or the luminosities of the brightest stars should be compatible with other known observed characteristics of the galaxy.
A distance of 10 Mpc to I Zw 18 has generally been adopted by previous authors (Hunter & Thronson 1995, Dufour et al. 1996b and Aloisi et al. 1999). This assumes that the observed heliocentric radial velocity of the galaxy 740 km s-1 is pure Hubble flow velocity and a Hubble constant = 75 km s-1 Mpc-1. Adopting this distance would lead to a conflict with the well-observed ionization state of I Zw 18. At 10 Mpc the brightest stars observed in the main body and in the C component have absolute magnitudes fainter than –8 and –6 mag respectively (Hunter & Thronson 1995; Dufour et al. 1996b; Aloisi et al. 1999). If that is the case, comparison with evolutionary tracks implies that the most massive stars in the main body and C component would have masses less than 15 and 9 respectively (Dufour et al. 1996b; Aloisi et al. 1999). According to Vacca (1994), O stars have masses exceeding 13 . Thus, only very late O stars would be present in the main body. This conclusion is in severe contradiction with the observed ionization state of I Zw 18. Indeed, the equivalent width of the H emission line expected from a stellar population having an upper mass limit of 15 is 10 Å, while the observed H equivalent widths in the NW and SE components lie in the range 60 – 130 Å, implying the presence of stars with masses 40 – 50 . If the upper stellar mass limit of 9 derived by Dufour et al. (1996b) and Aloisi et al. (1999) for the C component is correct, then ionized gas should not be present in this component because of the lack of O and early B stars. But H and H are clearly observed (Dufour et al. 1996ab; Izotov & Thuan 1998; van Zee et al. 1998; this paper) in the C component. Izotov & Thuan (1998) derived (H) = 6 Å, which, after correction for underlying stellar absorption, would result in a value as high as 10 Å. Thus, late O and early B stars with masses as high as 15 must be postulated in the C component. We argue therefore that the stellar absolute magnitudes derived by Dufour et al. (1996b) and Aloisi et al. (1999) from their CMDs are too faint because they are based on too small an adopted distance.

The real distance to I Zw 18 appears to be considerably larger. Correction of the I Zw 18 heliocentric radial velocity to the centroid of the Local Group and for a Virgocentric infall motion of 300 km s-1 ( Kraan-Korteweg 1986 ) gives a velocity of 1114 km s-1. If the Hubble constant is in the currently accepted range of 55 – 70 km s-1 Mpc-1 this would give a distance between 16 and 20 Mpc for I Zw 18.
Because of uncertainties introduced by the statistical nature of the Virgocentric infall correction and those in the value of the Hubble constant, we prefer to base our estimate of the distance to I Zw 18 on two firm observational results: 1) the presence of ionized gas in the C component and 2) the presence of WR stars in the NW component. Concerning the ionized gas in the C component, the distance should be increased to a value of 20 Mpc. Increasing the distance by a factor of 2 would make the most massive stars more luminous by a factor of 4 and push the mass upper limit to 15 . These more massive stars would then provide enough ionizing photons to account for the observed emission lines in the C component. Concerning the WR stars, they have been seen both spectroscopically (Izotov et al. 1997a; Legrand et al. 1997) and photometrically (Hunter & Thronson 1995; de Mello et al. 1998) in the NW component of I Zw 18, in the region where the brightest post-main-sequence stars are located. The existence of WR stars implies the presence of very massive stars in the NW component. De Mello et al. (1998) using Geneva stellar evolutionary tracks for massive stars with enhanced stellar wind and with heavy element mass fraction = 0.0004 found the minimum initial mass for stars evolving to WR stars to be 90 and that the WR stage is very short-lived, being only 0.8 Myr, if the instantaneous burst model is adopted. The models used by de Mello et al. (1998) do not take rotation into account, which may decrease , but probably by not more than a factor of 1.5 (Langer & Heger 1998; Meynet 1998). Thus the observation of WR stars in the NW component implies that post-main-sequence massive stars with 40 – 60 and with lifetimes 3 – 5 Myr (Fagotto et al. 1994; Meynet et al. 1994) must be present in I Zw 18. This short time scale is in excellent agreement with the age of 5 Myr derived from the equivalent width of H in the main body (Table 3), using the calibration by Schaerer & Vacca (1998). To accomodate this small time scale, we are forced again to increase the distance of I Zw 18 to 20 Mpc. Increasing the distance would increase the luminosity of all stars and the location of the brightest stars in the CMD of the main body can be accounted for by isochrones with age as short as 5 Myr.
In summary, three different lines of argument — a non Hubble flow velocity component, the ionization state of I Zw 18 and the presence of WR stars in its NW component — have led us to conclude that I Zw 18 is twice as distant as thought before. We shall thus adopt a distance of 20 Mpc to I Zw 18. At this distance, 1″ = 97 pc.


3.2 The resolved component and colour-magnitude diagrams
In Fig. 2 we show the spatial distribution of the () colours of point sources along the main body for increasing photometric uncertainties . Panels (a) to (d) show CMD data points with successively larger photometric errors, but smaller than the value given in each panel. The origin is taken to be at the south-eastern tip of the main body. The boundaries of the SE and NW components are shown by vertical lines. In the most crowded fields of the SE and NW starburst components, and magnitudes are measured with a precision better than 0.15 mag only for very few stars (Fig. 2a). However, if the upper limits are greater than 0.25 mag, then almost all stars in these two components are recovered as suggested by the similarity of the distributions of stars in panels (c) and (d). Figure 3 shows the distribution of photometric errors as a function of apparent , and stellar magnitudes for the C component (Figs. 3a – 3c) and the main body (Figs. 3d – 3f). The photometric errors in the band at a fixed magnitude are similar to those derived by Hunter & Thronson (1995). In the main body, the errors remain rather large even for the brightest stars ( 0.2 mag at 22 mag ). This is due to the spatially varying background in the highly crowded region of the main body. These photometric errors are especially large at the faint magnitudes of red evolved stars ( 0.4 mag at 28 mag ). By contrast, the photometric errors in all filters are lower for the sources in the C component, being 0.1 mag at 25 mag and increasing to 0.3 mag at 28 mag, because stellar crowding and contamination of the stellar background by the ionized gas emission are smaller.


In the following CMD analysis, we shall consider only point sources which are brighter than 27 mag in each band and those for which the photometric errors do not exceed 0.25 mag. For the C component, each of these two conditions selects out nearly the same point sources, as 27 mag sources have a mean error of 0.25 mag. However, in the main body, some bright sources are rejected because they have photometric errors larger than 0.25 mag (Fig. 3).
The correction for internal extinction poses a problem. The extinction for the main body can be estimated from the optical emission-line spectrum. However, different measurements give somewhat different values for the extinction. Dufour et al. (1996b) have adopted a value = 0.25 mag based on the spectroscopic observations of Skillman & Kennicutt (1993). The value of (H) = 0.09 derived in this paper (Table 3) for the main body translates into a mean = 0.19 mag. The extinction may differ in the NW and SE components and it is not possible to estimate it in the C component because Balmer hydrogen emission lines in its spectrum are not detected with high enough signal-to-noise ratio.
It is worth noting that recent studies reveal that dust formation may proceed very efficiently in a low-metallicity starburst environment and cause a highly inhomogeneous extinction pattern. Thuan, Sauvage & Madden (1999b) have analyzed ISO observations of the second most metal - deficient galaxy known, SBS 0335–052, and found that an intrinsic extinction of up to = 19 – 21 mag is required around some stellar complexes to account for the galaxy’s spectral energy distribution in the mid-infrared. The mean extinction in SBS 0335–052 derived from the optical spectroscopic observations is much lower ( 0.5 mag, Izotov et al. 1997b), although it varies significantly along the slit. Thuan et al. (1999b) found that as much as 3/4 of the massive stars in SBS 0335–052 may be hidden by dust.
Keeping in mind these findings, we adopt for simplicity and for lack of more information a spatially constant extinction of = 0.19 mag, = 0.06 mag and = 0.04 mag for the main body of I Zw 18 (Table 3), while the extinction for the C component is taken to be zero. An inhomogeneous and locally much higher extinction than the value adopted above will evidently result in a larger dispersion in the CMDs and in increased colour indices, i.e. in an overestimate of the age for I Zw 18.
We show the vs. diagram for the C component in Fig. 4a and that for the main body in Fig. 4b. Solid lines represent theoretical isochrones (Bertelli et al. 1994), for a heavy element mass fraction = 0.0004, labeled according to the logarithm of age. The largest stellar mass associated with each isochrone is also given in parentheses. It may be seen that there exists a well-defined main sequence in the C component with a turn-off indicative of an age of 15 Myr. There is a very bright point source with 22 mag, which may be in fact a compact star cluster as suggested by Dufour et al. (1996b). Although no red sources with () 1 are seen, there is a group of relatively redder points with 0.2 () 0.6 in Fig. 4a. Because of their faint magnitudes ( 26 ), some of the red sources may be attributed to photometric uncertainties ( 0.2 mag at and 26, resulting in () 0.3 mag, Fig. 3 ). The fact that there are also points that scatter to the blue at that faint magnitude would support that hypothesis. However, even if we do accept that all these faint red stars are real, comparison with theoretical isochrones says that their age cannot exceed 100 Myr.
As for the main body, the main sequence turn-off at 22 mag implies an age of 5 Myr ( Fig. 4b ). Red stars ( () 0.2 ) are seen to possess a large range of absolute magnitudes ( 3 – 4 mag ) implying that star formation has been undergoing in the main body in the last 15 – 30 Myr. This conclusion is essentially the same as that by Dufour et al. (1996b) except for differences introduced by the larger distance to I Zw 18 which results in smaller ages. We note that the spread of the points in the vs. diagram of the main body (Fig. 4b) is larger than the one in the CMD of the C component. It is probably not only due to evolutionary effects, but also to larger photometric uncertainties in the main body because of more crowding and contamination from gaseous emission as discussed above (cf. Fig. 3).
vs. CMD diagrams for the C component and the main body along with theoretical isochrones from Bertelli et al. (1994) for = 0.0004 (solid lines) are shown in Fig. 5. As in Fig. 4, the logarithm of age and the maximum stellar mass are given for each isochrone.
Figure 5a shows a well-defined main-sequence for component C corresponding to an age of 15 Myr. Several red and faint ( 25 mag) stars with 1.1 mag are seen. They probably are red supergiants and/or massive young luminous asymptotic giant branch (AGB) stars, 2 mag brighter than the older AGB stars observed in the BCD VII Zw 403 (Lynds et al. 1998; Schulte-Ladbeck et al. 1998) and Local Group galaxies ( e.g. Gallart, Aparicio & Vílchez 1996 ). The location of these red stars in the CMD suggests an age of 100 Myr. We conclude that star formation in the C component probably began 100 Myr ago and finished 15 Myr ago.
The spread of points in the main body ( Fig. 5b ) is similar to that in the vs. CMD (Fig. 4). Again, red stars in the main body span a range by 3 – 4 magnitudes in brightness suggesting that star formation has occurred during the last 15 – 30 Myr. The age of 5 Myr derived for the brightest stars in the main body is in agreement with that inferred from spectral observations ( see Sect. 4 ).
Our derived upper age limit of 100 Myr for I Zw 18 differs by a whole order of magnitude from the age of up to 1 Gyr derived by Aloisi et al. (1999) in their CMD analysis of the archival , , HST data. This large age difference comes mostly from the doubling of the distance to I Zw 18. Aloisi et al. (1999) found an appreciable number of faint red sources with = 26 – 27 mag and () = 1 – 2 mag. With our new distance of 20 Mpc, these sources have absolute magnitude of –6.5 mag, or 2 mag brighter than the absolute magnitude of older and fainter AGB stars detected in the BCD VII Zw 403 (Lynds et al. 1998; Schulte-Ladbeck et al. 1998). Because of their high luminosities, these red stars cannot be interpreted as old AGB stars as proposed by Aloisi et al. (1999). Rather, it is more likely that they are young stars. At the new distance, the location in the () vs. diagram of the faint red stars seen by Aloisi et al. (1999) is consistent with an age of 50 Myr if the Geneva tracks are used, and of 100 Myr if the Padova tracks are used. These red stars with = 25 – 26 mag and () 0.6 are also seen by us in the () vs CMD (Fig. 5b) and their age is again consistent with 50 Myr as inferred from the Padova isochrones. Aloisi et al. (1999) restricted their CMDs to points with photometric errors smaller than = 0.2 mag. With such a cut, those authors found that the faint red stars are located mainly in the southeastern part of the main body. Adopting the same cut, we come to the same conclusion as can be seen in Figure 2b, where these stars are shown by open circles. They are seen to be located mainly in the relatively uncrowded region between the SE and NW components. However, if a slightly larger cut of = 0.25 mag is used instead, the distribution of faint red stars in the main body becomes more uniform (Figure 2c). The ages of the faint red stars of 100 Myr derived here, should be considered as upper limits. If these sources are subject to local high extinction, their ages will be decreased.

In summary, the upper ages derived for point sources from colour-magnitude diagrams in both the main body and C component of I Zw 18 do not exceed 100 Myr.
Figure 6 shows the radial colour distribution of point sources along the body of the C component with the origin taken to be at the southeastern tip. While the () colour does not show a gradient (Fig. 6a), there is a weak trend for the colour of stars to become redder away from the southeastern tip towards the northwestern tip of the C component. This trend was also discussed by Dufour et al. (1996b) and may reflect propagating star formation in the C component from the NW to the SE.
The dots in Fig. 6 show the colours of the unresolved stellar continuum of the C component down to a surface brightness limit of 25 mag arcsec-2, averaged within regions of size 04 04. The mean colours of the diffuse component were determined to be = +0.05 mag and = +0.16 mag with a standard deviation of 0.01 mag around the mean.
A colour gradient in the diffuse stellar continuum is more evident in () than in (), amounting to (0.150.03) mag kpc-1 and (0.050.025) mag kpc-1, respectively. The diffuse stellar continuum distribution follows very closely that of the resolved point sources, although a small difference in the colour of the resolved and unresolved components exists in the southeastern part. These results imply that, contrary to the majority of BCDs (e.g. Papaderos et al. 1996a), in which star-forming regions are immersed in an extended and much older stellar LSB envelope, the blue unresolved stellar continuum in the C component is of comparable age or even formed coevally with the population of resolved sources discussed in this section. The integrated photometric properties of the unresolved components in both the main body and C component are listed in Table 5. They are derived from the total luminosity of each component after the summed up emission of point-like sources has been subtracted. Quantities listed in Table 5 referring to the main body of I Zw 18 are corrected for intrinsic extinction.
Note that while the emission of the resolved component in the main body of I Zw 18 is contributed by stellar sources, the unresolved emission includes both stellar and gaseous contributions. It follows from Table 5 that most of the light comes from the unresolved stellar component. The contribution of resolved sources to the total light of both the main body and C component is %.
| Parameter | Main bodya | C componentb |
|---|---|---|
| a) Total | ||
| (mag) | 16.05 | 19.20 |
| (mag) | –0.18 | 0.00 |
| (mag) | 0.20 | 0.14 |
| b) Resolved population | ||
| (mag) | 18.35 | 20.69 |
| (mag) | –0.41 | –0.03 |
| (mag) | 0.13 | 0.11 |
| c) Unresolved population | ||
| (mag) | 16.16 | 19.46 |
| (mag) | –0.16 | 0.01 |
| (mag) | 0.21 | 0.16 |
a Corrected for extinction as derived from spectroscopic
observations ( = 0.19 mag, = 0.06 mag, = 0.04 mag).
The measurements have been done within a circular aperture of
10″ in radius.
b Not corrected for extinction.
4 Synthetic spectral energy distribution
As discussed before, the stellar emission in the main body of I Zw 18 is strongly contaminated by emission of ionized gas from supergiant H II regions. Therefore, to derive the BCD’s stellar populations age, synthetic spectral energy distributions which include both stellar and ionized gaseous emission need to be constructed. By contrast, the contamination of the light of the C component by gaseous emission is small, and photometric and spectral data give us direct information on its stellar populations.
To analyze the stellar populations in the young ionizing clusters of the main body, we use SEDs calculated by Schaerer (1998, private communication) for a heavy element mass fraction of = /20 (SEDs with lower metallicity are not available) and ages in the range of = 2 – 10 Myr. As for the C component, the absence of strong ionized gas emission implies that its stellar population is older than 10 Myr. We have therefore calculated a grid of SEDs for stellar populations with ages between 4 Myr and 20 Gyr and heavy element abundances = 10-2, using the stellar isochrones of Bertelli et al. (1994) and the compilation of stellar atmosphere models of Lejeune, Cuisinier & Buser (1998). An initial mass function (IMF) with a Salpeter slope equal to –2.35, an upper mass limit of 100 and a lower mass limit of 0.6 are adopted. The observed gaseous spectral energy distribution is then added to the calculated stellar spectral energy distribution, its contribution being determined by the ratio of the observed equivalent width of the H emission line to the one expected for pure gaseous emission. To calculate the gaseous continuum spectral energy distribution, the observed H flux and the electron temperature have been derived from the spectrum at each point along the slit. The contribution of bound-free, free-free and two-photon continuum emission has been taken into account for the spectral range from 0 to 5 m (Aller 1984; Ferland 1980). Emission lines are superposed on top of the gaseous continuum SED with intensities derived from spectra in the spectral range 3700 – 7500 Å. Outside this range, the intensities of emission lines (mainly hydrogen lines) have been calculated from the extinction-corrected intensity of H.
4.1 The main body
Fig. 7 shows the observed spectrum of the main body ( NW + SE components ) along with the synthesized gaseous and stellar continuum for a composite stellar population of ages 2 and 5 Myr contributing respectively 40 % and 60 % of the total mass, in the approximation of an instantaneous burst of star formation. The line intensities, electron temperature, electron number density and heavy element abundances are taken from Tables 3 and 4. Comparison with synthesized SEDs of different ages shows that there is good agreement with the observed SED only for an age of 5 Myr. However, the synthesized SED is systematically below the observed SED in the blue part of the spectrum with 4000 Å. Hence, an additional younger stellar population with age 2 Myr is required. We conclude that the emission of the main body is dominated by a very young stellar population with age of 5 Myr. This age is considerably shorter than the one of 15 – 20 Myr derived by Aloisi et al. (1999) for their postulated second burst of star formation, and much shorter still than the 30 Myr – 1 Gyr time scale for the first episode of star formation.
The contribution of ionized gas to the SED of star-forming regions in the main body is not as large in I Zw 18 as in SBS 0335–052 (Papaderos et al. 1998), as can be seen by the equivalent width of H and the observed intensities of other emission lines relative to H. In the brightest part of the main body, the equivalent width of the H emission line is only 68 Å (Table 4) as compared to 200 Å in SBS 0335–052.

4.2 The C component

Fig. 8 shows the spectrum of the southeastern part of the C component. It is fitted very well by a single stellar population with age 15 Myr. This is in excellent agreement with the age derived earlier from the main-sequence turn-off in the CMD of the C component, supporting our large adopted distance of 20 Mpc to I Zw 18. To illustrate the sensitivity of synthesized SEDs to age determination, we have also shown in Fig. 8 the SED of a stellar population with age 40 Myr, the value adopted by Dufour et al. (1996b). The agreement is not so good, the synthesized fluxes being systematically smaller than the observed fluxes for 5000 Å.
We conclude that evolutionary synthesis models further constrain the age of the C component to the range 15 – 40 Myr.

4.3 A 10 Gyr old stellar population?
Although there is compelling evidence that the stellar emission in I Zw 18 ( in both the main body and the C component ) is due to stellar populations with age Myr, the presence of a very faint older stellar population with age Gyr cannot be definitely ruled out, since such a population would not be visible in CMDs with 27.5 mag and would cause a non-detectable effect in photometric and spectroscopic data.
Figure 9 shows composite SEDs resulting from a mixture of a young 15 Myr and an old 10 Gyr stellar population. Each SED is labeled by the mass fraction of the old stellar population. The SED with comparable masses of young and old stellar populations ( labeled as 0.5 ) is indistinguishable from that of a pure young stellar population ( labeled 0 ). However, SEDs of composite populations where the mass of the old stellar population is 10 times greater than the mass of the younger stellar component can be excluded as they are systematically redder than the observed spectrum for 5500 Å.
We cannot exclude therefore an underlying very old stellar population with mass comparable to that of the young stellar population in the C component. It must be however spatially coincident with the young stellar population because the colours are nearly constant. This is very unlikely as photometric studies of other BCDs (e.g. Papaderos et al. 1996ab) show redder colours towards the outer parts implying that the old stellar population is spatially distinct and more extended than the young stellar population.
In summary, there is no need for a stellar population older than Myr to account for photometric and spectrophotometric properties of I Zw 18. Deep near - infrared photometric observations are needed to put stronger constraints on a older stellar population.
5 Age constraints from the ionized gas shell structures
Many shell structures are seen in H images of I Zw 18 (Fig. 1), produced by the combined effect of stellar winds from massive stars and supernovae. Knowledge of the radii, the number of massive stars, the ambient density, the geometry of the gas distribution and the properties of stellar winds from low-metallicity massive stars and of supernovae allows, in principle, to estimate the age of the stellar populations responsible for these large-scale structures. However, this knowledge is still rather uncertain and stellar population age estimates from shell structures should be considered to be more qualitative than quantitative.
If the largest shells were produced by the evolution of the NW and SE components, then the shell structures would have radii 1200 pc. However, the centers of symmetry for the large shells are not coincident with the NW component. It is more likely that the large shells are produced by older stellar clusters as suggested by Dufour et al. (1996b), and in that case, the structures would have radii of 400 – 800 pc.
The radius of a superbubble produced by a population of stars with stellar winds and by supernovae is given, respectively, by (McCray & Kafatos 1987):
| (1) |
| (2) |
where is in pc, is the number of stars with stellar wind, = /(1038 ergs s-1), being the mechanical luminosity of a single stellar wind, = /(107yr), is the density of the ambient gas, is the number of supernovae, = /(1051 ergs), being the mechanical energy of a single supernovae.
Consider first the stellar wind mechanism. The mechanical energy of the stellar wind of a single star in our Galaxy is 1 (Abbott, Bieging & Churchwell 1981). Taking into account the decrease of wind efficiency with metallicity as (Maeder & Meynet 1994), we derive = 0.14 for I Zw 18’s metallicity ( note that Hunter & Thronson (1995) used three times as large a value ). Guseva, Izotov & Thuan (1999) derived a number of 66 WR stars in I Zw 18. This number should be considered as a lower value of stars with stellar winds, since massive O stars can also contribute. The number density of the ambient neutral gas can be estimated from H I column densities (van Zee et al. 1998). It varies from 1 cm-3 in the central part of the main body where the inner shell is observed, to 0.05 cm-3 at the distance of 1 kpc from the main body where the largest shells are seen. We adopt two limiting values = 0.1 and 1 cm-3, within the range of number densities discussed by Martin (1996). The WR stage in an instantaneous burst at /50 is short, 0.1 (de Mello et al. 1999). Then, the radius of the shell produced by stellar winds of WR stars is 110 pc, if = 1 cm-3 and 170 pc, if = 0.1 cm-3, in good agreement with the observed radius 100 pc of the inner shell. However, stellar winds alone cannot explain the presence of larger structures.
Consider next the combined effect of supernovae. In the NW component, the formation of structures with radii as large as 1200 pc should be accounted for. For simplicity, we assume the number of supernovae to be equal to the number of O stars. The latter can be estimated from the total observed flux of the H emission line. The H flux in Table 3 cannot be used as it has not been corrected for aperture effects. Instead, we adopt the aperture-corrected H flux from Guseva et al. (1999), giving a number of O stars equal to 4800. Adopting = 0.5 for the age of the main body, Eq. (2) gives = 550 pc and 350 pc for = 0.1 cm-3 and 1 cm-3 respectively.
To explain the presence of structures with radii as large as 1200 pc, the age for the NW component should be as high as 18 – 39 Myr, larger than the age of 5 Myr inferred from ionization constraints and the presence of WR stars. We conclude therefore that the stellar clusters in the NW and SE components ionizing the gas in the main body cannot be responsible for the largest structures, and these are due to the action of older clusters and stellar associations. The largest shell to the west of the NW component with radius 800 pc is likely to be connected with the stellar association located at 4″ to the NW of the NW component, near its center of symmetry. If we assume that a starburst occurred 10 Myr ago, that there were as many O stars as in the NW component and = 0.1 cm-3, then = 840 pc. Because of the weak dependence of on and ( Eq. 2 ) even a burst 10 times weaker with an age of 20 Myr can account for the radius of the largest shell. Hence, star formation in the main body of I Zw 18 is likely to have started 20 Myr ago, propagating generally from the NW to the SE direction, and continuing the star formation started earlier in the C component. This age estimate is in agreement with the one derived by Martin (1996) with the use of a more complex model of the gas distribution, and of the smaller distance of 10 Mpc.
6 Conclusions
Our main goal here is to use observed properties of the blue compact dwarf galaxy I Zw 18 to put constraints on its age: the high ionization state of the gas and the presence of WR stars in the main body, the existence of ionized gas in the C component, and the colour-magnitude diagrams from HST images. We were motivated by the study of Izotov & Thuan (1999) who have analyzed the C/O and N/O abundance ratios of a sample of the most metal-deficient BCDs known, including I Zw 18. Those authors found that these ratios are constant for galaxies with /20 with a very small dispersion around the mean. This strongly suggests that intermediate-mass stars ( 8 ) have not had time to release their carbon and primary nitrogen production, establishing an age upper limit of 100 Myr for very metal-deficient BCDs.
The conclusion that galaxies with / 20 are younger than 100 Myr has been supported by photometric and spectroscopic studies of two very metal-deficient BCDs, SBS 0335–052 ( /40, Thuan et al. 1997, Papaderos et al. 1998) and SBS 1415+437 ( Thuan et al. 1999a). Here we examine the age evidence for I Zw 18. To put constraints on the age of I Zw 18, we have followed 3 independent lines of investigation: colour-magnitude diagram, spectral synthesis and hydrodynamical age constraints. We have arrived at the following main conclusions:
1. The distance to I Zw 18 must be increased by a factor of 2 from the previously adopted value of 10 Mpc to 20 Mpc. Such a distance is required to have stars bright and massive enough in I Zw 18 to account for its high state of ionization and the presence of Wolf-Rayet stars in its NW component.
2. () vs. and () vs. CMD studies with the new distance of 20 Mpc give ages derived from the main sequence turn-off of I Zw 18 of 15 Myr and 5 Myr for the C component and main body respectively. The location of the resolved luminous red stars with –6 mag and () 0.6 – 1.0 mag is consistent with an age 100 Myr for the C component. The star formation in this component is likely to have stopped 15 – 20 Myr ago. As for the main body, CMD analysis implies that star formation started 20 – 50 Myr ago and still continues nowadays. Analysis of shell structures seen in H images also suggests that star formation in the main body began 20 Myr ago in different locations at the NW side and has been propagating mainly in the SE direction. The age upper limit of 50 Myr derived for the main body is a whole order of magnitude smaller that the one derived by Aloisi et al. (1999) from CMD analysis of similar HST data. The difference is mainly due to the increase in distance of I Zw 18 by a factor of 2.
3. Fits to the spectral energy distributions give ages of 5 Myr for the main body and 15 – 40 Myr for the C component.
In summary, all three lines of investigation ( CMDs, the distribution of H shells and spectroscopy ) lead to the same conclusion, that I Zw 18 did not start to form stars until 100 Myr ago. This supports the contention of Izotov & Thuan (1999) that all very metal-deficient galaxies ( /20 ) are young.
Acknowledgements.
Y.I.I. and N.G.G. thank the Universitäts–Sternwarte of Göttingen and Y.I.I. thanks the University of Virginia for warm hospitality. We are grateful to D. Schaerer for sending to us his stellar evolutionary synthesis models in electronic form and A. Aloisi for communicating her results. We acknowledge the financial support of Volkswagen Foundation Grant No. I/72919 (Y.I.I., N.G.G., P.P. and K.J.F.) and of National Science Foundation grants AST-9616863 ( T.X.T. and Y.I.I. ) and AST-9803072 ( C.B.F. ). Research by K.J.F. and P.P. has been supported by Deutsche Agentur für Raumfahrtangelegenheiten (DARA) GmbH grants 50 OR 9407 6 and 50 OR 9907 7.References
- (1)
- (2) Abbott D. C., Bieging J. H., Churchwell E. 1981, ApJ 250, 645
- (3)
- (4) Aller L. H. 1984, Physics of Thermal Gaseous Nebulae. Dordrecht: Reidel
- (5)
- (6) Aloisi A., Tosi M., Greggio L. 1999, AJ, in press
- (7)
- (8) Bertelli G., Bressan A., Chiosi C., Fagotto F., Nasi E. 1994, A&AS 106, 275
- (9)
- (10) Davidson K., Kinman T. D., Friedman S. D. 1989, AJ 97, 1591
- (11)
- (12) de Mello D. F., Schaerer D., Heldmann J., Leitherer C. 1998, ApJ 507, 199
- (13)
- (14) Dufour R. J., Esteban C., Castañeda H. O. 1996a, ApJ 471, L87
- (15)
- (16) Dufour R. J., Garnett D. R., Skillman E. D., Shields G. A. 1996b. In C. Leitherer, U. Fritze-v. Alvensleben, J. Huchra (eds.). From Stars To Galaxies. ASP Conference Series, vol. 98, p. 358
- (17)
- (18) Dufour R. J., Hester J. J. 1990, ApJ 350, 149
- (19)
- (20) Fagotto F., Bressan A., Bertelli G., Chiosi C. 1994, A&AS 104, 365
- (21)
- (22) Ferland G. J. 1980, PASP 92, 596
- (23)
- (24) French H. B. 1980, ApJ 240, 41
- (25)
- (26) Gallart C., Aparicio A., Vílchez J. M. 1996, AJ 112, 1928
- (27)
- (28) Garnett D. R., Skillman E. D., Dufour R. J., Shields G. A. 1997, ApJ 481, 174
- (29)
- (30) Guseva N. G., Izotov Y. I., Thuan T. X. 1999, ApJ, submitted
- (31)
- (32) Holtzman J. A., Burrows C. J., Casertano S., Hester J. J., Trauger J. T., Watson A. M., Worthey G. 1995b, PASP 107, 1065
- (33)
- (34) Holtzman J. A., Hester J. J., Casertano S., et al. 1995a, PASP 107, 165
- (35)
- (36) Hunter D. A., Thronson H. A., Jr. 1995, ApJ 452, 238
- (37)
- (38) Izotov Y. I., Chaffee F. H., Foltz C. B., Green R. F., Guseva N. G., Thuan T. X. 1999, ApJ, submitted
- (39)
- (40) Izotov Y. I., Foltz C. B., Green R. F., Guseva N. G., Thuan T. X. 1997a, ApJ 487, L37
- (41)
- (42) Izotov Y. I., Lipovetsky V. A., Chaffee F. H., Foltz C. B., Guseva N. G., Kniazev A. Y. 1997b, ApJ 476, 698
- (43)
- (44) Izotov Y. I., Thuan T. X. 1998, ApJ 497, 227
- (45)
- (46) Izotov Y. I., Thuan T. X. 1999, ApJ 511, 639
- (47)
- (48) Izotov Y. I., Thuan T. X., Lipovetsky V. A. 1994, ApJ 435, 647
- (49)
- (50) Izotov Y. I., Thuan T. X., Lipovetsky V. A. 1997c, ApJS 108, 1
- (51)
- (52) Kinman T. D., Davidson K. 1981, ApJ 243, 147
- (53)
- (54) Kraan-Korteweg R. C. 1986, A&AS 66, 255
- (55)
- (56) Langer N., Heger A. 1996. In I. D. Howarth (ed.). Boulder-Munich II: Properties of Hot, Luminous Stars. ASP Conference Series, vol. 131, p. 76
- (57)
- (58) Legrand F., Kunth D., Roy J.-R., Mas-Hesse J. M., Walsh J. R. 1997, A&A 326, L17
- (59)
- (60) Lejeune T., Cuisinier F., Buser R. 1998, A&AS 130, 65
- (61)
- (62) Lequeux J., Peimbert M., Rayo J. F., Serrano A., Torres-Peimbert S. 1979, A&A 80, 155
- (63)
- (64) Lynds R., Tolstoy E., O’Neil E. J., Jr., Hunter D. A. 1998, AJ 116, 146
- (65)
- (66) Martin C. L. 1996, ApJ 465, 680
- (67)
- (68) McCray R., Kafatos M. 1987, ApJ 317, 190
- (69)
- (70) Meynet G. 1996. In I. D. Howarth (ed.). Boulder-Munich II: Properties of Hot, Luminous Stars. ASP Conference Series, vol. 131, p. 96
- (71)
- (72) Meynet G., Maeder A., Schaller G., Schaerer D., Charbonnel C. 1994, A&AS 103, 97
- (73)
- (74) Pagel B. E. J., Simonson E. A., Terlevich R. J., Edmunds M. G. 1992, MNRAS 255, 325
- (75)
- (76) Papaderos P., Izotov Y. I., Fricke K. J., Thuan T. X., Guseva N. G. 1998, A&A 338, 43
- (77)
- (78) Papaderos, P., Loose, H.-H., Thuan, T. X., Fricke, K. J. 1996a, A&AS 120, 207
- (79)
- (80) Papaderos, P., Loose, H.-H., Fricke, K.J., Thuan, T. X. 1996b, A&A 314, 59
- (81)
- (82) Sargent W. L. W., Searle L. 1970, ApJ 162, 155
- (83)
- (84) Schaerer D., Vacca W. D. 1998, ApJ 497, 618
- (85)
- (86) Schulte-Ladbeck R. E., Crone M. M., Hopp U. 1998, ApJ 493, L23
- (87)
- (88) Searle L., Sargent W. L. W. 1972, ApJ 173, 25
- (89)
- (90) Skillman E. D., Kennicutt R. C., Jr. 1993, ApJ 411, 655
- (91)
- (92) Thuan T. X., Izotov Y. I., Foltz C. B. 1999a, ApJ, in press
- (93)
- (94) Thuan T. X., Izotov Y. I., Lipovetsky V. A. 1997, ApJ 477, 661
- (95)
- (96) Thuan T. X., Sauvage M., Madden S. 1999b, ApJ 516, 783
- (97)
- (98) Vacca W. D. 1994, ApJ 421, 140
- (99)
- (100) van Zee L., Westpfahl D., Haynes M. P., Salzer J. J. 1998, AJ 115, 1000
- (101)
- (102) Vílchez J. M., Iglesias-Páramo J. 1998, ApJ 508, 248
- (103)
- (104) Zwicky F. 1966, ApJ 143, 192
- (105)