Colour-Magnitude Relations and Spectral Line Strengths in the Coma Cluster
Abstract
We use the , , and spectral absorption line indices, together with U- and V-band photometry of 101 galaxies in the Coma cluster, to investigate how mean age and metal abundance correlate with galaxy luminosity. In particular, we use the line index measurements to address the origin of the colour–magnitude relation (CMR). We find that the CMR in Coma is driven primarily by a luminosity–metallicity correlation. We additionally show evidence for a relation between age and luminosity, in the direction predicted by the semi–analytic hierarchical clustering models of Kauffmann & Charlot [Kauffmann & Charlot 1998], but this is only present in the index models, and could be an effect of the lack of non solar abundance ratios in the Worthey models used.
By comparing deviations from the CMR, with deviations in absorption index from analogous ‘index–magnitude’ relations, we find that colour deviations bluewards of the mean relation are strongly correlated with the hydrogen Balmer line series absorption. We show that the properties of these blue galaxies are consistent with the presence of a young stellar population in the galaxies, rather than with a reduced metallicity.
keywords:
galaxies:abundances - galaxies:clusters:individual:Coma - galaxies:formation - galaxies:elliptical and lenticular - galaxies:starburst1 Introduction
It has been long understood that the colours of early-type galaxies are governed primarily by the effects of age and metallicity, which, when increased, cause the spectral energy distribution (SED) to become redder [Renzini & Buzzoni 1986, Buzzoni et al. 1992, Buzzoni et al. 1993, Worthey 1994, Charlot & Silk 1994]. In his ‘’ law (), Worthey [Worthey 1994] demonstrated how age and metallicity have a degenerate effect on galaxy colours. The colour–magnitude relation (CMR), in which the colours of early–type galaxies become progressively redder with increasing luminosity, and hence increasing mass of the galaxy [Visvanathan & Sandage 1977] is seen in the cores of rich clusters, in groups, and even seems to be present in field ellipticals [Larson et al. 1980]. Traditionally, the slope seen in the CMR has been attributed to a mass–metallicity sequence [Dressler 1984, Vader 1986], with the massive galaxies being more metal rich, and thus redder, than the less massive ones. This tendency can naturally be explained by a supernova–driven wind model [Larson 1974, Arimoto & Yoshii 1987], in which more massive galaxies can retain their supernova ejecta for longer than can smaller galaxies, thus being able to process a larger fraction of their gas before it is expelled from the galaxy. Given the degeneracy between the metallicity and age of a stellar population in its broad band colours, it is also possible that the CMR is an age driven sequence, with the smaller galaxies being bluer due to a younger mean age of their stellar populations. An age dependant CMR however neither preserves its slope, nor its magnitude range with time [Kodama 1997, Kodama & Arimoto 1997]. Studies of the CMR in high redshift clusters find a ridge-line slope comparable to that of the local clusters; furthermore, there is no sign of a change in the range of magnitude over which the CMR may be traced [Ellis et al. 1997, Stanford et al. 1998]. This makes an age dependant CMR in clusters highly unlikely. Given this metallicity driven interpretation of the CMR, its low levels of scatter in cluster cores implies that the galaxies are made up from uniformly old stellar populations [Bower et al. 1992, Bower et al. 1998]. Even small variations in the ages of the galaxies would lead to unacceptable levels of scatter in young stellar populations, whereas old stellar populations have a much smaller age dependency in their colours.
On closer inspection however, this picture runs into some problems. At high redshifts, the fraction of blue galaxies in many of the clusters increases [Butcher & Oemler 1978, Butcher & Oemler 1984]. Couch & Sharples [Couch & Sharples 1987] spectroscopically investigated the galaxies in some of these ‘Butcher–Oemler’ clusters. They split their sample into blue and red galaxies depending on whether they lie on the cluster CMR or not, and associate the increased fraction of blue galaxies with either ongoing or recent star formation. They also found that 11 out of their 73 red galaxies showed enhanced Balmer absorption lines, indicative of recent bursts of star formation, although it is possible that these red H strong galaxies can be formed by the truncation of star formation in spiral galaxies [Barbaro & Poggianti 1997].
Spectroscopic studies of early-type galaxies in local rich clusters (Caldwell et al. [Caldwell et al. 1993], hereafter C93; Caldwell et al. [Caldwell et al. 1996]) have shown that these low z clusters also contain a population of galaxies with abnormal spectra. They exhibit enhanced Balmer absorption lines, indicative of recent star formation, but with too weak an [O II] line to be classified simply as spiral galaxies. They note the similarity of some of these spectra with the ‘red’ H-strong galaxies of Couch & Sharples [Couch & Sharples 1987], and find that of the galaxies associated with the dynamically separate group of galaxies centered on NGC4839 in the SW of the Coma cluster [Baier 1984, Escalera et al. 1992, Colless & Dunn 1996], about have abnormal spectra.
These spectroscopic studies of local and distant clusters have shown there to be a population of galaxies which, although they appear photometrically old, have been forming significant quantities of stars in their recent past.
In an effort to disentangle age and metallicity effects on stellar populations, Worthey [Worthey 1994] (also Worthey & Ottaviani, 1997) developed a series of stellar population spectral synthesis models, to show the dependence on age and metallicity of spectral features such as the Balmer lines and various metal lines. In a study of a magnitude limited sample (M) of early-type galaxies in the Fornax cluster, Kuntschner & Davies [Kuntschner & Davies 1998] used these models to show that, as predicted by the high–z studies, the elliptical galaxies are indeed uniformly old, and span a range in metallicities. They also showed that the majority of the (luminosity weighted) young galaxies in the cluster were low luminosity lenticular systems. However, earlier studies of mainly field early-type galaxies [González 1993, Trager 1997] show just the opposite, with these galaxies seeming to have a uniform metallicity and a range of ages, yet still forming a well–defined CMR. This points to the possibility of an environmental dependence of the CMR, or maybe two completely different mechanisms operating in cluster and field environments, conspiring to produce similar CMRs.
In this paper we will look at spectral line indices and deviations from the CMR in the Coma cluster, using both the Worthey [Worthey 1994] and Worthey & Ottaviani [Worthey & Ottaviani 1997] spectro-photometric evolution models. We use the high precision photometry of the Coma cluster presented in Terlevich et al., [Terlevich et al. 1999] (hereafter T99, also Terlevich [Terlevich 1998]) and the spectra of Coma cluster galaxies from C93. The selection of galaxies and the spectroscopic and photometric measurements are outlined in §2. Our principle goal is to investigate whether the CMR in Coma is principally driven by age or metallicity and to determine the cause of deviations from the CMR in individual galaxies. Our analysis is presented in §3, followed by a summary of our conclusions in §4.
2 The Data
The overall aim of this paper requires us to combine accurate photometry with precise line-index measurements. The aperture photometry of T99 covers an area of the Coma cluster that is well matched to the spectroscopic survey of C93. As a result, we are able to compare the spectroscopic and broad-band colours of 101 galaxies drawn from within of the cluster center111An ASCII table of the galaxy colours and line indices is available on request via email from A. I. Terlevich.. Below we describe the selection of the spectroscopic catalogue, the spectroscopic determination of line strength indices, and the matching photometric measurements.
2.1 Sample selection
C93 selected their sample from the extensive galaxy catalogue of Godwin, Metcalfe & Peach [Godwin et al. 1983] (hereafter GMP). The parent catalogue is drawn from a 2.6 deg2 field, centered on the Coma cluster, and is considered complete to , corresponding to 222We take the recessional velocity of the Coma cluster to be [Colless & Dunn 1996], and assume , which gives a distance modulus of . . C93 used two criteria to select early-type galaxies from the GMP sample. Firstly they fitted the GMP 333C93 converted the GMP (b-r) colours to (B-V) colours using galaxies in common with the compilation of [Burstein et al. 1987] colour magnitude relation and selected all galaxies whose colours lay within mag of the fit. Secondly, they obtained independent morphologies using KPNO 4m and Palomar Sky Survey plates. Using these morphologies, and those of Dressler [Dressler 1980] they removed morphologically late-type systems from the list, and added some () morphologically early-type galaxies which had failed to be included after the colour cut. Finally they rejected all galaxies brighter than , as high velocity dispersion in these more massive galaxies would make their spectroscopic analysis of weak absorption lines impossible. We have further trimmed their sample of 137 galaxies by rejecting the ones which had the lowest S/N and the emission line galaxies, leaving us with a total of 101 galaxies.
Morphological type Number of galaxies No morphology 31 Spiral/Late-type 12 S0 47 E 11 All types 101
Table 1 shows the distribution of Andreon et al. [Andreon et al. 1996] and Andreon et al. [Andreon et al. 1997] morphological types for the C93 galaxies. Immediately obvious is the fact that 12 of the Caldwell early-type galaxies are in fact late-types according to Andreon et al. [Andreon et al. 1996]. Although only one of these turns out to lie more than two standard deviations blueward of the CMR ridge line (see Fig. 1 and §3.1). It must be noted, however, that up to date morphological information for many of the fainter galaxies in the sample is not available, and that this is where most of the blue galaxies reside. Nevertheless, only three out of the seven bluest galaxies have no determined morphologies.


2.2 Spectroscopy
The C93 spectra were all taken on the KPNO 4m, using the HYDRA multi-fibre positioner. They have a spectral resolution of Å (FWHM), and the fibre aperture was 2 arcsec diameter. In order to compare the spectra with Worthey stellar population models [Worthey 1994, Worthey & Ottaviani 1997], the spectra were re-sampled to the Lick/IDS resolution by convolution with a Gaussian of wavelength dependant width. Because the C93 data does not include any observations of stars in common with the Lick/IDS, the prescription used was that of Kuntschner [Kuntschner 1998] who used it to correct his Å (FWHM) resolution Fornax data to the Lick/IDS system. Both the Kuntschner [Kuntschner 1998] and the C93 spectra cover a similar wavelength range, and unlike the Lick/IDS spectra, whose spectral resolution degrades notably towards the blue (see Worthey & Ottaviani 1997, fig. 7) they have a constant spectral resolution over their entire wavelength range. The errors on the indices were estimated from the photon noise of the spectra, and do not take any systematic errors into account. The most likely source of systematic error is the re-sampling of the data onto the Lick/IDS system. Nevertheless, the possible systematic errors will have little effect on the relative comparisons made in this paper. We note that in addition, our Poisson error evaluation probably underestimates the true error because response variations from fibre to fibre will introduce extra scatter.
The final step necessary to place the line indices into the Lick/IDS system is to correct the galaxy spectra for velocity dispersion. Velocity dispersion corrections for individual line indices were taken from Kuntschner [Kuntschner 1998], who calculated them by artificially broadening stellar spectra (e.g. Davies, Sadler & Peletier [Davies et al. 1993]). The C93 spectra are not of sufficient resolution and S/N to measure accurate central velocity dispersions for our galaxies, so instead we construct a ‘Faber–Jackson’ relation [Faber & Jackson 1976] between our V band 8.8 arcsec diameter aperture magnitudes (see section 2.3), and the velocity dispersions () of Lucey et al. [Lucey et al. 1997]. A biweight fit (cf., §2.3) gives a relation of
| (1) |
(with bootstrap errors). We used this relation to find values of for those galaxies in the C93 sample which were not present in the Lucey et al. [Lucey et al. 1997] data.
We use the and Balmer line indices [Worthey & Ottaviani 1997] as the predominantly age sensitive spectral features. While is more sensitive to age, it is also more affected by nebular emission, which can rapidly fill the absorption feature [González 1993], so is not used. Higher order Balmer lines are less sensitive to emission from ionised gas [Osterbrock 1989], making an accurate measurement of the true stellar absorption easier. In order to increase the signal to noise, we have used in the final analysis. The feature is identified by Worthey (1994) as a particularly sensitive metallicity feature. However it is possible that it suffers from over abundance problems in the larger, higher metallicity systems [Kuntschner 1998]. Figure 2 shows the relation between and for the Coma galaxies, overplotted are the theoretical relation from Worthey (1994) models. Above a value of Å, the measured index values deviate from the region predicted by the models. A similar effect is seen by Kuntschner [Kuntschner 1998] for early-type galaxies in the Fornax cluster. However in our data, the index has poorer signal to noise than the index, so we will use both, noting the discrepancy for the high metallicity galaxies.
2.3 The photometry
It is important to get as good a match as possible between the photometric and spectroscopic apertures, so that both are measuring the same part of the galaxy. In the case, for instance, of localised bursts of star formation occurring in the galaxy nucleus, the large photometric aperture and the small spectroscopic one, could well both be measuring different mixes of stellar populations.
In order to match the 2 arcsec diameter of the HYDRA fibres used for the spectra as best as possible, we use the 8.8 arcsec diameter photometry from T99. The use of smaller metric apertures was not possible due to the increased effects of variations in seeing conditions during the observations. The T99 catalogue covers an area of to a depth of mag (ie., band magnitude within a diameter aperture) giving Johnson - and -band magnitudes for extended objects. The RMS internal scatter in the photometry is mag in , and mag in for mag.
Throughout this paper we use the biweight minimising technique, described in T99 (see also Beers, Flynn & Gebhardt [Beers et al. 1990]) to fit linear relations to the data. It was used for its resistance to outlying data points, and its robustness against non-Gaussian noise distributions. We derive the residuals of indices and colours from a mean index or colour - magnitude relation by the following equation:
| (2) |
where X is a line index (, or ), or () colour, and are the slope and intercept of the best fit relation (see table 2), and is the V magnitude.


3 Implications for star formation histories and the origin of the CMR
3.1 The colour magnitude relation
Given the selection criterion of C93, we should expect the CMR to be prominent in our data-set. As can be seen in Figure 1, the bi-weight scatter is indeed small: mag. Somewhat more surprising is the significant number of galaxies deviating blueward of the mean relation towards the faint end. The effect is not seen in the relation of C93 (see figure 1 in C93), presumably due to the lower sensitivity of colour to age, combined with their larger photometric errors. In order to trace the position of these relatively faint and blue galaxies in the subsequent figures, we adopt a common labelling convention throughout the paper. The symbols reflect the morphologies taken from Andreon et al. [Andreon et al. 1996] and Andreon et al. [Andreon et al. 1997], as defined by the key in figure 1. The number or rings plotted around each symbol indicates its deviation from the best fit CMR. Points without rings lie either red-ward of the colour-magnitude relation, or are within of it. Points with only one ring lie between and blueward of the relation, and points with two rings lie more than blueward of the relation. Unless otherwise stated, when we refer to ‘blue’ galaxies we are referring to the objects plotted with at least one ring, and ‘red’ galaxies are the objects plotted with no rings.
3.2 Line Index Diagrams
We have used the , and indices to place the galaxies on Worthey’s age/metallicity diagnostic diagrams (Figures 3 and 4). In these figures, solid lines trace loci of constant age, from 1.5 to 17 Gyrs (positive to negative values). Dashed lines trace loci of constant from to (lowest to highest metal line strength). Note that small systematic offsets ( Å) between the model and the observed index systems may well be present. We must stress that these models represent single stellar population (SSP) systems, whereas our galaxies contain a mixture of stellar populations of different ages and metallicities. The indices we measure are therefore a luminosity weighted mean index of all of the different populations present in each galaxy, and the higher luminosity of a young stellar population can mean that even the addition of a small percentage (by mass) of young stars into an old galaxy, can severely affect it’s overall ‘age’. For example, if one adds a (mass), population, to an population, the resultant stellar population would have the same line strengths as a SSP [Trager 1997]. In this paper, when we refer to a galaxy as ‘young’, we are referring only to its luminosity weighted mean age.
As we would expect, the blue and red galaxies occupy different areas of the line index diagrams. The blue galaxies which deviate by more than from the CM relation (Fig. 1) tend to populate the low age portion of the grid. The trend is common to the lower colour deviation galaxies as well: only six out of the 20 blue galaxies lie on the same part of the Worthey grid populated by the red galaxies. Both figures imply a young age for the blue galaxies (an effect driven mainly by the index); however they seem to indicate different trends for the the red galaxies which make up the ridge of the CMR. In Figure 3 red galaxies span a range both in metallicity and in age, seeming to indicate a far from simple formation scenario, especially as the more massive galaxies appear to have the younger ages. We must remember however, that the model grids at these high metallicities are far from secure. In particular, we have already noted the overabundance problem in the models for galaxies with Åin §2.2. If we ignore these galaxies, the span in age and metallicity of the red galaxies is reduced.
does not suffer from the same overabundance effects as , however it also has more of an age dependence, producing slightly more degenerate model grids. In addition, the measurements have larger relative errors. In figure 4, we can see again that the blue galaxies have younger ages than do the red ones, however they no longer exclusively populate the low metallicity portion of the grid. Some of the galaxies are in parts of the plot completely outside the parameter space covered by the model grid, although these are the galaxies with the largest error bars in the data. The red galaxies have a lower spread in metallicity, and do not follow the same trend in age as in figure 3, however, due to the increased scatter in the data, and the increased degeneracy in the model grid, it is still not possible to say that they follow a single age population model line. This may simply be due to the lower signal to noise of the index.
It is worth noting that there is a morphological segregation in figures 3 and 4. In both figures all of the elliptical galaxies populate the old portion of the model grids, while the S0s and late type galaxies are spread over the grid. This seems to indicate there are both old and young S0 and late type galaxies, but only old ellipticals [Kuntschner & Davies 1998, Kuntschner 1998, Mehlert et al. 1998]. The overall effect seems to be connected with galaxy luminosity, with the lower luminosity galaxies having more varied star formation histories.
3.3 Colour residuals vs line strength residuals
Index Intercept Slope Scatter U-V mag mag Å Å Å Å Å Å Å Å Å
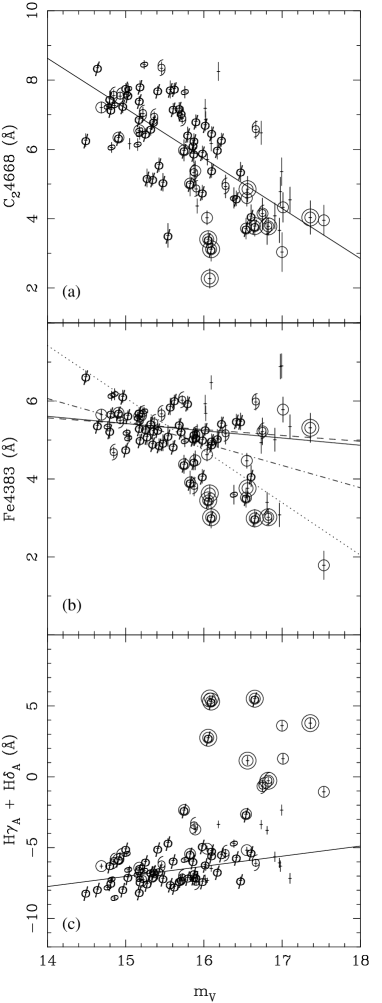
In section 3.2, we showed that the blue galaxies which deviate from the mean CMR have younger luminosity weighted ages than do the red galaxies. In this section we shall further investigate the correlation between colour offsets from the CMR, and analogous offsets from spectral index vs. magnitude relations (IMR) (Figure 5).
We define the mean IMR in the same way as we defined the mean CMR, by using the biweight estimator (see section 2.3) to get a linear relation between the spectral line strength and luminosity of a galaxy. We list the results of the fits in Table 2, and they are shown as the solid lines in figure 5. The residuals from the mean IMR are defined using equation 2.
Figure 5 and Table 2, show that we can define IMRs for all of our spectral indices. The relation (Fig. 5a) shows the best correlation, which fits in with the interpretation of the CMR as a metallicity sequence, since is the most metallicity sensitive of our three spectral indices [Worthey 1994]. The relation (Fig. 5c) also has an obvious IMR. Unlike the IMR, the red galaxies make up a relation of increasing with decreasing luminosity, while most of the blue galaxies are deviant from the relation.
The IMR (Fig 5b), like the IMR, shows increased scatter from the blue galaxies. To demonstrate the effectiveness of the biweight minimisation fit, we show some examples of different types of fit to the data. The solid line is the biweight scatter minimisation fit to all the data. The dashed line is the biweight fit to only the red CMR galaxies, the dot-dash line shows the biweight fit to galaxies with , and the dotted line shows the fit to all the data, using a method which bisects the ordinary least squares fits made by minimising the X and the Y residuals [Isobe et al. 1990, Feigelson & Babu 1992]. The biweight fit, and the least squares fit to only the red galaxies are almost identical. As is the case with the relation, most of the deviation comes from the blue galaxies, so we again take the biweight fit as the definition of the mean population. It should be noted that there is a much larger bootstrap uncertainty in the slope of the IMR than with any of the others (see Table 2), making the existence of a non-zero slope to the relation only a result.
Out of the three indices we investigate, is the most sensitive to metallicity, and indeed shows the greatest correlation with galaxy luminosity. This diagram agrees with the standard paradigm of a metal abundance driven CMR. The poorer correlation of is initially surprising, but seems to reflect the lower metal abundance sensitivity of the index relative to , a difference that is enhanced by the so-called ‘over abundance’ effect (cf., Fig. 2). This leads to the interesting possibility that the CMR is in fact driven by a correlation between luminosity and metal overabundance, however further investigation of this possibility would require improved spectra, and is beyond the scope of the present work.
Finally, we note that models of the index have more of a dependence on age than ; thus an age gradient along the CMR (in the sense of fainter galaxies having younger ages) would tend to steepen the slope. This effect is seen only in the position of the blue galaxies in Figure 5b.
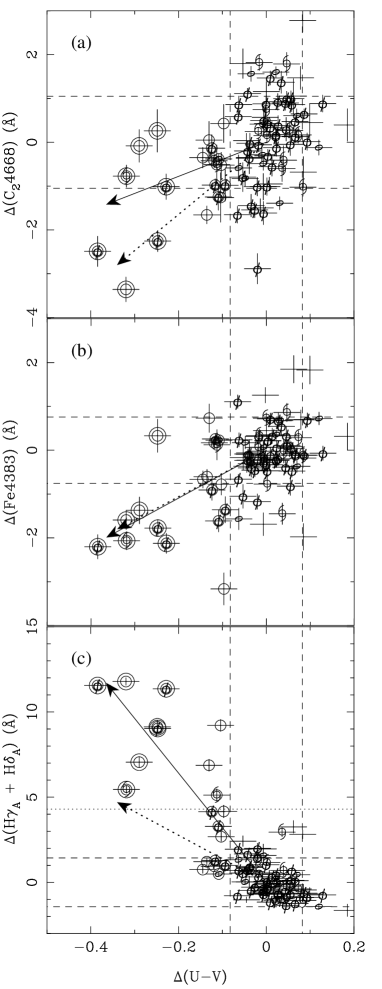
We now investigate how deviations from the CMR correlate with deviations from the IMRs. We show the correlations in Figure 6. To aid the eye, we show the deviations from the CMR and IMRs as dashed horizontal and vertical lines. The dotted line in panel (c) shows the scatter in the relation. We have used the Worthey [Worthey 1994], Worthey & Ottaviani [Worthey & Ottaviani 1997] models to show how changes in age (solid arrow) and metallicity (dotted arrow) would affect galaxies in the CMR/IMR plot. The age arrow was calculated by adding a 15% (by mass) population of 1Gyr old stars with solar metallicity, to an 8 Gyr old population with solar metallicity. The metallicity arrow was calculated by changing the metallicity of an 8 Gyr old population from to . These arrows can be thought of as vectors, in that increasing the size of the post–starburst population, or decreasing the metallicity of the population further, tends to increase the length of the arrows, without significantly changing their direction. Note however that if a galaxy were undergoing a starburst at the time of observation, it would have Balmer lines (Fig 6c) in emission, and would therefore have negative , but it would still posses blue colours (negative ). This emission quickly fades and turns into absorption, and after Gyr, the galaxies indeed roughly follow the vector shown in Figure 6c.
Figure 6a shows deviations from the IMR. Only three of the (double–ringed) galaxies have values which lie outside the range indicated by the dashed lines, with the other four double–ringed galaxies lying within of the distribution. The age (solid) vector, indicates that we wouldn’t expect much deviation for , and indeed the majority of the double–ringed blue galaxies lie close to the age vector. The three double–ringed galaxies most deviant in , do lie closest to the metallicity vector, however given the large range in the indices of the ‘red’ population, they are not inconsistent with the age vector. By contrast, the age and metallicity vectors for the relation (Figure 6b) are degenerate, and indeed all but a couple of the blue galaxies lie along these vectors.
The correlation between and is the strongest of the three (Fig 6c). Like Figure 6a, there is a significant separation between the age and metallicity vectors, and all but one of the double–ringed blue galaxies lie closer to the age vector than the metallicity one. This includes the three blue galaxies which lie along the metallicity vector in Figure 6a. In this case however, the range in the indices for the ‘red’ galaxies is less than the equivalent range of in Figure 6a, and cannot be used to account for the distance of most of the ‘blue’ galaxies from the metallicity vector. Additionally, all of the double–ringed blue galaxies deviate from the mean IMR by more than (the dotted horizontal line). These effects can only be accounted for by using a younger mean stellar population.
4 Implications
We have shown using both the and the indices, that the ‘red’ galaxies which make up the colour–magnitude relation in the Coma cluster, span a range of metallicities. Whether this is the sole driving force behind the CMR, or whether there is also a correlation between age and luminosity is more debatable. There is no evidence for an age trend with the age-estimates based on the index, however the models indicate that the more luminous galaxies have younger ages. It could be that the effect is not visible in the models due to the higher degree of degeneracy in the age and metallicity tracks for this index, but it should be noted that any trend in age comes from the index, at strengths where overabundance effects mean that it is no longer properly predicted by the Worthey models (see Fig 2 and Vazdekis et al. [Vazdekis et al. 1996], [Vazdekis et al. 1997]). Kuntschner [Kuntschner 1998] corrects the index in his Fornax cluster galaxies for such overabundance problems in the models, and shows that much of the age upturn for the bright ellipticals disappears. If the correlation between age and luminosity is real however, it would be in the direction predicted by semi–analytic hierarchical clustering models, which predict that more luminous cluster galaxies should have younger luminosity weighed ages, and higher metallicities, than the less luminous ones [Kauffmann & Charlot 1998]. Finally, we note that the sense of this age gradient is such that the CMR cannot be explained by an age variation alone. In contrast, even greater metal abundance variations are required in order to restore the observed slope.
We find that galaxies which deviate bluewards from the CMR, also deviate from the –magnitude and the –magnitude relations, but not the –magnitude relation. This is consistent with the colour deviant galaxies having undergone a secondary burst of star formation giving young luminosity weighted ages, or showing overall younger ages. The interpretation of the CMR as a mainly metallicity sequence, with deviations being caused by age variations seems correct. This allows the CMR to be used to place constraints on the star formation histories of the cluster galaxies, an approached used by many authors [Bower et al. 1992, Stanford et al. 1998, Ellis et al. 1997, Bower et al. 1998].
Despite the attempts of C93 to reject late-type galaxies from their sample, a few still seem to have slipped in. We found that the S0 and late-type galaxies span a range in ages [Kuntschner & Davies 1998, Mehlert et al. 1998], but all elliptical galaxies are old. In addition, it is important to note that the younger galaxies are also lower luminosity galaxies, an effect also seen in the Fornax sample of Kuntschner & Davies [Kuntschner & Davies 1998], and in low luminosity () Coma S0 galaxies [Caldwell & Rose 1998]. Worthey [Worthey 1997] also found that lower luminosity galaxies have a larger spread of ages. This may indicate that star formation activity is being ‘down sized’ to lower luminosity objects as the universe becomes older [Cowie et al. 1996] or may simply be an artifact of the greater numbers of lower luminosity galaxies. Of the galaxies which lie on the CMR (the red galaxies) we find no obvious difference between the ages of the early and late types, all of them have old luminosity–weighted mean stellar ages. This includes 10 out of the 12 late-type galaxies in the sample, although this result should not be too surprising since their spectroscopic properties will almost certainly be dominated by their bulge.
Finally, we note that the use of CMR–corrected colours is an efficient way of searching for post–starburst galaxies. The CMR constructed by C93 for these same objects (figure 8 in C93), shows that them to have a much smaller deviation from the mean population than our colours do. In fact all our very blue objects, which deviate blueward by more than two standard deviations from the CMR colour, have Balmer line strengths that deviate by more than three standard deviations from the red galaxies. If we were to search for the PSB galaxies from scratch, and made a colour cut one standard deviation blueward of the CMR, we would find all of the deviant Balmer line galaxies, with only a contamination from the ‘normal’ population.
ACKNOWLEDGEMENTS
We acknowledge the use of STARLINK computing facilities at the University of Durham and the University of Birmingham. This work was supported by the PPARC rolling grant for ”Extra-Galactic Astronomy and Cosmology at Durham”.
References
- [Andreon et al. 1996] Andreon S., Davoust E., Michard R., Nieto J. L., Poulain P., 1996, Astronomy and Astrophysics Supplement Series, 116, 429
- [Andreon et al. 1997] Andreon S., Davoust E., Poulain P., 1997, Astronomy and Astrophysics Supplement Series, 126, 67
- [Arimoto & Yoshii 1987] Arimoto N., Yoshii Y., 1987, A&A, 173, 23
- [Baier 1984] Baier F. W., 1984, Astronomische Nachrichten, 305, 175
- [Barbaro & Poggianti 1997] Barbaro G., Poggianti B. M., 1997, A&A, 324, 490
- [Beers et al. 1990] Beers T. C., Flynn K., Gebhardt K., 1990, AJ, 100, 32
- [Bower et al. 1998] Bower R. G., Kodama T., Terlevich A. I., 1998, MNRAS, 299, 1193
- [Bower et al. 1992] Bower R. G., Lucey J. R., Ellis R. S., 1992, MNRAS, 254, 601
- [Burstein et al. 1987] Burstein D., Davies R. L., Dressler A., Faber S. M., Stone R. P. S., Lynden-Bell D., Terlevich R. J., Wegner G., 1987, ApJS, 64, 601
- [Butcher & Oemler 1978] Butcher H., Oemler J., A., 1978, ApJ, 226, 559
- [Butcher & Oemler 1984] Butcher H., Oemler J., A., 1984, ApJ, 285, 426
- [Buzzoni et al. 1993] Buzzoni A., Chincarini G., Molinari E., 1993, ApJ, 410, 499
- [Buzzoni et al. 1992] Buzzoni A., Gariboldi G., Mantegazza L., 1992, AJ, 103, 1814
- [Caldwell & Rose 1998] Caldwell N., Rose J. A., 1998, AJ, 115, 1423
- [Caldwell et al. 1996] Caldwell N., Rose J. A., Franx M., Leonardi A. J., 1996, AJ, 111, 78
- [Caldwell et al. 1993] Caldwell N., Rose J. A., Sharples R. M., Ellis R. S., Bower R. G., 1993, AJ, 106, 473
- [Charlot & Silk 1994] Charlot S., Silk J., 1994, ApJ, 432, 453
- [Colless & Dunn 1996] Colless M., Dunn A. M., 1996, ApJ, 458, 435
- [Couch & Sharples 1987] Couch W. J., Sharples R. M., 1987, MNRAS, 229, 423
- [Cowie et al. 1996] Cowie L. L., Songaila A., Hu E. M., Cohen J. G., 1996, AJ, 112, 839
- [Davies et al. 1993] Davies R. L., Sadler E. M., Peletier R. F., 1993, MNRAS, 262, 650
- [Dressler 1980] Dressler A., 1980, ApJS, 42, 565
- [Dressler 1984] Dressler A., 1984, ApJ, 281, 512
- [Ellis et al. 1997] Ellis R. S., Smail I., Dressler A., Couch W. J., Oemler J., Augustus, Butcher H., Sharples R. M., 1997, ApJ, 483, 582
- [Escalera et al. 1992] Escalera E., Slezak E., Mazure A., 1992, A&A, 264, 379
- [Faber & Jackson 1976] Faber S. M., Jackson R. E., 1976, ApJ, 204, 668
- [Feigelson & Babu 1992] Feigelson E. D., Babu G. J., 1992, ApJ, 397, 55
- [Godwin et al. 1983] Godwin J. G., Metcalfe N., Peach J. V., 1983, MNRAS, 202, 113
- [González 1993] González J. J., 1993, Ph.D. thesis, Univ. California, Santa Cruz
- [Isobe et al. 1990] Isobe T., Feigelson E. D., Akritas M. G., Babu G. J., 1990, ApJ, 364, 104
- [Kauffmann & Charlot 1998] Kauffmann G., Charlot S., 1998, MNRAS, 294, 705
- [Kodama 1997] Kodama T., 1997, Ph.D. thesis, Institute of Astronomy, University of Tokyo
- [Kodama & Arimoto 1997] Kodama T., Arimoto N., 1997, A&A, 320, 41
- [Kuntschner 1998] Kuntschner H., 1998, Ph.D. thesis, Department of Physics, University of Durham
- [Kuntschner & Davies 1998] Kuntschner H., Davies R. L., 1998, MNRAS, 295, L29
- [Larson 1974] Larson R. B., 1974, MNRAS, 169, 229
- [Larson et al. 1980] Larson R. B., Tinsley B. M., Caldwell C. N., 1980, ApJ, 237, 692
- [Lucey et al. 1997] Lucey J. R., Guzman R., Steel J., Carter D., 1997, MNRAS, 287, 899L
- [Mehlert et al. 1998] Mehlert D., Bender R., Saglia R. P., Wegner G., 1998, in Untangling Coma Berenices: A New Vision of an Old Cluster, p. 107
- [Osterbrock 1989] Osterbrock D. E., 1989, in Published by University Science Books, 648 Broadway, Suite 902, New York, NY 10012, 1989.
- [Renzini & Buzzoni 1986] Renzini A., Buzzoni A., 1986, in Spectral Evolution of Galaxies, p. 195
- [Stanford et al. 1998] Stanford S. A., Eisenhardt P. R., Dickinson M., 1998, ApJ, 492, 461
- [Terlevich 1998] Terlevich A., 1998, Ph.D. thesis, Department of Physics, University of Durham
- [Terlevich et al. 1999] Terlevich A., Bower R., Caldwell N., 1999, in prep
- [Trager 1997] Trager S. C., 1997, Ph.D. thesis, Univ. California, Santa Cruz
- [Vader 1986] Vader J. P., 1986, ApJ, 306, 390
- [Vazdekis et al. 1996] Vazdekis A., Casuso E., Peletier R. F., Beckman J. E., 1996, ApJS, 106, 307
- [Vazdekis et al. 1997] Vazdekis A., Peletier R. F., Beckman J. E., Casuso E., 1997, ApJS, 111, 203
- [Visvanathan & Sandage 1977] Visvanathan N., Sandage A., 1977, ApJ, 216, 214
- [Worthey 1994] Worthey G., 1994, ApJS, 95, 107
- [Worthey & Ottaviani 1997] Worthey G., Ottaviani D. L., 1997, ApJS, 111, 377
- [Worthey 1997] Worthey G., 1997, in Holt, S. S., Mundy, L. G., eds, Star Formation Near and Far. AIP Press, Woodbury N.Y. v 393, p525