Photometric Redshifts in lensing clusters: Identification and Calibration of faint high- galaxies
Abstract
We discuss a method aiming to use photometric redshifts in lensing clusters to access the population of distant background sources. The amplification provided by gravitational lensing allows to calibrate photometric redshifts 1 to 3 magnitudes deeper with respect to field studies. We present and discuss some results obtained with this procedure on extensively studied clusters, as well as the future issues of this project.
Observatoire Midi-Pyrénées, UMR 5572, 14, Avenue E. Belin, F-31400 Toulouse, France
Istituto di Fisica Cosmica ”G.P.S. Occhialini”, via Bassini 15, 20133 Milano, Italy
Astronomical Institute, Tohoku University, Aramaki, Aoba-ku, Sendai 980-8578, Japan
1. Introduction
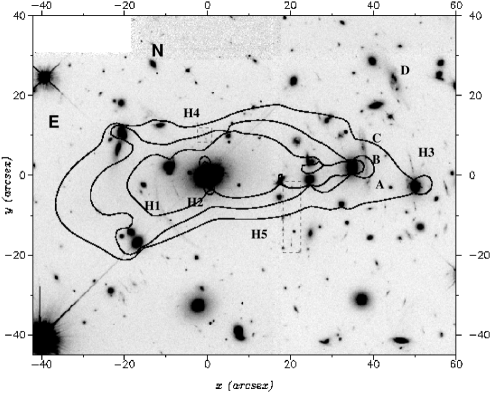
Lensing clusters can be used as gravitational telescopes to build up and to study an independent sample of high- galaxies, in order to complement the large samples obtained in field surveys. The amplification close to the critical lines is typically 2 to 3 mags, and it is still mag at 1’ from the cluster center (see Figure 1). The signal/noise ratio in spectra of amplified sources and the detection fluxes are improved beyond the limits of conventional techniques, whatever the wavelenght used for this exercise. In particular, the amplification properties have been succesfully used in the ultra-deep MIR survey of A2390 (Altieri et al. 1999), and the SCUBA cluster lens-survey (Smail et al 98; Blain et al. 99). We discuss here the systematic use of photometric redshifts in lensing clusters to identify high- sources. This is the basis of a large collaboration program presently going on, and involving different european institutions, aimimg to perform the spectroscopic follow up of high- candidates selected from the visible and near-IR photometry.
The first lensed galaxy confirmed at was the spectacular blue arc in Cl2244-02 (Mellier et al., 1991). More recent examples of highly-magnified galaxies, identified either purposely or serendipitously, strongly encourages this approach: the star-forming source in A2218 at z=2.51 (Ebbels et al. 1996); the luminous z=2.7 arc behind the EMSS cluster MS1512+36 (Yee et al. 1996; Seitz et al., 1998); three z 4 galaxies in Cl0939+47 (Trager et al. 1997); a z=4.92 system in Cl1358+62 (Franx et al. 1997, Soifer et al. 1998); and the two red galaxies at in A2390 (Frye & Broadhurst 1998, Pelló et al. 1999).
2. Photometric Redshifts
The method used here to compute photometric redshifts (hereafter ) is a standard SED fitting procedure, according to:
| (1) |
where , , and are the observed and template fluxes and their uncertainty in filter i, respectively, and b is a normalisation constant. It was originally developed by Miralles (1998) (see also Miralles & Pelló 1998), and a new version of this code called hyperz is presently developed (Bolzonella et al. in preparation). The set of templates includes mainly spectra from the Bruzual & Charlot evolutionary code (GISSEL98, Bruzual & Charlot, 1993), and also a set of empirical SEDs compiled by Coleman, Wu and Weedman (1980) to represent the local population of galaxies. The synthetic database derived from Bruzual & Charlot includes 255 spectra, distributed into 5 different star-formation regimes (51 different ages for the stellar population, all of them with solar metallicity): a burst of 0.1 Gyr, a constant star-formation rate, and 3 models (exponential-decaying SFR) with characteristic times of star-formation chosen to match the present-day sequence of E, Sa and Sc galaxies. The reddening law is taken from Calzetti (1999), but 4 other laws are also included in our code. The normal setting for ranges between 0 and 0.5 magnitudes. Flux decrements in the Lyman forest are computed according to Giallongo & Cristiani (1990) or Madau (1995), both of them giving similar results. When applying hyperz to the spectroscopic samples available on the HDF, the uncertainties are typically .
3. Identification of high- sources
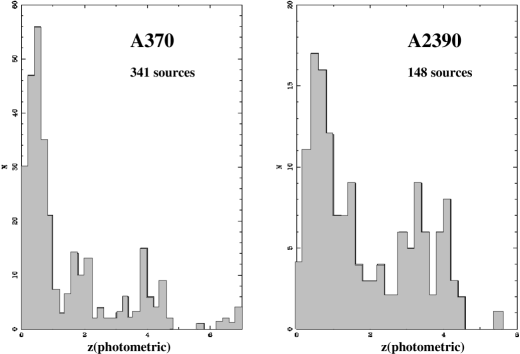
High-z lensed sources are selected close to the appropriate critical lines (see Figure 1), with . Figure 2 displays the distribution of arclets in two well known lensing clusters, where the sample of arclets have been applied according to different selection criteria. In all cases, is computed on the basis of a photometric survey including near-IR data. The method is restricted to lensing clusters whose mass distribution is highly constrained by multiple images (revealed by HST or ground-based multicolor images), where the amplification uncertainties are typically 0.3 magnitudes. Such clusters with well constrained mass distributions enable to recover precisely the properties of lensed galaxies (morphology, magnification factor). Highly magnified sources are presently the only way to access the dynamical properties of galaxies at , through 2D spectroscopy, at a spatial resolution 1 kpc. The two multiple-images at the same , observed behind A2390, are un example of these reconstruction capabilities (Pelló et al. 1999). Cluster lenses can be used advantageously to determine the redshift distribution up to the faintest levels through magnified sources (Figure 2). It is also the natural way to search for primeval galaxies, in order to constraint the scenarios of galaxy formation.
4. Photometric Redshifts compared to Spectroscopic and Lens Inversion results
For a subsample of spectroscopically confirmed objects, we have tested the photometric redshift accuracy as a function of the relevant parameters (SFR, reddening, age and metallicity of the stellar population). We have also cross-checked the consistency between the photometric, the spectroscopic and the lensing redshift obtained from inversion methods (Ebbels et al. 1998). The agreement between the three methods is good up to at least . For higher redshifts, the results for the most amplified sources are promising, but an enlarged spectroscopic sample is urgently needed. The comparison between the spectroscopic and the lensing redshift has been studied in the field of A2218 (Ebbels et al. 1998), and all the present results seem to follow this trend at least to . Figure 4 displays the difference between and lens redshift for a subsample of 98 arclets in the core of A2390, selected according to morphological criteria (minimum elongation and right orientation are requested). According to these results, about of the sample have . Most of the discrepancy corresponds to sources with . A general trend exists with high- images, which are not correctly identified by inversion techniques as compared to . This behaviour is expected as a result of the relative low sensitivity to of the inversion method for high- values.
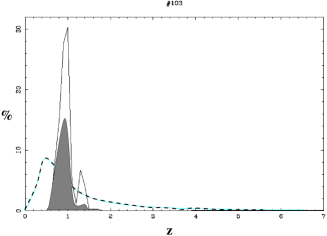
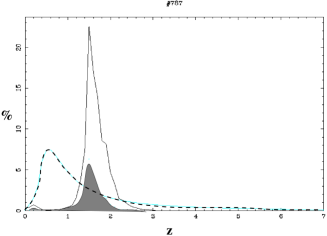
Taking into account that and lensing inversion techniques produce independent probability distributions for amplified sources, combining both methods provides with an alternative way to determine the redshift distribution of high- sources. Figure 3 shows un example for 2 MIR selected sources in A2390.

5. Conclusions and Future Developments
The selection of high- candidates in cluster lenses using a approach is strongly supported by the present results. The efficiency is increased when using a large wavelength range to compute , including the IR bands. For most statistical purposes, should be accurate enough to discuss the properties of these extremely distant galaxies. Conversely, lensing clusters could be used as a tool to check photometric redshifts up to the faintest limits, through the spectroscopic confirmation of for such amplified sources. An Ultra-Deep Photometric Survey of selected cluster lenses is urgently needed to probe the distant Universe, and this could be a a well defined program for the ACS camera on HST.
Acknowledgments.
We are grateful to G. Bruzual, S. Charlot, Y. Mellier, B. Fort, R.S. Ellis, J.F. Le Borgne and M. Dantel-Fort for useful discussions on this particular technique. Part of this work was supported by the TMR Lensnet ERBFMRXCT97-0172 (http://www.ast.cam.ac.uk/IoA/lensnet).
References
Altieri, B., et al. 1999, A&A, 343, L65
Blain, A. W., Kneib, J.-P., Ivison, R. J., Smail, I. 1999, ApJ, 512, L87
Bruzual, G., Charlot, S. 1993, ApJ, 405, 538
Calzetti, D. 1999, Ringberg Workshop on Ultraluminous Galaxies September 20-26, 1998. Kluwer Proceedings (astro-ph/9902107)
Coleman, D.G., Wu, C.C., Weedman, D.W. 1980, ApJS, 43, 393
Ebbels, T.M.D., et al. 1996, MNRAS, 281, L75
Ebbels, T.M.D., et al. 1998, MNRAS, 295, 75
Franx M., et al. 1997, ApJ, 486, 75
Frye B., Broadhurst T. 1998, ApJ, 499, 115
Giallongo E., Cristiani S. 1990, MNRAS, 247, 696
Madau P. 1995, ApJ, 441, 18
Mellier Y., et al. 1991, ApJ, 380, 334
Miralles, J. M. 1998, PhD. thesis Université Paul Sabatier
Miralles, J. M., Pelló R. 1998, ApJ, submitted, (astro-ph/9801062)
Pelló, R. et al. 1999, A&A, 346, 359, (astro-ph/9810390)
Seitz, S., et al. 1998, MNRAS, 298, 945
Smail, I., Ivison, R. J., Blain, A. W., Kneib, J.-P. 1998, AAS 192, 4813
Soifer, B.T., et al. 1998, ApJ, 501, 171
Trager S. C., et al. 1997 , ApJ, 485, 92
Yee, H.K.C., et al. 1996, AJ, 111, 1783