Young stars and non-stellar emission in the aligned radio galaxy 3C 256111Based in part on observations made with the NASA/ESA Hubble Space Telescope, obtained at the Space Telescope Science Institute, which is operated by the Association of Universities for Research in Astronomy, Inc. under NASA contract NAS 5-26555, and on observations made with the W. M. Keck Observatory
Abstract
We present ground-based images of the radio galaxy 3C 256 in the standard BVRIJHK filters and an interference filter centered at 8800 Å, a Hubble Space Telescope image in a filter dominated by Ly emission (F336W), and spectra covering rest-frame wavelengths from Ly to [O III] 5007. Together with published polarimetry observations, we use these to decompose the overall spectral energy distribution into nebular continuum emission, scattered quasar light, and stellar emission. The nebular continuum and scattered light together comprise half (one third) of the -band (-band) light within a 4″ aperture, and are responsible for the strong alignment between the optical/near-infrared light and the radio emission. The stellar emission is dominated by a population estimated to be 100–200 Myr old (assuming a Salpeter IMF), and formed in a short burst with a peak star formation rate of 1– yr-1. The total stellar mass is estimated to be no more than , which is far less than other luminous radio galaxies at similar redshifts, and suggests that 3C 256 will undergo further star formation or mergers.
1 Introduction
The radio galaxy 3C 256 (; Dey et al. 1996, hereafter D96) was first identified by Spinrad & Djorgovski (1984), at which time it was the highest redshift galaxy known. It is one of the most luminous radio galaxies so far discovered ( W Hz-1; we adopt km s-1 Mpc-1, , and 222For this cosmology, the angular size scale at the distance of 3C 256 is 11.3 kpc arcsec-1, and the look-back time is 11.9 Gyr to a Universe that is 4.6 Gyr old.), and also one of the best examples of the alignment effect, i.e., the tendency for the optical and radio emission from high-redshift radio galaxies to share a common position angle (Chambers, Miley, & van Breugel 1987; McCarthy et al. 1987). However, unlike most luminous radio galaxies, where the alignment is much weaker in the near-infrared (Rigler et al. 1992; Dunlop & Peacock 1993), in 3C 256 the continuum shows a clear elongation along the radio position angle of even in the -band (Eisenhardt & Dickinson 1992). The radio and optical sizes of 3C 256 are also very similar, with a 4″ (45 kpc) separation between the two radio lobes.
The nature of the alignment effect is not yet fully understood. Various mechanisms have been proposed, including star formation induced by the expanding radio source (e.g., Rees 1989; De Young 1989; Begelman & Cioffi 1989), scattering of an anisotropic continuum from the active nucleus (e.g., di Serego Alighieri et al. 1989; Tadhunter et al. 1989; Fabian 1989), inverse Compton scattering of microwave background photons (Daly 1992a,b) and nebular continuum emission (e.g., Dickson et al. 1995). All of these models explain why the alignment effect is normally observed to be stronger in the rest-frame ultraviolet, since the aligned continuum is much bluer than the evolved stellar population which is believed to emit most of the near-infrared light in these radio galaxies. Since 3C 256 displays such a strong alignment at ( Å), is unusually blue (; Eisenhardt & Dickinson 1992), and is underluminous in the -band Hubble diagram (; Chokshi & Eisenhardt 1991), it may be an object which has yet to form a substantial population of evolved stars. Such arguments led Elston (1988) and Eisenhardt & Dickinson (1992) to suggest that 3C 256 is undergoing its first major burst of star formation, i.e., is a protogalaxy.
Imaging polarimetry observations by Jannuzi et al. (1995) have shown the spatially extended emission to be strongly polarized (% in a 36 aperture; % in a 78 aperture) with the electric vector perpendicular to the radio and optical axes of 3C 256. This result is naturally explained if the extended polarized radiation is produced by the scattering of emission from a source located near the center of 3C 256. Similar polarimetric observations of other radio galaxies have been used to support the scattering hypothesis for the alignment effect. Spectropolarimetry by D96 further supports this scenario in the case of 3C 256 by demonstrating that the spatially extended polarized radiation has a power law form consistent with the emission having been originally produced by an active nucleus (). These authors also suggested a protogalactic nature for 3C 256, proposing that the galaxy has yet to undergo the major burst(s) of star formation that will convert most of its mass into stars.
In this paper, we combine new and existing optical and near-infrared observations to identify and model the components of the spectral energy distribution of 3C 256. In §2, we present the new data obtained for this paper. In §3, we construct the rest-frame ultraviolet/optical spectral energy distribution of 3C 256 and discuss its properties and the salient morphological points. In §4, we identify the components necessary to explain the observed SED and morphology and estimate their strengths. In §5, we discuss the implications of our decomposition, and in §6, we provide a summary of our results.
2 Observations and reduction
2.1 Optical spectroscopy
3C 256 was observed with the double spectrograph (Oke & Gunn 1982) on the Hale 5-m telescope at Palomar Observatory over the course of 5 nights in January 1990 and April 1991. A 2″-wide slit was used, oriented along (i.e., along the optical major axis). The blue spectra were obtained with a 300 lines mm-1 grating blazed at 4000 Å and the red channel employed a 316 lines mm-1 grating blazed at 7500 ÅĖach exposure lasted 3000–4000 s and the object was recentered in the slit by offsetting from a nearby star every 2 hours. The spectra were reduced and calibrated in a standard manner. The flux calibration was based on observations of Ross 374, Feige 67 and BD +26°2606. All of the 1-D spectra (extracted along a 55 aperture) were combined, after scaling those observed through cirrus (present on 2 of the 5 nights) to match the spectra taken under photometric conditions. We present the final, reduced spectrum in Fig. 1.
2.2 Infrared spectroscopy
A low-resolution near-infrared spectrum was obtained on the night of 1997 Jun 15 using the Near-Infrared Camera (NIRC; Matthews & Soifer 1994) on the Keck I telescope. The 150 lines mm-1 JH grism was used with a 07 wide slit, giving a resolution . The slit was oriented at , which was the closest to the major axis that could be achieved while still being able to acquire a guide star. Individual 200 s exposures were obtained at five different positions along the slit, separated from each other by 5″. The process was then repeated, to obtain a total exposure time of 2000 s. Each set of five exposures was median-filtered and this median image subtracted from each individual exposure to provide first-order sky subtraction. More accurate subtraction of sky lines was performed on each exposure by fitting a quadratic function of position to each column of the image, which was then subtracted. The individual frames were registered and a spectrum extracted through a 3″ aperture.
Five exposures were also taken of the G5V star BD +32°2290 and reduced in a similar manner, and used to correct the 3C 256 spectrum for atmospheric absorption and provide flux calibration. Short exposure images in the and filters image were taken immediately before and after the spectroscopy to enable an accurate determination of the slit location. The reduced spectrum is presented in Fig. 2.
2.3 Optical imaging
A list of the ground-based imaging observations used in this paper is presented in Table 1; a number of these have been presented elsewhere (Spinrad & Djorgovski 1984; Le Fèvre et al. 1988). In addition, an image was taken with the Mayall 4-m telescope at Kitt Peak National Observatory though an interference filter with central wavelength 8800 Å and FWHM 550 Å, and a -band image was also obtained at the Hale Telescope. Both sets of data were reduced in a similar manner, using standard techniques. Flux calibration was performed using observations of the field of M 92 (Christian et al. 1985; -band image) or spectrophotometric standards from the list of Massey & Gronwall (1990; 8800 Å image). The best images taken through the , , , and filters are shown in Fig. 3.
2.4 Infrared imaging
A number of new near-infrared images were also obtained for this paper, as listed in Table 1. These include and -band images taken with NIRC on the Keck I telescope, and images taken with the infrared array camera IRIM (a InSb array with a plate scale of 039 pixel-1) on the Mayall Telescope, and an -band image taken using the Prime Focus Infrared Camera (PFIRCAM; Jarrett et al. 1994) on the Hale Telescope. Observations and subsequent reduction were performed following standard ‘jittering’ methods. Flux calibration was determined from observations of photometric standards from the lists of Elias et al. (1982; Mayall data), Persson et al. (1998; Keck data), or Casali & Hawarden (1992; Hale data). The -band image from the Mayall telescope is the coaddition of several mosaics taken on the nights of 1989 Apr 17, 1991 May 24, and 1992 Mar 22. The and images from Keck are presented in Fig. 3.
2.5 HST imaging
Initial HST imaging observations of 3C 256 were made with WF/PC in Cycle 1, but no useful and reliable morphological information could be extracted from them, due to a poor signal-to-noise ratio, lack of good flatfields, and the complexity of the pre-refurbishment point spread function. These data are therefore not discussed in this paper.
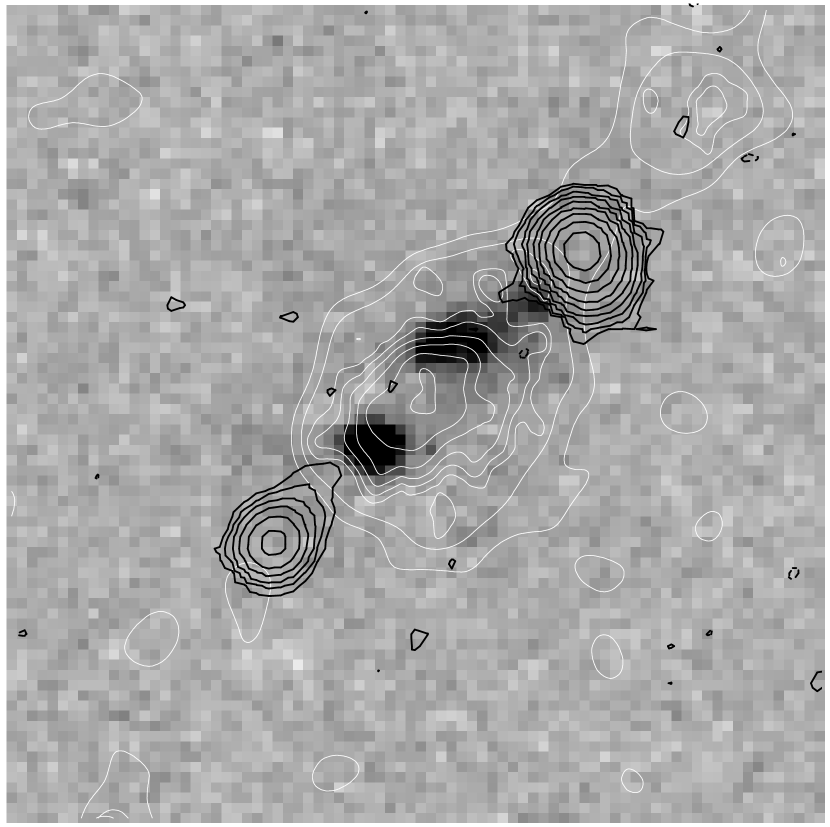
The source was re-observed with HST/WFPC2 in the F336W filter on 1996 May 22. Ly, at a wavelength of 3433 Å, lies close to the peak transmission of this filter and, since the observed equivalent width of the emission line is Å and the width of the filter is only 381 Å, it dominates the observed flux. The source was placed on the WF3 chip, providing a scale of 0100 pixel-1. Eight orbits were spent on the source, for a total of 21,400 s of integration. The data were processed through the STScI pipeline (Voit et al. 1997) and cosmic rays were rejected and the data combined in the normal manner using the iraf task crrej. In Fig. 4 we show an overlay of the F336W and -band images and the 5 GHz radio map of D96.
3 Results
3.1 Spectroscopy
We have used the specfit software (Kriss 1994; available as part of iraf/stsdas) to measure line fluxes and equivalent widths from our spectra. We fitted a Gaussian line profile and linear continuum level to a 200 Å-wide region of the optical spectrum (1000 Å-wide for the infrared spectrum), centered on the emission line. In instances where two emission lines were separated by less than 100 Å (500 Å), we fitted the continuum and two Gaussians simultaneously to a region covering 100 Å (500 Å) on both sides of each line. It was confirmed in all cases that the flux of the best-fitting Gaussian was very close to that produced by a direct measurement of the flux above the best-fitting continuum level. The emission-line fluxes and rest-frame equivalent widths are presented in Table 2.
The power law which provides the best fit to our spectrum has a spectral index (), very much redder that the found by D96. However, if we restrict our wavelength range to that between the C IV and Mg II lines, common to both spectra, a much bluer spectral index () is found, consistent with D96’s value. This indicates a change in spectral shape near 1500 Å (rest-frame). We return to this point in the next section.
3.2 Spectral energy distribution
We co-registered the various images by computing a geometric transformation based on the locations of stars in the images, and constructed the spectral energy distribution (SED) of 3C 256 in the optical–near-infrared (rest-frame ultraviolet–optical) by making photometric measurements through a 4″ aperture, centered on the peak of the -band emission. This aperture is large enough to encompass all the high surface brightness emission from the galaxy, and therefore errors introduced by poor registration of the images will be smaller than the photometric uncertainties.
We correct the observed broad-band fluxes for the presence of strong emission lines. We smooth the F336W image, which is dominated by Ly, to the resolution of our ground-based images and compare the fluxes in the spectroscopic and photometric apertures333Recently-obtained HST F555W images confirm that the ultraviolet continuum shares the Ly morphology (Jannuzi et al. 1999).. By assuming the other emission lines share the Ly morphology, we can thus use their spectroscopic fluxes to estimate their contributions to the broad-band photometry. We correct the optical photometry and -band photometry using the spectra of Figs 1 and 2, respectively. The -band flux is corrected for the presence of the [O I] 6300,6364 doublet assuming [O I] 6300/[O III] . No major emission lines lie within the -band. We estimate the uncertainty in our aperture correction to be %, based on the variations which result from different smoothing scales. However, this usually translates to a –2% error in the line-corrected flux, much less than the random photometric uncertainty. The exception is the line-corrected flux from the F336W image (Jy), whose large uncertainty is due to the high equivalent width of the Ly line.
When constructing the SED, we usually take the weighted mean of fluxes measured through similar filters. However, there is a significant difference between the -band filters used for the Mayall and Keck observations, in that the Keck filter extends to longer wavelengths, and includes the strong [O III] 4959,5007 doublet. Even though these lines lie in a region of poor and uncertain atmospheric transmission, their equivalent width is so large that they contribute significantly to the measured flux. We therefore use the Mayall measurement of the -band flux alone, whose bluer cutoff excludes these strong lines. We present the complete SED in Fig. 5.
The SED exhibits three major features which must be reproduced in any viable model. First, the optical–infrared color is very blue (); in fact 3C 256 is bluer even than a star forming dwarf Irr at this redshift. Secondly, longward of 1500 Å (rest-frame), the SED can be approximated by a power law with . Finally, there is a pronounced decrease in flux shortward of 1500 Å (seen most obviously in the spectrum rather than the continuum color), which we shall refer to as the “UV rollover”.
The importance of the UV rollover will become apparent later, and we spend some time here confirming its reality, since it is not seen in D96’s spectrum. In Fig. 6, we plot our spectrum and that of D96 (scaled to match ours redward of C IV since their spectrum was taken in non-photometric conditions through a slightly smaller aperture) in the wavelength region of interest. Both spectra agree very well around the C IV line and show a decrease in flux at Å; however, D96’s rises again below Å, and is % higher than ours shortward of this wavelength. This rise produces a broad absorption feature which D96 interpret to be a BAL cloud seen in the scattered light spectrum. We reject the possibility that our spectrum is incorrectly flux calibrated, since the spectroscopic Ly flux agrees well with that measured from images. The difference between the spectra may be due to aperture effects (D96 used a aperture, compared to our ), but this does not concern us since we are attempting to determine the overall SED, as measured in a 4″ aperture, rather than the detailed spatial distribution of individual components. Importantly, the spectrum of Spinrad et al. (1985) also shows the UV rollover, and rules out the possibility of differential atmospheric refraction as the cause of the rollover, since their observing technique positioned the major axis of the entrance aperture along the parallactic angle.
As with D96, we note the absence of any strong absorption lines in the spectrum, with the possible exception of a feature at 1720 Å (a blend of N IV, Si IV and Al II; e.g., Fanelli et al. 1992), although this is a marginal detection at best. Our typical signal-to-noise ratio of 4 per 2 Å pixel implies a rest-frame equivalent width detection limit of Å if the absorption lines are a few hundred km s-1 in width.
3.3 Morphology
The HST F336W image reveals two strong emission peaks, separated by 13, which can be identified with components and from Le Fèvre et al. (1988). There is also a third peak, further to the NW, which is not seen in Le Fèvre et al.’s image but might plausibly be the cause of the extension of , and some diffuse emission which contributes about 20% of the total flux. If the Ly emission is produced by photoionization from a central source, it should be located within two oppositely-directed cones, whose common apex marks the location of the hidden active nucleus. From Fig. 4, we measure the half-opening angles of such cones to be 28°, and the projected axis of the cones to be at , slightly offset from the radio axis position angle of 132° (D96).
Despite having rather poorer spatial resolution, our and images show a similar structure to Le Fèvre et al.’s data. The structure at is very different, however, with a central peak appearing between the Ly-emitting regions. The color of the central region of 3C 256 is , while the more extended emission has . This difference should be considered a lower limit to the true color variation, as seeing effects will smear the more strongly-peaked -band image, causing some redistribution of flux from the center to the outer regions.
In addition, there is an object located 4″ NW of 3C 256 along the radio axis. There appears to be low surface brightness emission connecting the companion to the radio galaxy, visible in both the and images, and so we speculate that the two are physically connected. The companion is only convincingly seen in the near-infrared images and, while there may be a marginal detection in the deep CFHT -band image, the fringing precludes any photometry.
4 Analysis
Our goal in this paper is to disentangle the various components which contribute to the overall spectral energy distribution of 3C 256 by using our new imaging and spectroscopy data, together with published polarimetry. Although it would clearly be helpful to model distinct regions of the source separately, the F336W image indicates that significant structure occurs on a scale of about 05. Our seeing-limited ground-based observations therefore preclude such an analysis, and instead we investigate the integrated SED of 3C 256 through a 4″ aperture. All the fluxes used in this section are either measured directly through such an aperture, or have been scaled from the optical spectrum by a factor of 1.2, to account for the difference in aperture sizes.
4.1 Scattered light
The polarimetric properties of 3C 256 all suggest that the polarized radiation is produced by the scattering of emission from a central source (Jannuzi et al. 1995; D96), presumably non-stellar emission from the active nucleus. Jannuzi et al. had no clear preference for electrons or dust as the scattering particles, while D96 favored electrons. In addition to the arguments advanced by D96, the spectral index of the polarized flux (; D96) is redder than the mean for radio-loud quasars (e.g., Baker & Hunstead 1995; Willott et al. 1998), which argues against the substantial bluening that dust scattering often produces. Also, theoretical models of dust scattering predict a fairly sharp change in polarization at Å (Kartje 1995; Manzini & di Serego Alighieri 1996), which is not seen in 3C 256 (D96). We therefore assume electron scattering throughout the remainder of this paper. Since this mechanism is achromatic, the scattered light spectrum will be the same as the spectrum of the central AGN seen by the scatterers (i.e., at angles close to the radio axis). We model this with the core-dominated quasar spectrum of Baker & Hunstead (1995), artificially “reddened” by 0.6 powers of to match the observed spectral index of the polarized flux (D96), and extrapolated as a power law longward of H.
We can estimate the fraction of scattered light by considering the lack of prominent broad lines in our spectrum. The broad permitted lines from the quasar nucleus should be scattered into our line of sight together with the non-stellar continuum. We fit the spectral region around C IV 1549 with narrow and broad Gaussians and determine a upper limit of 25 Å to the rest-frame equivalent width of any broad line. Like the limits D96 found for Mg II 2800, this is substantially lower than the mean value for the equivalent width of C IV in radio-loud quasars (e.g., Steidel & Sargent 1991; Baker & Hunstead 1995), but within the observed range. The absence of a broad emission line in our spectrum is therefore suggestive of the presence of non-scattered flux, but is certainly not conclusive. The lower signal-to-noise ratio in our spectrum at Ly means that even a broad line with an equivalent width of 100 Å (cf., a mean of 70 Å; Baker & Hunstead 1995) is consistent with the data.
4.2 Nebular continuum
Broadly speaking, the overall SED is consistent with an power law. Since this is also the spectral shape of the polarized flux, it appears possible to ascribe the total flux spectrum entirely to scattered light with a constant fractional polarization of %. However, Dickson et al. (1995) have shown that nebular continuum emission can be very important in powerful radio galaxies, and it is essential that we consider its contribution to the ultraviolet flux of 3C 256.
After applying an aperture correction, we determine the H flux in our 4″ aperture to be W m-2. This implies Ly/H, a value typical of high-redshift radio galaxies (e.g., McCarthy, Elston, & Eisenhardt 1992). We assume and that 5% of the helium is in the form of He II, based on the inferred ratio He II 1640/H and the recombination coefficients of Osterbrock (1989), although the result is rather insensitive to this value. Using the tabulated emission coefficients of Aller (1987) for K, the nebular continuum emission is shown by the solid curve in Fig. 5. In order to see more clearly the significance of the nebular emission to the overall SED, in Fig. 7 we plot the SED with the nebular emission (assumed to be unreddened) removed. The shape is dramatically different, with a clear break appearing at Å, which was previously obscured by the hydrogen recombination continuum.
Since this break is the most important evidence in favor of a substantial stellar population in 3C 256, we investigate how its strength is affected by different assumptions about the nebular continuum emission. Given the uncertainty in the H flux, we construct alternative SEDs where the nebular continuum has been reduced or increased by one-third (although note that the high observed [O III]/H ratio argues against our H flux being too high by a large amount). We also produce an SED where we have assumed that the observed ratio of Ly/H deviates from the low-density Case B recombination value of 23 (e.g., Ferland & Osterbrock 1985) due to a foreground dust screen, which also affects the observed nebular continuum. We use Pei’s (1992) Small Magellanic Cloud extinction law (the reason for this choice will become apparent later), although nearly identical results are obtained if we use Pei’s Galactic law or Calzetti’s (1997) empirical “recipe” which is based on observations of starburst galaxies. The implied reddening is . All three alternative SEDs are also plotted in Fig. 7, where it can be seen that the variation caused by these different assumptions is comparable to the photometric uncertainties. Furthermore, the Balmer jump persists throughout all the different assumptions, as shown in Fig. 7. We therefore adopt our original assumptions throughout the remainder of this analysis.
4.3 A young stellar population
The pronounced jump in the continuum level near 4000 Å implies starlight is a significant contributor to the total SED, both above and below this jump. Any stellar population must be fairly young (identifying this jump as the Balmer jump, not the 4000 Å break), since neither the 2600 nor 2900 Å breaks displayed by more evolved stellar populations are observed in our spectrum (see also D96), and the continua on both sides of the break are quite blue. However, three features of the revised SED are inconsistent with a population of arbitrarily young (hot) stars, namely the strong Balmer jump, relatively flat UV continuum and the UV rollover. All three of these are typical of main sequence stars of late B or early A type (e.g., Fanelli et al. 1992). Such stars only dominate the UV flux after the Myr needed for hotter stars to complete their evolution.
While no stellar absorption features are detected in our spectrum, the measured upper limit of 2 Å is typical of the narrow blends seen in A-type main sequence stars (Fanelli et al. 1992). This is before considering the effects of dilution from the scattered and nebular components, and the masking of absorption features by the strong emission lines. The observations are therefore not at odds with the notion that stars contribute significantly to the ultraviolet flux.
We compare our observations with synthetic stellar spectra produced with the GISSEL96 code (Bruzual & Charlot 1993, 1999), adopting a Salpeter (1955) IMF which extends from 0.1–125 . The upper mass cutoff is a fairly critical parameter in determining the age of the stellar population, since it is possible to reach the same main sequence turnoff much more rapidly than 100 Myr if more massive stars are never formed. On the other hand, the lower mass cutoff is important only in determining the total mass of stars.
We estimate the age of the young stellar population using the observed and colors, after correcting for the nebular continuum and scattered emission. In Fig. 8, these colors are compared with those of a stellar population formed in an instantaneous burst and seen at . The age of the stellar population is estimated to be between 70 and 400 Myr for an instantaneous burst (effectively independent of the assumed metallicity), with a best-fitting value of 220 Myr. It is clear from Fig. 8 that the age of the stellar population is constrained almost entirely by the color (i.e., the strength of the Balmer jump) and, since this wavelength baseline is short, the results are fairly insensitive to the spectral shape of the scattered continuum. Even if the scattered radiation does deviate significantly from our adopted spectrum, a young stellar population is still required to fit the SED of 3C 256. This analysis also provides an estimate of the strength of the scattered component, and our conclusion that % of the observed optical continuum flux is provided by this component is in line with the estimate of D96. Approximately half the rest-frame ultraviolet continuum therefore comes from starlight.
Although we assume an instantaneous burst, the uncertainty in this age gives some indication of the possible duration over which star formation could have occurred. Models where the star formation rate (SFR) follows an exponential decline cannot provide a good fit to the overall SED unless the characteristic time scale is small ( Myr), since the UV rollover demands that most of the 1500 Å flux arises from stars older than about 100 Myr, and hence the present star formation rate must be low. Models where the SFR is constant for a finite period of time and then drops to zero are more successful, with there being little difference in the SEDs of a 200 Myr-old population whose stars formed instantaneously, and one in which they formed over a period of 50 Myr.
4.4 The red core
All three components we have so far discussed are too blue to explain the red color at the center of 3C 256, which is also associated with a change in the galaxy’s morphology. We therefore need to address the possibility of a fourth component.
The red central color and strong -band peak can be simply explained by a compact red component superimposed on a spatially flat blue continuum. If we assume that the spatial color variations in this blue continuum are small (supported by the similarities between the F336W and F555W HST images), we can estimate the flux of the putative core component by scaling the image to match the extended flux in the image and subtracting it. The residual source has a flux of Jy, and is slightly resolved compared to the point spread function of a star in the image. The core cannot therefore be due to a lightly reddened quasar nucleus, as has been seen in other 3C radio galaxies (Simpson, Rawlings, & Lacy 1999, and references therein; see §5.3 for the implications of this result), and is presumably stellar in origin.
The core could either be intrinsically red, and dominated by old stars, or be reddened by dust. The presence of dust is suggested by the Ly morphology, which has a brightness minimum at the location of the core. Rest-frame ultraviolet continuum images of other distant radio galaxies show similar morphologies, and Dickinson, Dey, & Spinrad (1995) have argued that the host galaxy of the radio source 3C 324 must suffer substantial reddening () for it not to be seen in their WFPC2 image. On the other hand, if the companion object is associated with 3C 256, its red colors support an intrinsically red stellar population. This source is redder than 3C 256 by mag in and more than 1.2 mag in (after correcting for the presence of emission lines in the radio galaxy).
We somewhat arbitrarily prefer the dust-lane model to explain the red color of the central regions of 3C 256. In attempting to model the SED, we assume that the underlying population has the same age as the blue population of the previous section. Since the observed morphology of 3C 256 indicates that this red component does not contribute significant flux shortward of the -band, its nature and spectral shape have little impact on our determination of the strengths of the other components.
4.5 The four component model
Since we have been able to infer a substantial amount of information about the various components already, it is not difficult to find the four-component model which provides the best fit to the observations. The difficulty in objectively weighting the spectroscopic and photometric data forces us to determine the best fit by eye. However, we have also performed a grid search to minimize the quality-of-fit statistic between the broad-band photometry and the model, and confirmed that this was not significantly better than our adopted fit. The characteristics of this fit are summarized in Table 3, and the fit is shown graphically in Fig. 9.
We determine a mass of for the UV-bright stellar component. This either requires a peak SFR of yr-1 for exponentially declining star formation, or a constant SFR of yr-1 for a period of Myr. Although high, we note for comparison that Dey et al. (1997) estimate that the SFR could be as high as yr-1 in the radio galaxy 4C 41.17.
4.6 The three component model
Although we argued above for a fourth component to explain the red core, we investigate whether a reddened, centrally-peaked, young stellar population can explain the structure of 3C 256. The dust responsible for this reddening would need to have an extinction law which is steep in the far UV (1200–1600 Å) and devoid of a 2200 Å bump. This rules out a Galactic extinction law, since the strength of the bump correlates with the steepness of the law in the far UV (Cardelli et al. 1989). We therefore consider the extinction law of the Small Magellanic Cloud (SMC) and adopt the parametrized SMC extinction law of Pei (1992).
The UV rollover and power law can be reproduced with an power law seen through mag of extinction. The intrinsically bluer color obviously requires a younger stellar population than determined in the previous section, and Fig. 8 indicates that foreground reddening also lowers the age of the stellar population needed to fit the color to Myr. This scenario obviates the need for a fourth component to explain the red core, since the color of the reddened stars is , consistent with that observed in the central regions of the galaxy.
We find the best-fitting three-component model, again adopting a by-eye fit and confirming that it is not significantly worse than a -minimization fit to the broad-band photometry. The results of this fit are presented in Table 3 and Fig. 10. Our present data do not favor either model over the other, although it is hoped that HST imaging and polarimetry will enable more detailed modeling and a conclusion to be drawn. However, since both models require a substantial young stellar population, our conclusion that one is present in 3C 256 is not dependent on which is correct, but rather on the accuracy of our H flux measurement and the observed UV rollover.
5 Discussion
5.1 The alignment effect in 3C 256
In both of our models, half of the observed -band light arises from either scattered light or nebular continuum. In schemes which attempt to unify extragalactic radio sources, both of these should both be aligned with the radio source, since the rest-frame ultraviolet radiation escapes in two oppositely-directed cones along the radio axis. We have observational evidence to support this, since both the polarized continuum (which traces the scattered quasar light) and the line emission (which traces the nebular continuum) are extended along the radio axis. The optical-radio alignment seen in 3C 256 is therefore naturally explained. Although the fraction of the total light at produced by the scattered and nebular emission is lower, at 35%, it is still high enough to produce a pronounced near-infrared alignment effect, due to the absence of a strong, unaligned red component such as an evolved stellar population.
While the aligned optical light is provided in approximately equal amounts by the nebular continuum and scattered light, the latter component produces the majority of the aligned -band light. In fact, the scattered quasar light provides a larger fraction of the total light at than at , and therefore the fractional -band polarization should be larger, if the intrinsic polarization of the scattered light remains constant. Simply scaling by the fractional contributions from the scattered component, we predict that the -band polarization should be about 16% (in a 4″ aperture), although the exact value is somewhat dependent on the specific geometry.
Even without the scattered emission, the nebular emission could produce a strong optical alignment by itself: it would contribute over 40% of the total -band flux in the absence of the scattered light. This alignment should be most pronounced at an observed wavelength of µm, where the Balmer continuum is strongest. Unfortunately, our 8800 Å image has insufficient signal-to-noise to make a quantitative statement about the alignment strength, but it should be possible to confirm spectroscopically the importance of nebular emission in 3C 256. Blanketing from high-order Balmer lines causes the effective wavelength of the Balmer jump from the young stellar population to be longer than the Balmer limit at 3646 Å. As both Figs 9 and 10 show, this results in a deep (the observed equivalent width is Å), broad absorption feature around 3700 Å, which should be detectable with moderate-resolution spectroscopy () even at a fairly low signal-to-noise ratio.
What then of the jet-induced star formation scenario? On a cursory inspection, this appeared quite favorable for 3C 256, due to the similar extents of the radio and optical emission, and the near-infrared alignment. However, the age of the stellar population, at 100–200 Myr is older than any plausible estimate for the age of the radio source, as we now demonstrate.
The separation of the radio lobes is 43, which means that the hotspots have propagated an average distance of kpc, where is the angle between the radio axis and the line of sight. This angle is likely to be large because no radio core is seen in D96’s radio map with a limit ( is the ratio of core to extended radio luminosity at GHz; we use D96’s spectral indices for the lobes and assume a flat core spectrum to determine the -corrections). This is much lower than typical values of (e.g., Morganti et al. 1997; Simpson 1998), ruling out the Doppler boosting which occurs when the radio axis is close to the line of sight (e.g., Orr & Browne 1982). Estimates of the hotspot advance speed in powerful radio galaxies are typically –0.15 (Liu, Pooley, & Riley 1992; Scheuer 1995), although the speed may be in young sources still within their host galaxies (e.g., Fanti & Fanti 1994). A realistic age for the radio source is therefore
which is about two orders of magnitude lower than the age we have determined for the stellar population.
Of course, the ‘age’ of the stellar population is, in fact, merely a measure of the location of the main sequence turnoff, which the UV rollover and Balmer jump strength constrain to be late B/early A-type. The true age could therefore be much shorter if the IMF is biased against high-mass stars. Such a suggestion is, however, counter to claims made on theoretical grounds that the IMF should be biased against low-mass stars (Larson 1977). In addition, the spectrum of 4C 41.17, the most convincing case for jet-induced star formation, clearly shows features associated with hot, young stars (Dey et al. 1997) which are strong enough to have been detectable in our spectrum. The discrepancy in the ages of the stellar population and the radio source therefore demands that the trigger for the most recent episode of star formation must have come from elsewhere. It can be shown, following Scheuer & Williams (1968), that 100 Myr is sufficient time for relic lobes to have dissipated through synchrotron losses, thereby allowing the possibility of multiple episodes of radio source activity (e.g., Roettiger et al. 1994). On the other hand, Daly (1990,1992b) has shown that galactic rotation will disrupt any radio–optical alignment over such a timescale, and so this scenario appears unlikely.
One question we have not answered is whether the young stellar population in 3C 256 is aligned with the radio source. This is impossible to determine with images of different depths and resolutions, especially when the contribution from the aligned components is %, even in the least-affected (J) band. Also, the presence of a dust lane perpendicular to the radio source, as we have postulated might be the cause of the red core, would produce an alignment even when the underlying population is not aligned. Multicolor images at resolution might help us to disentangle the structures of the various components and address this question.
5.2 The stellar mass of 3C 256
The fact that 3C 256 is underluminous in the – diagram (it is more than a magnitude fainter than the locus of other 3C radio galaxies; e.g., Eales et al. 1997) has been used to infer a protogalactic nature for the source, where it has yet to form the bulk of its eventual stellar mass. Our analysis lends further weight to this picture.
Best, Longair, & Röttgering (1998) find that the optical–infrared SEDs of 3CR radio galaxies can be fairly well-modeled by a flat-spectrum aligned component and an old stellar population which provides nearly all of the -band light. On the other hand, about 30% of the -band light in 3C 256 is non-stellar, and at least half of the remainder originates from young stars whose mass-to-light ratio is much lower than that of more evolved populations. Although we cannot rule out the presence of an additional stellar component which is so heavily reddened as to contribute very little flux, there is no evidence to support its existence in 3C 256, or its absence in other radio galaxies. It therefore appears that the stellar mass of 3C 256 is less than that of similar radio galaxies by a factor of a few.
We attempt to quantify this by calculating the stellar mass of our model SED, and comparing it with the masses derived by Best et al. (1998). Since these authors also used the Bruzual & Charlot spectral synthesis code, there will be no systematic differences introduced. For the four-component model, the mass of the young, blue stellar component is fairly well-determined (), but the same is not true for the red component which is responsible for the near-infrared core. We modeled it earlier as a reddened version of the same young stellar population, and derived a similar mass as for the unreddened component, but this mass depends on the extinction, which is poorly constrained. In addition, the lack of spectral information means that it could instead be a population of older stars, with a higher mass-to-light ratio. The best-fitting unreddened “old” population is 1–1.5 Gyr old and has a mass of –, slightly dependent on the duration over which the star formation took place. The total stellar mass is therefore very similar for both models of the red component. For the three-component model, the mass of the single stellar component is .
These are lower limits to the total stellar mass for each model, since there may be additional starlight, either heavily reddened or from an old stellar population, which contributes very little visible light. For a short burst of star formation at , a mass of is required to produce 1 Jy of (observed-frame) -band light. This mass increases by 70% for every magnitude of foreground visual extinction. On balance we doubt that the total stellar mass is likely to be greater than , much less than the which is the median stellar mass for the lower-redshift 3C sample of Best et al. (1998; we modify their results to account for the difference in our adopted cosmologies), and more than a factor of two lower than any of their estimates.
Although our uncertainty as to the nature of the red core means we cannot confirm the putative protogalactic nature of 3C 256, the low inferred stellar mass compared to other radio galaxies does suggest that it is not yet mature. Since the observed polarization requires a substantial mass of gas (Jannuzi et al. 1995; D96), and even the gas mass needed to produce the observed line emission is large ( for cm-3), it is quite conceivable that 3C 256 could undergo further bursts of star formation. Alternatively, it could acquire more mass through mergers. The companion object may be a galaxy which is in the early stages of a merger with 3C 256. Although spectroscopic confirmation that the companion is at the same redshift as 3C 256 may not be feasible (it has ), the red optical–infrared colors () suggest the presence of a spectral break around 1 µm, supporting a similar redshift. It is worth noting that the near-infrared colors of the companion are very similar to those of the red core (see Fig. 9), and may therefore be a coeval stellar population, if the red core is old, rather than reddened.
5.3 Implications for unification scenarios
We briefly discuss what implications the absence of an unresolved near-infrared core has for unification schemes. The two quasars in the 3CR-based catalogue of Laing, Riley & Longair (1983) with redshifts closest to 3C 256 both have . Assuming that 3C 256 would be similarly bright if its quasar nucleus were seen directly, a power law spectrum with extended into the near-infrared implies a -band flux of 0.6 mJy for the nucleus alone. We therefore require mag of rest-frame extinction to produce a core with a flux below 1 Jy. Most radio galaxies have nuclear obscurations in excess of 15 mag (Simpson et al. 1999), and therefore the extinction required to hide the quasar nucleus from direct view at is not unreasonably large.
In both of our models, approximately one-fifth of the rest-frame UV light is non-stellar radiation scattered into our line of sight. We should therefore expect to see broad lines whose equivalent widths are one-fifth of their intrinsic values. The limits we determined in §4.1 are consistent with this fraction, even if the intrinsic equivalent widths are significantly higher than the average values for radio-loud quasars. A normal quasar-like central engine is therefore not ruled out by their absence.
6 Summary
We have modeled the spectral energy distribution of the radio galaxy 3C 256. Although the overall SED is consistent with a single power law, a clear break appears at Å after subtraction of nebular continuum emission which is constrained by our infrared spectroscopy. Although no stellar absorption lines are seen in our spectrum, this break indicates that starlight is a major contributor to the overall SED. Our model includes starlight, nebular continuum emission, and scattered AGN light, and provides a good fit to the data. The dominant stellar population has an age of 100–200 Myr, and was formed in a fairly short burst with a peak star formation rate of yr-1.
In our model, the alignment effect seen in 3C 256 is due to a combination of nebular emission and scattered light, with the latter dominating at longer wavelengths. The pronounced near-infrared alignment is due to the absence of a bright evolved stellar population. Simple arguments based on size show that the radio source must be younger than 100 Myr and therefore is unlikely to have influenced the most recent burst of star formation. We predict that 3C 256 should have substantial near-infrared polarization, estimating a value of about 16% in the -band. We also expect it to show a strong absorption feature (the observed-frame equivalent width is 140 Å in our model) comprised of the Balmer edge at 3646 Å in emission, and blanketing from high order Balmer lines in the young stellar population.
We have estimated the total stellar mass of 3C 256 to be no more than , rather lower than estimates for other 3C radio galaxies. Arguments based on the polarization properties suggest that there is a large mass of gas associated with 3C 256, and therefore further major bursts of star formation are possible.
The specific case of 3C 256 presented here indicates the complex nature of powerful radio galaxies and the importance of obtaining data spanning as large a wavelength baseline as possible. In a future paper, we shall present the results of HST imaging polarimetry in the F555W filter, which should help us to understand more about this interesting source.
References
- (1)
- (2) Aller, L. 1987, Astrophys. Space Sci. Library Vol. 112: Physics of Thermal Gaseous Nebulae. Dordrecht, Reidel
- (3)
- (4) Baker, J. C., & Hunstead, R. W. 1995, ApJ, 452, L95
- (5)
- (6) Begelman, M. C., & Cioffi, D. F. 1989, ApJ, 345, L21
- (7)
- (8) Best, P. N., Longair, M. S., & Röttgering, H. J. A. 1998, MNRAS, 295, 549
- (9)
- (10) Bruzual A., G., & Charlot, S. 1993, ApJ, 405, 538
- (11)
- (12) Bruzual A., G., & Charlot, S. 1999, in preparation
- (13)
- (14) Calzetti, D. 1997, in AIP Conference Proceedings 408: The Ultraviolet Universe at Low and High Redshift, ed. W. H. Waller et al. (New York: Woodbury), 403
- (15)
- (16) Cardelli, J. A., Clayton, G. C., & Mathis, J. S. 1989, ApJ, 345, 245
- (17)
- (18) Casali, M. M., & Hawarden, T. G. 1992, JCMT–UKIRT Newsletter No. 3, p. 33
- (19)
- (20) Chambers, K. C., Miley, G. K., & van Breugel, W. 1987, Nature, 329, 604
- (21)
- (22) Chokshi, A., & Eisenhardt, P. R. M. 1991, Comm. Astrophys., 15, 343
- (23)
- (24) Christian, C., Adams, M., Barnes, J. V., Butcher, H., Hayes, D. S., Mould, J. R., & Siegel, M. 1985, PASP, 97, 363
- (25)
- (26) Daly, R. A. 1990, ApJ, 355, 416
- (27)
- (28) Daly, R. A. 1992a, ApJ, 386, L9
- (29)
- (30) Daly, R. A. 1992b, ApJ, 389, 426
- (31)
- (32) Dey, A., Cimatti, A., van Breugel, W., Antonucci, R., & Spinrad, H. 1996, ApJ, 465, 157 (D96)
- (33)
- (34) Dey, A., van Breugel, W., Vacca, W. D., & Antonucci, R. 1997, ApJ, 490, 698
- (35)
- (36) De Young, D. S. 1989, ApJ, 342, L59
- (37)
- (38) Dickinson, M., Dey, A., & Spinrad, H. 1995, in Galaxies in the Young Universe, ed. H. Hippelein, B. K. Meisenheimer, & H.-J. Röser (Berlin/Heidelberg: Springer-Verlag)
- (39)
- (40) Dickson, R., Tadhunter, C., Shaw, M., Clark, N., & Morganti, R. 1995, MNRAS, 273, L29
- (41)
- (42) di Serego Alighieri, S., Fosbury R. A. E., Quinn P. J., & Tadhunter C. N. 1989, Nature, 341, 307
- (43)
- (44) Dunlop, J. S., & Peacock, J. A. 1993, MNRAS, 263, 936
- (45)
- (46) Eales, S., Rawlings, S., Law-Green, D., Cotter, G., & Lacy, M. 1997, MNRAS, 291, 593
- (47)
- (48) Eisenhardt, P., & Dickinson, M. 1992, in Proc. 3rd Teton Summer School on Astrophysics, The Evolution of Galaxies and Their Environment, ed. D. Hollenbach, H. Thronson, & J. Shull, NASA CP-3190, 29
- (49)
- (50) Elias, J. H., Frogel, J. A., Matthews, K., & Neugebauer, G. 1982, AJ, 87, 1029
- (51)
- (52) Elston, R. J. 1988, Ph.D. thesis, Univ. of Arizona
- (53)
- (54) Fabian, A. C. 1989, MNRAS, 238, 41p
- (55)
- (56) Fanelli, M. N., O’Connell, R. W., Bursetin, D., & Wu, C.-C. 1992, ApJS, 82, 197
- (57)
- (58) Fanti, C., & Fanti, R. 1994, in ASP 54: The Physics of AGN, ed. G. V. Bicknell, M. A. Dopita, & P. J. Quinn (San Francisco: ASP), 341
- (59)
- (60) Ferland, G. J., & Osterbrock, D. E. 1985, ApJ, 289, 105
- (61)
- (62) Jannuzi, B. T., Elston, R., Schmidt, G. D., Smith, P. S., & Stockman, H. S. 1995, ApJ, 454, L111
- (63)
- (64) Jannuzi, B. T., Elston, R., Simpson, C., Eisenhardt, P., Dickinson, M., Djorgovski, S. G., & McCarthy, P. J. 1999, in preparation
- (65)
- (66) Jarrett, T. H., Beichman, C. A., van Buren, D., Gautier, N., Jorquera, C., & Bruce, C. 1994, ExA, 3, 133
- (67)
- (68) Kartje, J. F. 1995, ApJ, 452, 565
- (69)
- (70) Kriss, G. A. 1994, in ASP 61: ADASS III, ed. D. R. Crabtree, R. J. Hanisch, & J. Barnes (San Francisco: ASP), 437
- (71)
- (72) Laing, R. A., Riley, J. M., & Longair, M. S. 1983, MNRAS, 204, 151
- (73)
- (74) Larson, R. B. 1977, in The Evolution of Galaxies and Stellar Populations, ed. B. M. Tinsley, & R. B. Larson (New Haven: Yale Observatory), 97
- (75)
- (76) Le Fèvre, O., Hammer, F., Nottale, L., Mazure, A., & Christian, C., 1988, ApJ, 324, L1
- (77)
- (78) Liu, R., Pooley, G. G., & Riley, J. M. 1992, MNRAS, 257, 545
- (79)
- (80) McCarthy, P. J., Elston, R., & Eisenhardt, P. 1992, ApJ, 387, L29
- (81)
- (82) McCarthy, P. J., van Breugel, W. J. M., Spinrad, H., & Djorgovski, S. G. 1987, ApJ, 321, L29
- (83)
- (84) Manzini, A., & di Serego Alighieri, S. 1996, A&A, 311, 79
- (85)
- (86) Massey, P., & Gronwall, C. 1990, ApJ, 358, 344
- (87)
- (88) Matthews, K., & Soifer, B. T. 1994, in Infrared Astronomy with Arrays: The Next Generation, ed. I. McLean (Dordrecht: Kluwer), 239
- (89)
- (90) Morganti, R., Oosterloo, T. A., Reynolds, J. E., Tadhunter, C. N., & Migenes, V. 1997, MNRAS, 284, 541
- (91)
- (92) Oke, J. B., & Gunn, J. E. 1982, PASP, 94, 586
- (93)
- (94) Orr, M. J. L., & Browne, I. W. A. 1982, MNRAS, 200, 1067
- (95)
- (96) Osterbrock, D. E. 1989, Astrophysics of Gaseous Nebulae and Active Galactic Nuclei (Mill Valley: University Science Books)
- (97)
- (98) Pei, Y. C. 1992, ApJ, 395, 130
- (99)
- (100) Persson, S. E., Murphy, D. C., Krzeminski, W., Roth, M., & Rieke, M. J. 1998, AJ, 116, 2475
- (101)
- (102) Rees, M. J. 1989, MNRAS, 239, 1p
- (103)
- (104) Rigler, M. A., Lilly, S. J., Stockton, A., Hammer, F., & Le Fèvre, O. 1992, ApJ, 385, 65
- (105)
- (106) Roettiger, K., Burns, J. O., Clarke, D. A., & Christiansen, W. A. 1994, ApJ, 421, L23
- (107)
- (108) Salpeter, E. E. 1955, ApJ, 121, 161
- (109)
- (110) Scheuer, P. A. G. 1995, MNRAS, 277, 331
- (111)
- (112) Scheuer, P. A. G., & Williams, P. J. S. 1968, ARA&A, 6, 321
- (113)
- (114) Simpson, C. 1998, A&A, 338, L47
- (115)
- (116) Simpson, C., Rawlings, S., & Lacy, M. 1999, MNRAS, accepted
- (117)
- (118) Spinrad, H., & Djorgovski, S. 1984, ApJ, 285, L49
- (119)
- (120) Spinrad, H., Filippenko, A. V., Wyckoff, S., Stocke, J. T., Wagner, R. M., & Lawrie, D. G. 1985, ApJ, 299, L7
- (121)
- (122) Steidel, C. C., & Sargent, W. L. W. 1991, ApJ, 382, 433
- (123)
- (124) Tadhunter, C. N., Fosbury, R. A. E., & Quinn, P. J. 1989, MNRAS, 240, 225
- (125)
- (126) Voit, M., et al. 1997, HST Data Handbook, Version 3.0, Vol. I
- (127)
- (128) Willott, C. J., Rawlings, S., Blundell, K. M., & Lacy, M. 1998, in Observational Cosmology with the New Radio Surveys, ed. M. N. Bremer et al. (Dordrecht: Kluwer), 209
- (129)


| Filter | Telescope | DateaaImages whose dates are listed as “SD84” were presented in Spinrad & Djorgovski (1984), and those listed as “L88” were used in Le Fèvre et al. (1988). | Exposure (s) | SeeingbbThe seeing is measured from the FWHM of stars in the images. | Flux (Jy) | Line contamination (Jy)ccThe estimated contamination to the broad-band flux from emission lines in the 4″ photometric aperture is listed. The observed fluxes listed in the previous column have not been corrected for line contamination. | |
|---|---|---|---|---|---|---|---|
| Mayall | SD84 | 13 | 1.2 | (Si IV, C IV, He II, O III]) | |||
| Hale | 1997 Jun 3 | 10 | 0.6 | (C III]) | |||
| Mayall | SD84 | 12 | 0.6 | (C III]) | |||
| Mayall | SD84 | 15 | 0.5 | (C II], [Ne IV]) | |||
| CFHT | L88 | 07 | 0.6 | (C II], [Ne IV]) | |||
| CFHT | L88 | 09 | 0.6 | (Mg II) | |||
| 8800 | Mayall | 1992 May 1 | 11 | 0.0 | |||
| Mayall | 1992 Mar 20 | 08 | 0.1 | (H) | |||
| Keck I | 1998 Jan 18 | 06 | 2.6ddThe line contribution is strongly dependent on the atmospheric transmission at 1.4 µm at the time of the observation, and is thus very uncertain. | ([O III]) | |||
| Hale | 1998 Mar 25 | 15 | 1.1 | ([O I]) | |||
| Mayall | 1989–1992 | 09 | 0.0 | ||||
| Keck I | 1994 Apr 5 | 08 | 0.0 | ||||
| Line | ( W m-2) | EW (Å) | |||||
| Optical fluxes ( aperture) | |||||||
| Ly | 542 | 7 | 501 | ||||
| N V 1240 | 14 | 9 | 13 | .1 | |||
| C II 1335 | 6 | .2 | 0 | .9 | 7 | .0 | |
| Si IV 1400 | 21 | .5 | 1 | .9 | 23 | .7 | |
| C IV 1549 | 52 | .3 | 0 | .8 | 38 | .5 | 1.1 |
| He II 1640 | 54 | .7 | 0 | .5 | 43 | .7 | |
| O III] 1663 | 14 | .6 | 1 | .1 | 11 | .0 | |
| C III] 1909 | 42 | .8 | 3 | .3 | 27 | .3 | |
| C II] 2326 | 20 | .3 | 0 | .6 | 24 | .1 | 1.0 |
| [Ne IV] 2423 | 21 | .2 | 0 | .6 | 26 | .1 | |
| [O II] 2470 | 6 | .7 | 0 | .8 | 8 | .4 | |
| Mg II 2798 | 37 | .7 | 2 | .1 | 52 | .7 | |
| Infrared fluxes ( aperture) | |||||||
| [O II] 3726,3729 | 154 | 44 | 769 | ||||
| [Ne III] 3869 | 54 | .7 | 25 | .3 | 273 | ||
| H | 40 | .7 | 12 | .6 | 156 | ||
| [O III] 4959,5007 | 898 | 40 | 3440 | ||||
| Component | (Jy) | (%) | (Jy) | (%) | |
|---|---|---|---|---|---|
| Four-component model | |||||
| Nebular continuum | 1. | 8 | 35% | 2.1 | 12% |
| Scattered quasar | 0. | 9 | 17% | 4.0 | 23% |
| Blue stellar popaaA 180 Myr-old population of mass | 2. | 5 | 48% | 8.6 | 49% |
| Red stellar popbbA 180 Myr-old population of mass , reddened by mag | . | 01 | % | 2.8 | 16% |
| Three-component model | |||||
| Nebular continuum | 1. | 8 | 35% | 2.1 | 12% |
| Scattered quasar | 0. | 8 | 15% | 3.5 | 20% |
| Stellar populationccA 130 Myr-old population of mass , reddened by mag | 2. | 6 | 50% | 11.7 | 68% |