6(8.15.1; 8.22.1; 8.22.3; 11.09.1 IC 1613; 11.12.1; 11.19.5)
\offprintsE. Antonello
11institutetext: Osservatorio Astronomico di Brera, Via E. Bianchi 46,
I–23807 Merate, Italy
(elio,luciano,fugazza,bossi,covino@merate.mi.astro.it)
Variable stars in nearby galaxies.††thanks: Based on observations collected at ESO-La Silla
Abstract
The first results are presented of a four-year program dedicated to the CCD observations of Cepheids in the nearby galaxy IC 1613. The goal was to obtain good light curves for Fourier decomposition and to detect shorter period Cepheids. Since the program was carried out with a relatively small telescope, the Dutch 0.9 m at ESO-La Silla, the observations were performed without filter (white light), or –band; the advantage of this technique is that the photon statistics correspond to that of -band observations made with larger telescopes than 2 m and similar exposure time. The effective wavelength of the -band is intermediate between that of and bands for stars of A-G spectral type, for back-illuminated CCD detectors, therefore the photometric characteristics of variable stars (e.g. amplitudes) are generally analogous to those obtained with the standard technique.
Field A in IC 1613 has size 3\farcm8x3\farcm8. A total of 67 images were obtained and the reduction was performed with DAOPHOT. More than 2900 stars were measured, and for about 1700 stars there are from 67 to 24 data points. Indications on the color of 739 bright stars were obtained also from and additional data. The analysis revealed the presence of about 110 variable stars. The detected population I Cepheids are 43; 9 Cepheids were already known from previous works, while most of the new stars have a short period . We remark the following results: a) for stars with d and sufficient phase coverage it is possible to perform good Fourier decomposition with resulting standard deviation of the fit of 0.02 - 0.04 mag; b) there are several Cepheids with relatively small amplitude, and most of them are (probable) first overtone mode pulsators; c) the faintest detected Cepheids have m. No double-mode Cepheid has been found, probably because the precision and sampling of the data are not sufficient for the detection. Furthermore, at least 5 population II Cepheids and at least 8 eclipsing binaries have been observed. The other variable stars are probable long period, semiregular and irregular variables.
A comparison with results of other massive CCD photometric projects dedicated to the detection of variable stars shows some advantages of the observations in white light for fully exploiting the capabilities of relatively small telescopes. A suggestion is made on how to use these results for distance determinations.
keywords:
Stars: oscillations – Cepheids – Stars: variables: general – Galaxies: individual: IC 1613 – Local Group – Galaxies: stellar content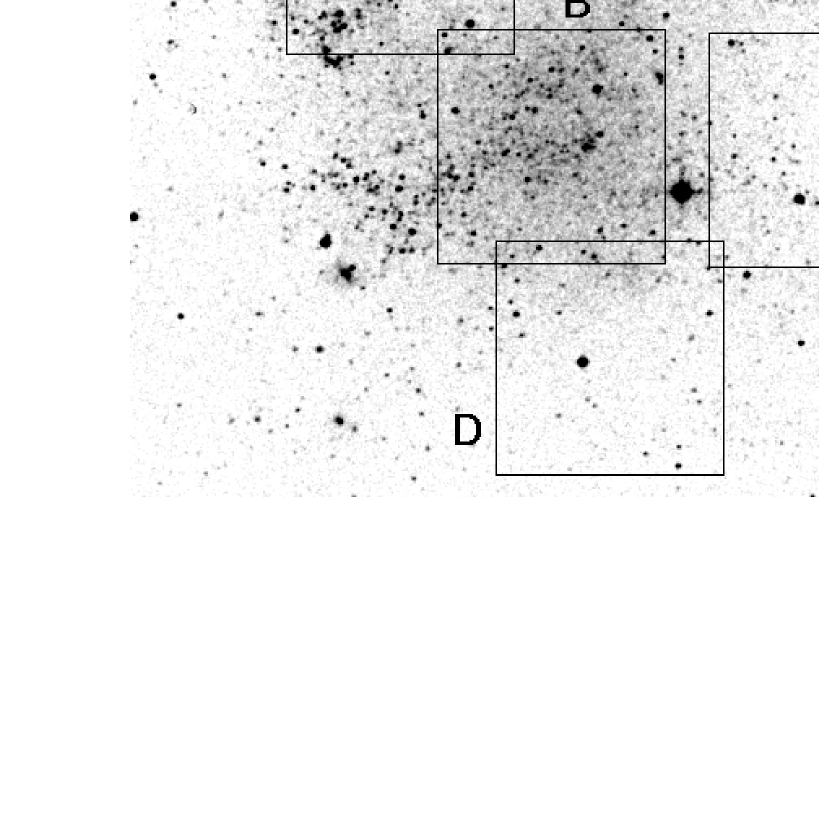
| date | Hel.J.D. | Airmass | FWHM | N | date | Hel.J.D. | Airmass | FWHM | N | ||
|---|---|---|---|---|---|---|---|---|---|---|---|
| 2450000.+ | (”) | 2450000.+ | (”) | ||||||||
| 1 | 1995 oct 20 | 11.69 | 1.18 | 1.5 | 2162 | 34 | 1997 oct 27 | 749.67 | 1.19 | 1.6 | 1685 |
| 2 | 1995 oct 21 | 12.75 | 1.37 | 1.7 | 1372 | 35 | 1997 oct 28 | 750.61 | 1.19 | 1.5 | 1806 |
| 3 | 1995 oct 22 | 13.74 | 1.35 | 1.5 | 1709 | 36 | 750.71 | 1.36 | 1.8 | 1589 | |
| 4 | 1995 oct 23 | 14.59 | 1.27 | 1.6 | 1930 | 37 | 1997 oct 29 | 751.60 | 1.20 | 1.8 | 1252 |
| 5 | 1995 oct 25 | 16.62 | 1.19 | 1.4 | 2105 | 38 | 751.70 | 1.29 | 2.0 | 1324 | |
| 6 | 1995 oct 26 | 17.62 | 1.19 | 1.7 | 1870 | 39 | 1997 oct 30 | 752.61 | 1.19 | 1.6 | 1941 |
| 7 | 1996 aug 06 | 302.87 | 1.18 | 1.8 | 1217 | 40 | 752.70 | 1.29 | 1.8 | 1340 | |
| 302.89 | 1.18 | 1.6 | 687 | 41 | 1997 oct 31 | 753.60 | 1.19 | 1.7 | 1303 | ||
| 302.91 | 1.22 | 1.6 | 827 | 42 | 753.63 | 1.18 | 1.4 | 1814 | |||
| 8 | 1996 aug 08 | 304.79 | 1.25 | 1.9 | 1179 | 43 | 753.72 | 1.40 | 1.6 | 1724 | |
| 9 | 304.80 | 1.24 | 1.4 | 1930 | 44 | 1997 nov 01 | 754.61 | 1.18 | 2.5 | 829 | |
| 10 | 1996 aug 09 | 305.80 | 1.23 | 1.5 | 1214 | 45 | 754.71 | 1.33 | 2.1 | 1127 | |
| 11 | 1996 aug 10 | 306.82 | 1.18 | 1.6 | 1428 | 46 | 1998 jul 25 | 1020.90 | 1.17 | 1.7 | 1593 |
| 12 | 1996 aug 11 | 307.77 | 1.29 | 2.4 | 748 | 47 | 1998 jul 26 | 1021.89 | 1.17 | 1.5 | 1451 |
| 13 | 307.91 | 1.30 | 2.0 | 1465 | 48 | 1998 jul 30 | 1025.89 | 1.17 | 2.1 | 1139 | |
| 14 | 1996 aug 12 | 308.86 | 1.20 | 1.9 | 1246 | 49 | 1998 jul 31 | 1026.89 | 1.17 | 1.5 | 1812 |
| 15 | 1996 aug 13 | 309.83 | 1.17 | 2.2 | 1082 | 50 | 1998 sep 30 | 1087.71 | 1.17 | 1.4 | 1638 |
| 16 | 1996 oct 14 | 370.57 | 1.52 | 1.5 | 1247 | 51 | 1998 oct 01 | 1088.74 | 1.19 | 1.6 | 1781 |
| 17 | 370.71 | 1.19 | 1.6 | 1355 | 52 | 1998 oct 02 | 1089.73 | 1.19 | 1.6 | 1487 | |
| 18 | 1996 oct 15 | 371.59 | 1.39 | 1.6 | 1469 | 53 | 1998 oct 08 | 1095.67 | 1.17 | 1.6 | 822 |
| 19 | 371.72 | 1.27 | 1.3 | 1784 | 54 | 1998 oct 09 | 1096.71 | 1.18 | 1.6 | 1535 | |
| 20 | 1996 oct 16 | 372.70 | 1.18 | 1.3 | 2068 | 55 | 1998 oct 10 | 1097.67 | 1.18 | 1.5 | 1564 |
| 21 | 1996 oct 17 | 373.61 | 1.26 | 1.3 | 1826 | 56 | 1097.77 | 1.33 | 1.6 | 1948 | |
| 22 | 373.75 | 1.34 | 1.4 | 1001 | 57 | 1998 oct 11 | 1098.64 | 1.21 | 1.7 | 1718 | |
| 23 | 1996 oct 18 | 374.57 | 1.49 | 1.5 | 1444 | 58 | 1098.74 | 1.25 | 1.5 | 1480 | |
| 24 | 374.69 | 1.18 | 1.2 | 2307 | 59 | 1998 oct 13 | 1100.67 | 1.17 | 1.5 | 1453 | |
| 25 | 1996 oct 19 | 375.61 | 1.25 | 1.2 | 1461 | 60 | 1100.77 | 1.37 | 1.8 | 1547 | |
| 26 | 375.75 | 1.33 | 1.2 | 2753 | 61 | 1998 oct 14 | 1101.74 | 1.27 | 2.2 | 1458 | |
| 27 | 1996 oct 20 | 376.62 | 1.23 | 1.6 | 1496 | 62 | 1998 oct 15 | 1102.59 | 1.34 | 1.6 | 1511 |
| 28 | 376.75 | 1.35 | 1.7 | 1473 | 63 | 1102.69 | 1.18 | 1.6 | 1949 | ||
| 29 | 1996 oct 21 | 377.61 | 1.25 | 1.6 | 1195 | 64 | 1998 oct 16 | 1103.59 | 1.34 | 1.4 | 1776 |
| 30 | 377.74 | 1.31 | 1.7 | 1337 | 65 | 1103.69 | 1.18 | 1.5 | 1400 | ||
| 31 | 1996 oct 22 | 378.60 | 1.26 | 1.5 | 1398 | 66 | 1998 oct 17 | 1104.66 | 1.17 | 1.3 | 2066 |
| 32 | 378.68 | 1.18 | 1.4 | 1400 | 67 | 1998 oct 18 | 1105.67 | 1.17 | 1.3 | 1921 | |
| 33 | 1997 oct 27 | 749.54 | 1.46 | 2.0 | 654 |
1 Introduction
1.1 Motivation
Cepheids are variable stars which are used to measure distances of galaxies in the Local Group and nearby clusters (e.g. Madore et al. [1998]), and are the primary calibrator for the secondary standard candles that are applied at much greater distances (e.g. Jacoby et al. [1992]). However, they are not only fundamental stars as primary distance indicators, but are also an essential tool for testing the theories on the internal constitution of stars and stellar evolution. The importance of double–mode Cepheids for the revision of stellar opacities is well known: after the suggestion of Simon ([1982]), the OPAL (e.g. Iglesias, Rogers & Wilson [1990]) and OP (e.g. Seaton et al. [1994]) projects produced new opacities which allowed to solve the long-standing problem of double-mode Cepheid period ratios (e.g. Moskalik et al. [1992]). These opacities were then generally adopted by theorists working with stellar evolution codes.
There are several problems yet to be solved. The radiative codes used for constructing pulsation models proved to be incapable of agreement with observations when applied to the comparison of Cepheid characteristics in Galaxy and in Magellanic Clouds (e.g. Buchler [1998]). The fact that resonances among the pulsation modes give rise to observable effects on the light curves can be exploited to put constraints on the pulsational models and on the mass-luminosity relations. The best known of these resonances occurs in the fundamental Cepheids between the fundamental and the second overtone mode () in the vicinity of a period d and it is at the origin of the well known Hertzsprung progression of the bump Cepheids (e.g. Simon and Lee [1981]). In the first overtone mode Cepheids another resonance occurs between the first and the fourth pulsation modes (; e.g. Antonello & Poretti [1986]; Antonello, Poretti and Reduzzi [1990]). When these resonances observed in Cepheids of Galaxy and Magellanic Clouds are used to constrain purely radiative models, one obtains stellar masses that are too small to be in agreement with stellar evolution calculations. According to Buchler et al. ([1999]), it has become clear that some form of convective transport and of turbulent dissipation is needed to make progress.
The study of Cepheids in nearby galaxies is of fundamental importance for understanding the effects of different metallicity and corresponding mass–luminosity relations on the pulsational characteristics through the detection of structures in the Fourier parameter - period diagrams of fundamental, first overtone and possibly double–mode (Poretti & Pardo [1997]) and second overtone mode Cepheids (Antonello & Kanbur [1997]; Alcock et al. [1998]), and their comparison with the galactic Cepheids and the model predictions. The CCD differential photometric precision allows to get accurate Fourier parameters of Cepheid light curves, and also to discover several new Cepheids with small amplitude. Massive CCD photometry of nearby galaxies such as NGC 6822 and IC 1613 was attempted several years ago by E. Schmidt and collaborators (Schmidt & Spear [1989]), but apart from a preliminary report, no complete study was published. The MACHO, EROS and OGLE projects dedicated to the detection of microlensing events in the direction of Magellanic Clouds produced enormous amount of data on variable stars in these galaxies (e.g. Welch et al. [1997]; Beaulieu & Sasselov [1997]; Udalski et al. [1999]). More recently, the project DIRECT was dedicated to the massive CCD photometry of M31 (and M33) with the purpose of detecting Cepheid and eclipsing binaries for direct distance determination of these galaxies (e.g. Kaluzny et al. [1999]).
The purpose of our project was to obtain good light curves of Cepheids for extending the comparison of the characteristics of these stars in different galaxies. In order to exploit the telescope time and reach the faintest luminosities, our strategy was to observe in white light, i.e. without filter; the results confirm that in this way the differential photometry precision for the Ducth 0.91 cm telescope at ESO–La Silla is roughly comparable with that obtained with 2 m-class telescopes, Johnson V-filter and similar exposure times.
In the present work we discuss observations and reduction methods, we present the first results concerning population I Cepheids and other variable stars. Subsequent papers will be dedicated to the analysis of population I and II Cepheids, long period and irregular variables and eclipsing binaries.
1.2 IC 1613
The irregular galaxy IC 1613 [ (1950), (1950), l=130\degr, b=–61\degr], was studied by Baade, but his extensive results were never published. Baade found 59 variables in plates taken with the Mount Wilson 60 inch and 100 inch reflectors between 1929 and 1937. Light curves for 24 of the confirmed Cepheids had been completed by him before his death in 1960. These data, reduced to a new photometric scale, were published by Sandage ([1971]), who discussed the apparently anomalous slope of the relation. The cause of this shallower slope than that of Cepheids in other galaxies was interpreted differently by various authors; the reasons for such interest was that if the slope was significantly flatter for IC 1613, then the assumption that a universal relation exists was seriously called into question. Freedman ([1988a]) discussed the case with new CCD data, and noted that, for data fainter than 21 mag, the photographic photometry was significantly brighter than CCD data. This divergence contributed to the difference in the appearance of the relation. Sandage ([1988]) discussed another cause, that is the stochastic effect of small sample statistics for the few longest-period variables. An additional 16 Cepheids were subsequently presented by Carlson & Sandage ([1990]), and the authors remarked the possible large number of short period Cepheids. The conclusion of these studies is that there are no differences in the slope of the relation of Cepheids in IC 1613 with respect to that of other galaxies.
From observations (Freedman, [1988a]), Madore & Freedman ([1991]) derived a total mean reddening of (–)=0.02 mag, and a true distance modulus of 24.420.13 mag, corresponding to a distance of 765 kpc. Madore & Freedman ([1991]) suggest that the best place for work on intrinsic calibration problem of the Cepheid distance scale is not the Magellanic Cloud system but IC 1613, because the foreground reddening to this galaxy is very low and probably quite uniform, the extinction internal to IC 1613 appears to be quite small and the crowding of stellar images are relatively low. Freedman ([1988a]) mentions other points of interest of this galaxy, and the need of better data on its Cepheids. IC 1613 has very low metallicity, less than SMC, and both are important galaxies for calibrating the relation, but the latter has a complicated extended geometry; therefore the former could be even more important in this regard than was once thought. With more and better data, the Cepheids of IC 1613 could provide the low-metallicity anchor point for a calibration of the relation.
| Spectral type | |||
|---|---|---|---|
| B | 543 | 659 | 503 |
| A | 545 | 667 | 548 |
| F | 547 | 671 | 576 |
| G | 548 | 676 | 601 |
2 Observations
The observations were performed with the direct CCD camera attached to the Dutch 0.91m telescope of the La Silla Astronomical Observatory (ESO) during six runs from October 1995 to October 1998. The available CCD detector was the ESO chip No. 33, which is a TEK CCD with 512x512 pixels, pixel size of and spatial resolution of 0\farcs44, providing a field of view of 3\farcm77x3\farcm77. Given the limited size of the field of view, the need to observe not too far from the meridian and at the same time to be able to get two images of the same field in the same night, we were forced to limit our programme to 4 selected fields of IC1613. The fields are displayed in Fig. 1. Most of the observations were performed without filter (white light, hereinafter ) in order to get the best photon statistics for the study of faint Cepheid light curves; few images were taken in Johnson and filter for comparison purposes with other works and to get an indication on the colors of the relatively bright stars. Bias and twilight flat field frames were gathered in each useful night.
In this paper we present the results regarding Field A, which is an interesting field because it contains the largest number of previously known variable stars. During the allocated telescope time the field has been observed for 46 nights and a total of 67 images were collected. The complete log of the observations is reported in Table 1. The table contains, for each image, the date of the beginning of the night, the Heliocentric Julian date of midexposure, the mean FWHM PSF value (which takes into account both seeing and possible non–perfect focussing of the telescope), the airmass, and the number of stars detected in the image, which is an indication of its overall goodness because it depends both on the PSF (point-spread-function) and sky background level. Each , and image is the sum of two or three successive exposures for a total of 1800 sec; only for the image No. 61 the total exposure was shorter (600 sec).
The observations without filter imply the dependence of the resulting photometry on: 1) the adopted instrumentation; b) a color term which is related to the different airmasses. The effective wavelengths of and bands are compared in Table 2 with that of band, for stars with B, A, F and G spectral type observed with the adopted instrumentation, that is optical telescope and back-illuminated CCD-TEK detector. The –band effective wavelength for late-type stars is intermediate between that of and bands. The color-effect due to different airmasses in the present case is negligible (in comparison with the expected photometric precision) since the observations were performed not far from meridian.
3 Data Reduction
Bias subtraction and flat field corrections were performed using IRAF package (Tody 1993). It was necessary to correct the images for the slightly different pointing of the telescope and orientation of the CCD camera in the different runs. Therefore they were shifted and rotated with the ESO/MIDAS command REBIN/ROTATE with respect to the image No. 26, which is one of the best images and which was used as template. For this reason, the stars near the borderline have usually less measurements than those in the central part of the field, and the field actually surveyed is sligthly larger than the nominal one, that is about 3\farcm84x3\farcm84.
3.1 Photometry
The stellar photometry was performed by means of the IRAF/DAOPHOT package (Stetson 1987; Davis 1994). For each image a prelimary list of objects was detected with DAOFIND, and a prelimary aperture photometry was performed with DAOPHOT. In order to evaluate the point-spread-function, a group of stars was selected with PSTSELECT and then checked visually one by one. The point-spread-function model was then iteratively computed with the PSF–command using about 20 stars for each image. Due to the smallness of the field, a constant PSF model consisting of a gaussian plus a single empirical look–up table was adopted. Finally the photometry of all the selected stars was derived by means of ALLSTAR. New stars were then searched in the residual image, added to the previous list, and then ALLSTAR was executed again on this list. This procedure was finally repeated once again. The residual image that we got after the third analysis with ALLSTAR was generally clean, with no evident stellar images; only some residuals near the loci of the brightest stars, HII regions and galaxies were present. The tables containing the lists of the detected stars in each image were cross–correlated in order to look for the objects in common and reject the spurious ones. Two objects in two different images were considered to be the same star if the separation of their centers was less than 1 pixel.
The same reduction procedure was adopted for both and images.

3.2 Calibration
DAOPHOT produced a set of instrumental wh magnitudes for the stars in each frame, which could not be reduced to a standard system. The procedure for deriving a homogeneous magnitude scale was an iterative one, based on the 104 stars detected in all the frames. Let be the magnitude value of the star in the frame , the mean value for the frame , the number of stars, the global mean value and the number of frames. At the first step, the mean values are computed and then a new value is calculated with the formula
| (1) |
At each subsequent step the mean values of the time series are calculated using the new values, excluding from each time series the most deviating point if the deviation is larger than 2.5 from , and replacing this point with the corresponding ; then the new mean values and are recalculated. The final result of this iteration is the correcting term, , applied to each of the original data points. The number of steps is fourteen, however for most of the stars very few iterations are sufficient for obtaining stable mean values.


Since Field A partially overlaps one of the fields observed by Freedman ([1988b]), we used the 158 common stars to tie our and observations to the standard system. We got the color index – for 512 stars from our data; for an additional 227 stars, which were not detected in both and frames but were detected in frames, we adopted the – value given by Freedman ([1988b]).
We selected a sample of stars for constructing a system, useful for the discussion of the photometric results. The calibrating stars were selected according to the following criteria: a) more than 62 observed data points per star, b) stellar nonvariability or low scatter of data points, c) known and data; criteria a) and b) were needed in order to get a sample free of problems related to crowding. The resulting number of stars was 195, which gave the following statistical relations between , and –
| (2) |
| (3) |
with rms residuals of 0.11 and 0.10 mag, respectively. Fig. 2 shows (lower panel) and estimated from eq. 1 (upper panel) against observed , and Fig. 3 shows – against –. We derived the zero-point of the final magnitude scale, from eq. 2 assuming that – when –, that is or
| (4) |
The nonlinearity of eq. 3 depends on the large -bandwidth; – appear to be more sensitive to than – for cooler stars, and less sensitive for hotter stars. We will use occasionally the colour index – when the measurement will not be available; we just note that, as a first approximation, from the linear correlation between – and – we have . Analogously, .
In Fig. 4 we have reported the external error (or standard deviation) for about 1700 stars with at least 24 data points (and ), against the mean value of the star; in the upper panel, the standard deviation was calculated including all the data points, some of which are rather scattered; in the lower panel, the four most deviating points of each star have been excluded. The continuous line is a rough theoretical estimate of the expected external error.

4 Data Analysis
4.1 Star numbers
It is interesting to compare the number of detected stars in band with those in and bands. The total number of stars with at least one measurement is 2927; however, since the field was not exactly the same during all the nights, the detected stars are located in a region of IC1613 which is actually slightly larger than 3\farcm77x3\farcm77. Moreover, the number of detections depend on the seeing conditions and sky background (see Table 1). We have considered therefore the frame taken in the same night of and frames, with similar seeing conditions. The resulting number of detections is 1217 for , 687 for and 827 for . Fig. 5 shows the corresponding distribution.


4.2 Variable stars
Different criteria for the detection of variability were adopted for comparing the capabilities of the various methods, particularly in the difficult cases given by the uncertainties due to crowding problems.
Firstly we used the variability index (Stetson [1996]). For each star the pairs of observations were considered, each with a weight , where indicates the pair of observations . If the time separation between two subsequent observations was less than about three hours hour, they were considered as a pair. When the weight was =1.0, while when , . In this way, longer sequences of closely spaced observations had larger weight than sequences with similar number of observations but largely separated in time. The index was redefined in order to take into account how many times a given star was measured, , where is the total weight a star would have if measured in all the images (see Kaluzny et al. [1998]). As expected (Stetson [1996]), most of the stars have values which are close to zero. The adopted threshold, allowed the selection of 136 candidate variable stars.
For another test for variability we considered 1491 light curves consisting of not less than 34 points, i.e. corresponding to stars which can be identified in the majority of the frames. They were checked for variability by means of two different methods, that is, their variances have been compared with two different noise estimates. At first, the noise component of a light curve was defined as the least variance found among the fainter objects than the examined one: a star was regarded as variable if its light variance, computed without taking the 10% most scattered measurements into account, exceeded 10 times this level. The white noise component of each time series was evaluated also from the root–mean–square difference between closely consecutive data, i.e., in our case, between measurements performed during the same night. When the light variance was inconsistent (i.e. larger than 3) with this noise definition, the object was classified as a variable star. These approaches have to be considered as complementary. The first one is based on no more than a rough estimate of the noise, which doesn’t depend only on the measured magnitude but also, e.g., on the crowding in the image. On the other hand, rapid variations with time scales of some hours may escape detection with the second method. Combining both approaches, more than 250 candidate variable stars were singled out for a further detailed analysis.
Finally, some time was also spent for analyzing the data set on a star-by-star basis. A simple program was developed which computed the variance reduction for the time series, identified the maximum peak in the power spectrum, and showed the changes of peak and variance reduction when taking off progressively the most deviating points from the time series. A good indicator of variability was the stability of the power spectrum peak, even when the variance reduction was not very significant. In this way it was possible to detect variable stars with relatively small amplitude.
From the comparison of the three approaches we got the indication that, for an uneven data sampling as in the present case, the automatic methods should adopt very low threshold levels in order to detect variable stars which have low amplitude/noise ratio: on the one hand, this low threshold level yield also a large number of candidates which turn out to be nonvariable stars, and on the other hand some variable stars were found with the star-by-star analysis below such thresholds.


The uncertainties in the analysis for the detection of variable stars and the determination of their periods are mainly related to the number of bad points (characterized by a large DAOPHOT estimated error) in comparison with the number of good points, and to the significant aliases produced by the data sampling. The bad points are produced essentially by two causes: crowding, which implies a bad identification of the stars related to the variable seeing conditions, and occasional slight deformations of one stellar image which is interpreted by DAOPHOT as two close stars. The average number of bad points which must be discarded for obtaining a reasonable time series is about 2 per star in the case of Cepheids, and the maximum number of discarded points is 6. In general, stars with not less than 24 data points have been considered.
The data sampling is such that often there are significant aliases. Fig. 6 shows the spectral window. As we can see there is a strong alias with a complex structure at 1 c/d, so that if is the true period, we should expect strong aliases at the frequencies and . Usually there are not significant problems for intermediate periods. Often a visual comparison of the data phased with the different altenatives is sufficient to solve the possible ambiguities. On the other hand the aliasing makes it difficult to discriminate between long periods (say d) and periods very close to 1 d ( d), even if it appears more reasonable to expect, at least on a statistical basis, that most of these stars are long period objects. Another relevant ambiguity regards the possible very short period Cepheids ( d), for which, due the generally small amplitudes and therefore the low , it is difficult to judge if the best phasing is for c/d or .


| Baade– | period [d] | type | present | period or |
|---|---|---|---|---|
| Sandage | work | timescale [d] | ||
| SV9 | 5.58 | Cep | V0819 | 5.578 |
| SV10 | 4.065 | Cep | V1897 | 4.065 |
| SV17 | 5.73 | Cep | V1734 | 5.737 |
| SV18 | 16.43 | Cep | V1039 | 16.43 |
| SV21 | Irr | V3106 | ||
| SV22 | 146.3 | Cep | V2396 | (145.6) |
| SV24 | 6.74 | Cep | V1337 | 6.743 |
| SV29 | 2.869 | Cep | V0555 | 2.868 |
| SV32 | Irr | V0089 | ||
| SV36 | 2.444 | Cep | V1756 | 2.445 |
| SV38 | Irr | V0076 | ||
| SV39 | 28.72 | (Cef?) | V1740 | * |
| SV40 | Irr | V1872 | ||
| SV43 | Irr | V2321 | ||
| SV52 | Irr | V1908 | 300? | |
| SV54 | 3.663 | Cep | V2256 | 3.663 |
| SV56 | ? | V1800 | * | |
| *See text |
5 Results
About 110 stars were detected as variables: population I and II Cepheids, eclipsing binaries, long period, semiregular and irregular variables. In Table 3 we have reported the stars discovered by Baade and by Sandage (Sandage [1971]) falling in Field A, their period, variable type, the identification number in the present work and the period obtained by us. All the previously known Cepheids are confirmed; the periods obtained with our data are very similar to the old ones. No attempt has been done for increasing the significant digits of the periods by analysing old and new data together. For the irregular variables we have reported the time scale of variability which is compatible with our data. Some of the stars are discussed in the following subsections; in particular, the unusual characteristics of the star SV39 (V1740) are also confirmed, and they are discussed in Sect. 5.4.
Cepheids, other periodic variables, eclipsing binaries and irregular or semiregular variables are listed in Table 4, 5, 6 and 7, respectively. The stars are identified by their name; the right ascension and declination are given along with the and the mean magnitude (for eclipsing binaries an estimate of at the maximum luminosity is reported). For Cepheids the probable pulsation mode is also reported, while for the irregular, possible long period and semiregular variables (Table 7) the timescale of variability is indicated. The astrometric positions were computed using 11 previously known variable stars as local astrometric standards, to derive transformation equations from the CCD positions to (1950) and (1950). The coordinatae were taken from the General Catalogue of Variable Stars (GCVS; Samus [1995]). Other four stars, SV36 (V1756), SV40 (V1872), SV52 (V1908) and SV43 (V2321), were excluded because the values in GCVS differ by some arcsecs from the results of the transformation equations; this indicates an identification problem. The comparison of the derived positions with those reported by Freedman ([1988b]) shows that the accuracy of the transformation is generally better than about 0\farcs5.
The variable stars with known index are shown in the color-magnitude diagram of Fig. 7.
5.1 Cepheids
The light curves of the detected Cepheids are displayed in Fig. 8 and 9; note that the magnitude scale is not the same in the different panels. Just from a simple inspection it is possible to conclude that both fundamental and first overtone mode Cepheids have been detected; the fundamental mode Cepheids have large amplitude or asymmetric light curves, while first overtone modes have relatively small amplitude and more symmetric light curves. We have used the Fourier parameters and the amplitudes for discriminating the pulsation mode. A detailed discussion of these parameters and comparisons with other galaxies will be reported in Paper II (Antonello et al [1999]). There is no reliable indication of double-mode Cepheids; probably the precision and the sampling of the data are not sufficient for their detection.
The stars with known – occupy a vertical band in the color-magnitude diagram (Fig. 7), or instability strip. The diagram for the -band is briefly discussed in Sect. 6.2 and shown in Fig. 15.
| Name | (1950) | (1950) | P | Wh | Puls. |
|---|---|---|---|---|---|
| [h m s] | [o ’ ”] | [d] | mode | ||
| V0078 | 1 2 26.3 | +1 52 30.5 | 1.435 | 22.15 | F |
| V0107 | 1 2 22.6 | +1 52 33.2 | 6.714 | 20.25 | F |
| V0128 | 1 2 25.9 | +1 52 53.4 | 1.251 | 22.34 | 1-O |
| V0178 | 1 2 22.4 | +1 52 53.8 | 0.817 | 22.40 | … |
| V0236 | 1 2 24.5 | +1 53 19.2 | 1.390 | 22.26 | … |
| V0279 | 1 2 30.5 | +1 53 41.5 | 2.098 | 22.46 | F |
| V0368 | 1 2 27.2 | +1 53 58.1 | 1.479 | 22.05 | 1-O |
| V0377 | 1 2 20.6 | +1 53 57.3 | 1.643 | 22.23 | … |
| V0414 | 1 2 16.8 | +1 54 00.5 | 2.459 | 22.27 | F |
| V0479 | 1 2 27.7 | +1 54 28.8 | 0.663 | 22.35 | … |
| V0524 | 1 2 17.4 | +1 54 36.6 | 1.424 | 22.49 | … |
| V0533 | 1 2 30.6 | +1 54 49.9 | 1.845 | 22.45 | F |
| V0551 | 1 2 26.4 | +1 54 59.1 | 2.690 | 22.28 | … |
| V0555 | 1 2 30.9 | +1 55 00.0 | 2.868 | 21.49 | F |
| V0655 | 1 2 21.7 | +1 55 23.1 | 2.538 | 22.41 | … |
| V0819 | 1 2 21.9 | +1 52 13.7 | 5.578 | 21.06 | F |
| V1014 | 1 2 29.3 | +1 54 18.2 | 2.950 | 21.97 | F |
| V1039 | 1 2 28.5 | +1 54 27.8 | 16.431 | 19.82 | F |
| V1100 | 1 2 26.6 | +1 55 06.6 | 1.287 | 22.16 | 1-O |
| V1178 | 1 2 22.3 | +1 55 50.1 | 1.628 | 22.36 | F |
| V1241 | 1 2 27.0 | +1 53 07.8 | 1.049 | 21.95 | 1-O |
| V1289 | 1 2 25.3 | +1 54 00.9 | 0.646 | 22.33 | … |
| V1296 | 1 2 17.6 | +1 54 03.2 | 0.859 | 22.53 | … |
| V1337 | 1 2 17.4 | +1 54 47.1 | 6.743 | 20.45 | F |
| V1371 | 1 2 26.8 | +1 55 31.3 | 0.886 | 22.38 | 1-O |
| V1479 | 1 2 28.3 | +1 52 48.7 | 1.123 | 22.15 | 1-O |
| V1592 | 1 2 26.7 | +1 53 04.4 | 4.360 | 21.76 | F |
| V1734 | 1 2 17.3 | +1 54 02.4 | 5.737 | 20.68 | F |
| V1756 | 1 2 18.9 | +1 54 14.6 | 2.445 | 22.27 | F |
| V1767 | 1 2 20.2 | +1 54 21.8 | 0.797 | 22.31 | 2-O? |
| V1798 | 1 2 26.3 | +1 54 47.1 | 3.272 | 21.68 | F |
| V1897 | 1 2 25.5 | +1 52 17.2 | 4.065 | 20.92 | F |
| V2020 | 1 2 29.0 | +1 54 43.5 | 1.870 | 22.33 | 1-O |
| V2100 | 1 2 30.1 | +1 52 53.9 | 1.879 | 22.69 | … |
| V2150 | 1 2 18.7 | +1 53 48.9 | 2.567 | 21.47 | F |
| V2172 | 1 2 23.5 | +1 54 31.8 | 1.431 | 22.12 | 1-O |
| V2221 | 1 2 30.3 | +1 52 43.4 | 5.721 | 21.12 | F |
| V2256 | 1 2 28.0 | +1 53 23.2 | 3.663 | 21.29 | F |
| V2262 | 1 2 27.5 | +1 53 30.1 | 1.443 | 21.71 | … |
| V2309 | 1 2 19.0 | +1 54 55.6 | 2.180 | 21.95 | F |
| V2396 | 1 2 26.4 | +1 54 40.7 | 145.6 | 17.43 | F |
| V2414 | 1 2 25.4 | +1 52 35.5 | 7.573 | 20.83 | F |
| V2766 | 1 2 21.7 | +1 52 09.9 | 2.238 | 21.84 | F |
In the following we report some notes on selected stars.
V2396. The data sampling does not allow to construct the complete light curve, however the period found by us is close to that given by Sandage ([1971]).
V2414 and V0107 have very small amplitudes, about 0.2 - 0.3 mag; looking at our Galaxy, this is not unusual for stars with between 7 and 10 d.
V1337 has the best light curve, which can be fitted with a 5th order Fourier decomposition and rms residual of 0.026 mag.
V2221 is an interesting case, because it has a close (0\farcs8) companion which is slightly fainter. DAOPHOT was not able to resolve always the two stars, and therefore the resulting light curve was very scattered. We have simply summed the luminosities of the two stars when they were resolved; the two light curves are shown in Fig. 10. Some scatter is still present, but the Cepheid behavior is evident; clearly its amplitude is smaller than what should be expected, and one should correct for the companion’s luminosity before using the star in a relation. The referee has remarked, however, that these problems given by close stars can be overcome by using the fixed position photometry (see Kaluzny et al. 1998).
V1592 was not noticed by Baade and Sandage, even if it has large amplitude and is sufficiently bright, probably because it is located in a partially crowded region.
V0551, V0655 and V2100 are characterized by rather symmetric light curves, but their periods and luminosities are typical of fundamental mode Cepheids; the available color of one of them indicates a location in the instability strip. The nature of these stars is uncertain; tentatively we put them in relation with the anomalous Cepheids, even if their periods and luminosities are larger than those seen in galactic and extragalctic anomalous Cepheids.


5.2 SV39=V1740
The enigmatic nature of this variable was already pointed out by Sandage (1971). According to the old data the light curve could be described as an inverted Lyrae eclipsing variable with a period of 28.72 d. Notwithstanding this very peculiar shape and the high luminosity with respect to the relation, Sandage included it among Cepheids and as such it remains in the GCVS. We have reanalyzed by means of the power spectrum technique both the old photograpic measurementes (107 datapoints) and our 67 ones. The analysis was performed both separately for the two data sets and by merging the sets after rescaling the data to the ones (the scale factor is 1.9) and aligning the zeropoints of the two timeseries. The light variation seems rather complicated but a firm conclusion can be reached: there are at least two periodic terms which fit both datasets, one with a period of 28.699 d, very similar to that suggested by Sandage, and the other with P=1123 d. The reality of this long period term can be deduced from Fig. 11. In the upper panel we have plotted all the data phased with the short period. The photographic data are indicated by asteriscs, while filled circles represents the data of the season 1995–97, and open circles those of 1998. It is evident that in 1998 the star was sistematically less bright than in 1995–97. In the lower panel we have subtracted from the data the long period term. Now the data dispersion about a mean curve of both photographic and data is considerably decreased, and in particular the 1998 data are well aligned with those of previous years. Another fact can be deduced from the figure: after removing the long period term, the difference between the two maxima is significantly decreased. As a matter of fact if we adopt as the short period 14.350 d instead of its double, the fit of the data is only marginally worse. Therefore with the present available dataset, we prefer to be cautios and not do decide which of the two possible short periods is the correct one. Another and more pregnant open question is the nature of the variability. The color of the star, –=0.52, is similar to that of Cepheids; however no radially pulsating star with such an amplitude is known to have symmetric maxima, and furthermore it is not possible to explain theoretically such a shape. A check of the amplitudes is not much conclusive: assuming the amplitude was essentially constant during fifty years, the ratio of photographic and white light amplitudes is in the range 0.9 - 1.5 for 5 bright Cepheids, and only V1039 has ratio 1.9 as V1740.
| Name | (1950) | (1950) | P | Wh | Type |
|---|---|---|---|---|---|
| [h m s] | [o ’ ”] | [d] | |||
| V0130 | 1 2 23.8 | +1 52 42.8 | 22.99 | 21.61 | W Vir |
| V0155 | 1 2 24.4 | +1 52 51.0 | 35.27 | 22.00 | |
| V0219 | 1 2 22.6 | +1 53 11.6 | 9.847 | 22.11 | |
| V0252 | 1 2 28.4 | +1 53 26.5 | 31.12 | 21.06 | |
| V0670 | 1 2 17.6 | +1 55 29.1 | 50.2 | 21.38 | |
| V0699 | 1 2 20.9 | +1 55 34.9 | 24.2 | 22.14 | |
| V0702 | 1 2 25.9 | +1 55 39.3 | 36.27 | 22.56 | |
| V0707 | 1 2 27.7 | +1 55 42.3 | 24.4 | 22.59 | |
| V0881 | 1 2 27.8 | +1 53 03.4 | 8.353 | 22.12 | W Vir |
| V0909 | 1 2 30.1 | +1 53 16.1 | 35.18 | 22.27 | |
| V0971 | 1 2 24.9 | +1 53 51.4 | 31.15 | 21.39 | W Vir |
| V1193 | 1 2 18.4 | +1 52 10.5 | 80.1 | 20.81 | LP, RV |
| V1556 | 1 2 19.2 | +1 52 47.6 | 25.35 | 22.22 | |
| V1598 | 1 2 26.0 | +1 53 06.1 | 23.01 | 20.94 | W Vir |
| V1849 | 1 2 21.6 | +1 55 24.4 | 10.30 | 22.54 | |
| V1892 | 1 2 22.3 | +1 52 09.3 | 145.1 | 21.03 | LP |
| V1935 | 1 2 24.1 | +1 52 59.0 | 61.66 | 20.54 | W Vir |
| V1961 | 1 2 18.7 | +1 53 23.5 | 18.4 | 22.01 | |
| V1978 | 1 2 25.3 | +1 53 50.5 | 82.0 | 20.99 | LP |
| V2598 | 1 2 27.2 | +1 53 09.6 | 22.82 | 21.97 | |
| V2782 | 1 2 29.3 | +1 52 25.4 | 30.96 | 22.05 | |
| V2861 | 1 2 16.7 | +1 52 49.0 | 12.0 | 22.19 |
5.3 Other periodic variables
Periodic variables include red variables and population II pulsating stars (Fig. 12), and eclipsing binaries (Fig. 13).
V1892, V1193 and V1978 are probable long period variables. In particular, V1193 could be an RV Tau star with a long period of 160.2 d; however – is 0.94.
The population II Cepheids (or W Vir stars) should have – not very different from that of population I Cepheids, since the latter are rather metal-poor; moreover, for a given luminosity, population II Cepheids have a much longer period. On these basis we have identified 5 of such stars, namely V00130, V0881, V0971, V1598 and V1935.
| Name | (1950) | (1950) | P | |
|---|---|---|---|---|
| [h m s] | [o ’ ”] | [d] | ||
| V0033 | 1 2 26.5 | +1 52 18.6 | 1.864 | 22.7 |
| V0215 | 1 2 16.5 | +1 53 06.2 | 35.635 | 22.4 |
| V0230 | 1 2 25.6 | +1 53 27.1 | 25.985 | 20.6 |
| V0490 | 1 2 29.6 | +1 54 33.8 | 2.238 | 21.7 |
| V0787 | 1 2 24.1 | +1 52 17.2 | 4.754 | 21.3 |
| V0975 | 1 2 19.9 | +1 53 46.1 | 4.474 | 21.4 |
| V1701 | 1 2 30.7 | +1 53 52.2 | 11.034 | 22.1 |
| V2199 | 1 2 29.1 | +1 52 13.2 | 2.198 | 20.8 |
From a simple inspection of the phased light curves we have identified 24 possible eclipsing binaries. Only 8 stars are reported in Table 6 and are shown in Fig. 13. A detailed anlaysis of all the candidates will be performed in a subsequent paper.
5.4 Other semiregular and irregular variables
There are several stars which are characterized by irregular variability on different time scales; some of them could be long period variables which cannot be identified as such owing to the data sampling and the short observing time interval. In Fig. 14 some of these stars are shown.
SV21=V3106 could vary both with short (tens of days) and long ( d) timescales; the amplitude is about 1 mag and the color is –.
SV52=V1908 is variable with small amplitude (less than 0.3 mag), and appears brighter than fifty years ago. The color –=0.39 indicates a yellow star in the upper part of the instability strip.
If the identification is correct, the star SV56=V1800 previously known as irregular variable, appears to be constant or variable with very small amplitude (less than about 0.1 mag); it is not reported in Table 7.
| Name | (1950) | (1950) | timescale of | |
|---|---|---|---|---|
| [h m s] | [o ’ ”] | variability [d] | ||
| V0076 | 1 2 27.3 | +1 52 31.6 | 16.32 | 1000 |
| V0089 | 1 2 24.1 | +1 53 00.7 | 16.73 | 650 |
| V0106 | 1 2 29.2 | +1 52 41.5 | 22.12 | 150 |
| V0157 | 1 2 23.8 | +1 52 48.6 | 21.63 | 220 |
| V0193 | 1 2 16.5 | +1 52 49.9 | 20.89 | 260 |
| V0218 | 1 2 18.6 | +1 53 07.9 | 22.19 | 280 |
| V0253 | 1 2 17.9 | +1 53 17.1 | 21.25 | 62 |
| V0496 | 1 2 16.4 | +1 54 34.7 | 21.49 | 42 |
| V0505 | 1 2 23.6 | +1 54 36.7 | 21.00 | 130 |
| V0530 | 1 2 20.2 | +1 54 43.0 | 20.78 | 54 |
| V0663 | 1 2 26.9 | +1 55 35.3 | 21.70 | 310 |
| V0688 | 1 2 23.4 | +1 55 34.5 | 22.26 | 660 |
| V0764 | 1 2 16.5 | +1 52 01.0 | 21.98 | 110 |
| V0841 | 1 2 16.4 | +1 52 29.1 | 21.61 | 120 |
| V0842 | 1 2 31.4 | +1 52 39.7 | 22.28 | 46 |
| V0861 | 1 2 26.6 | +1 52 47.9 | 21.53 | 80 |
| V0929 | 1 2 18.9 | +1 53 16.5 | 21.20 | 77 |
| V1130 | 1 2 28.7 | +1 55 27.5 | 21.32 | 18 |
| V1167 | 1 2 19.4 | +1 55 39.6 | 19.33 | 56 |
| V1177 | 1 2 21.5 | +1 55 48.9 | 21.04 | |
| V1181 | 1 2 22.7 | +1 55 53.8 | 20.82 | 990 |
| V1224 | 1 2 18.1 | +1 52 46.0 | 22.17 | 550 |
| V1322 | 1 2 19.1 | +1 54 35.5 | 21.04 | 480 |
| V1331 | 1 2 24.6 | +1 54 46.6 | 20.71 | 100 |
| V1758 | 1 2 17.3 | +1 54 15.3 | 21.18 | 46 |
| V1783 | 1 2 23.2 | +1 54 32.5 | 21.44 | 430 |
| V1812 | 1 2 21.0 | +1 54 51.9 | 20.86 | 630 |
| V1830 | 1 2 21.2 | +1 55 06.5 | 21.23 | 104 |
| V1872 | 1 2 29.5 | +1 55 49.3 | 19.37 | 650 |
| V1908 | 1 2 18.9 | +1 52 21.4 | 20.14 | 300 |
| V2033 | 1 2 26.5 | +1 55 05.5 | 20.75 | 100 |
| V2095 | 1 2 25.0 | +1 52 46.6 | 21.26 | 270 |
| V2109 | 1 2 21.6 | +1 53 00.9 | 21.80 | 230 |
| V2124 | 1 2 26.0 | +1 53 21.6 | 20.56 | 440 |
| V2178 | 1 2 17.2 | +1 54 33.6 | 20.73 | 120 |
| V2321 | 1 2 30.8 | +1 55 47.4 | 17.30 | 62 |
| V2521 | 1 2 28.6 | +1 52 44.5 | 21.78 | 12 |
| V3106 | 1 2 30.7 | +1 54 44.3 | 20.31 | 1000 |

6 Discussion
6.1 The -band
The main aim of our research is the study of Cepheid light curves in nearby galaxies. This study requires a certain amount of observing telescope time, and owing to the pressure on the available observational facilities in sites with good sky and seeing conditions, we were forced to exploit as much as possible the relatively small telescopes. This reason, coupled with the need of the highest signal-to-noise ratio for obtaining accurate light curves, has implied our decision of observing with no filter. The advantage with respect to usual filters in the optical range, such as Johnson or Gunn systems, is that the number of collected photons is larger by about a factor from 4 to 6, which means that, for the same exposure time, an observation in band with a 0.9 m telescope is equivalent, in terms of collected photons, to an observation in band with a 2.1 m. On the other hand, the background sky tends to increase in the near infrared and this effect should be more evident when observing galaxies with a strong red background. This is not the case of IC 1613, however, because we have estimated a similar star/sky intensity ratio in and bands.
The observational data of IC 1613 Cepheids show that, for exposure times of half a hour with a 0.9 m telescope and a back-illuminated CCD, it is possible to get light curves which are as accurate as 0.03 mag for stars with mag, and to detect variable stars as faint as 23.
The photometric properties of the band appear reasonably good. The effective wavelength for A-G spectral types is intermediate between that of Johnson and bands, and measurements correlate well with and –. The obvious defect is that the photometry depends on the instrument. For example the response of the system changes when using a front-illuminated CCD instead of a back-illuminated one, because the effective wavelength in the front-illuminated case is closer to that of band. Therefore some care will be required when merging differential observations of the same stellar field obtained with different instruments. Systematic effects related to star colours are expected, but they can be probably corrected for; this requires, however, one very deep exposure in and or one observation with a larger telescope to get the colors of the faintest stars. Star colors are important in any case for discussing the nature of variables, therefore the suggested strategy for future work in this field shall include at least one observation in a photometric system with an adequately large telescope for obtaining this information.
It is interesting to compare, at least qualitatively, our results with those of analogous surveys such as DIRECT (Kaluzny et al. [1999]), which is the project dedicated to the observations of M31. We recall that the distance of IC 1613, , is very similar to that of M31, (Madore & Freedman [1991]), but the stars of M31 suffer of local reddening from 0 to 0.25. DIRECT uses telescopes of 1.2 - 1.3 m, front- and back-illuminated CCD detectors and exposure time of 900 s, and the number of collected photons would be approximately similar to that obtained by us with the 0.9 m telescope, exposure of 1800 sec and same filter. For a given period, the M31 Cepheid light curves appear less accurate than those of IC 1613 in band. Another indication is the faintest Cepheid with short period: in M31 the limit is about 4 d and mag (Stanek et al. [1998]); in IC 1613 we estimate . We note that it is not easy to compare observations obtained with different telescopes, and the difference between M31 and IC 1613 results could depend in part also on crowding problems in M31, average seeing conditions, etc. In principle, however, we expect a gain of about 1.5 mag due to the use of the band, for the same telescope and conditions.

6.2 PL relation
It is possible to derive a relation for Cepheids using measurements, and we should expect a similar slope to that obtained for and . The relation is shown in Fig. 15 for 22 fundamental mode Cepheids (dashed line). The slope is –2.690.26 and the zero-point is 22.960.16; these figures were obtained without considering V2396 (with d; but this exclusion is unessential) and we have reported them just for illustrative purposes. A detailed discussion will be made when the observations of all the fields of IC 1613 will be reduced; in particular, we will look for the possible bending of the relation at very short period, a feature which was observed in the Small Magellanic Cloud (Bauer et al. [1998]). The zero-point of our relation is obviously instrumentation dependent, even if in principle one could use a transformation such as eq. 2. However the results of our study could be applied to distance determinations in another way. When Cepheids have been identified and their periods have been determined, then it is sufficient one observation in band for constructing a standard relation for the galaxy. Freedman ([1988a]) has discussed and applied in detail this method, that is the ’single-phase’ relation. In Paper II we will show an example of this application.
7 Conclusion
We have presented the first results of a survey of nearby galaxies for detecting and studying Cepheids, and we have proven the utility of the white-light-band observations, i.e. no filter, for reaching this goal. About 43 population I Cepheids with estimated luminosity as faint as have been detected in Field A of IC 1613, while only 9 of them were previously known; most of the new stars have short period or small amplitude. A detailed study of these and of population II Cepheids will be reported in Paper II.
The main conclusion of the present paper is the proposal of a new strategy for studying Cepheids as distance indicators. Relatively small telescopes and the -band can be used for the survey of nearby galaxies looking accurately for Cepheids. Then just one , and/or images taken with a two or three times larger telescope are needed in order to obtain the photometric data useful for the construction of the relation for those galaxies. Of course, the procedure can be extended to far galaxies observed with comparatively larger telescopes. We are performing simulations for testing the advantage of this method over the standard technique when applied to VLT and HST.
Acknowledgements.
The authors wish to thank the referee, K.Z. Stanek, for the useful comments.References
- [1998] Alcock C., Allsman R.A., Alves D. et al., 1999, ApJ 511, 185
- [1997] Antonello E., Kanbur S.M., 1997, MNRAS 286, L33
- [1999] Antonello E., Mantegazza L., Fugazza D., Bossi M., 1999, in preparation (Paper II)
- [1986] Antonello E., Poretti E., 1986, A&A 169, 149
- [1990] Antonello E., Poretti E., Reduzzi L., 1990, A&A 236, 138
- [1998] Bauer F., Afonso C., Albert J.N. et al., 1998, astro-ph/9807094, submitted to A&A
- [1997] Beaulieu J.P., Sasselov D.D., 1997, in Variable Stars and the Astrophysical Returns of Microlensing Surveys, eds. Ferlet R., Maillard J.P., Raban B., Editions Frontieres, p. 193
- [1998] Buchler J.R., 1998, in A Half Century of Stellar Pulsation Interpretations: A Tribute to Arthur N. Cox, eds. Bradley P.A., Guzik J.P., ASP 135, 220
- [1999] Buchler J.R., Yecko P., Kolláth Z., Goupil M.J., 1999, preprint astro-ph/9901188
- [1990] Carlson G., Sandage A., 1990, ApJ 352, 587
- [1994] Davis L.E., 1994, A Reference Guide to the IRAF/DAOPHOT Package, IRAF Programming Group, NOAO, Tucson
- [1988a] Freedman W.L., 1988a, ApJ 326, 691
- [1988b] Freedman W.L., 1988b, A.J. 96, 1248
- [1992] Jacoby G.H., Branch D., Ciardullo R. et al., 1992, PASP 104, 599
- [1998] Kaluzny J., Stanek K.Z., Krockenberger M. et al. 1998, AJ 115, 1016
- [1999] Kaluzny J., Mochejska B.J., Stanek K.Z. et al. 1999, astro-ph/9902382, submitted to AJ
- [1990] Iglesias C.A., Rogers F.J., Wilson B.G., 1990, ApJ 360, 221
- [1991] Madore B.F., Freedman W.L., 1991, PASP 103, 993
- [1998] Madore B.F., Freedman W.L., Silbermann N. et al., 1998, Nature 395, 47
- [1992] Moskalik P., Buchler J.R., Marom A., 1992, ApJ 385, 685
- [1997] Poretti E., Pardo I., 1997, A&A 324, 133
- [1995] Samus N.N. 1995, General Catalogue of Variable Stars, IV ed., Vol. V, Moscow, Kosmosinform
- [1971] Sandage A., 1971, ApJ 166, 13
- [1988] Sandage A., 1988, PASP 100, 935
- [1989] Schmidt E.G., Spear G.G., 1989, MNRAS 236, 567
- [1994] Seaton M.J., Yan Y., Mihalas D., Pradhan A.K., 1994, MNRAS 266, 805
- [1982] Simon N.R., 1982, ApJ 260, 87
- [1981] Simon N.R. and Lee A.S., 1981, ApJ 248, 291
- [1998] Stanek K.Z., Kaluzny J., Krockenberger M. et al. 1998, AJ 115, 1894
- [1987] Stetson P.B., 1987, PASP 99, 191
- [1996] Stetson P.B., 1996, PASP 108, 851
- [1999] Udalski A., Soszynski I., Szymanski M. et al. 1999, astro-ph/9903393; Acta Astronomica 49, 45
- [1997] Welch D.L., Alcock C., Allsman R.A. et al., 1997, in Variable Stars and the Astrophysical Returns of Microlensing Surveys, eds. Ferlet R., Maillard J.P., Raban B., Editions Frontieres, p. 205