The rapidly evolving hypergiant IRC +10 420: High-resolution bispectrum speckle-interferometry and dust-shell modelling
Abstract
The hypergiant IRC +10 420 is a unique object for the study of stellar evolution since it is the only object that is believed to be witnessed in its rapid transition from the red supergiant stage to the Wolf-Rayet phase. Its effective temperature has increased by 1000-2000 K within only 20 yr. We present the first speckle observations of IRC +10 420 with 73 mas resolution. A diffraction-limited 2.11 m image was reconstructed from 6 m telescope speckle data using the bispectrum speckle-interferometry method. The visibility function shows that the dust shell contributes to the total flux and the unresolved central object .
Radiative transfer calculations have been performed to model both the spectral energy distribution and visibility function. The grain sizes, , were found to be in accordance with a standard distribution function, , with ranging between = 0.005 m and = 0.45 m. The observed dust shell properties cannot be fitted by single-shell models but seem to require multiple components. At a certain distance we considered an enhancement over the assumed density distribution. The best model for both SED and visibility was found for a dust shell with a dust temperature of 1000 K at its inner radius of . At a distance of the density was enhanced by a factor of 40 and and its density exponent was changed from to . The shell’s intensity distribution was found to be ring-like. The ring diameter is equal to the inner diameter of the hot shell ( mas). The diameter of the central star is mas. The assumption of a hotter inner shell of 1200 K gives fits of almost comparable quality but decreases the spatial extension of both shells’ inner boundaries by % (with in the outer shell). The two-component model can be interpreted in terms of a termination of an enhanced mass-loss phase roughly 60 to 90 yr (for kpc) ago. The bolometric flux, , is Wm-2 corresponding to a central-star luminosity of .
Key Words.:
Techniques: image processing — Circumstellar matter — Stars: individual: IRC +10 420 — Stars: mass–loss — Stars: supergiants — Stars: Wolf-Rayet1 Introduction
The star IRC +10 420 (= V 1302~Aql = IRAS 19244+1115) is an outstanding object for the study of stellar evolution. Its spectral type changed from F8 I in 1973 (Humphreys et al. 1973) to mid-A today (Oudmaijer et al. OudGroeMatBloSah96 (1996), Klochkova et al. KloChePan97 (1997)) corresponding to an effective temperature increase of 1000-2000 K within only 20 yr. It is one of the brightest IRAS objects and one of the warmest stellar OH maser sources known (Giguere et al. GigWooWeb76 (1976), see also Mutel et al. MutEtal79 (1979), Diamond et al. DiaEtal83 (1983), Bowers Bow84 (1984), Nedoluha & Bowers NedBow92 (1992)). Ammonia emission has been reported by McLaren & Betz (1980) and Menten & Alcolea (1995). Large mass-loss rates, typically of the order of several M⊙/yr (Knapp & Morris KnaMor85 (1985), Oudmaijer et al. OudGroeMatBloSah96 (1996)) were determined by CO observations. Two evolutionary scenarios have been suggested for IRC +10 420: It is either a post-AGB (AGB: Asymptotic Giant Branch) star evolving through the proto-planetary nebula stage (e.g. Fix & Cobb FixCob87 (1987), Hrivnak et al. HriKwoVol89 (1989), Bowers & Knapp BowKnap89 (1989)), or it is a massive hypergiant evolving from the RSG (Red Supergiant Branch) branch towards the Wolf-Rayet phase (e.g. Mutel et al. MutEtal79 (1979), Nedoluha & Bowers NedBow92 (1992), Jones et al. JonHumGehEtal93 (1993), Oudmaijer et al. OudGroeMatBloSah96 (1996), Klochkova et al. KloChePan97 (1997)). However, due to its distance ( = 3-5 kpc), large wind velocity (40 km/s) and photometric history, IRC +10 420 is most likely a luminous massive star (see Jones et al. JonHumGehEtal93 (1993) and Oudmaijer et al. OudGroeMatBloSah96 (1996)), therefore being the only massive object observed until now in its transition to the Wolf-Rayet phase. The structure of the circumstellar environment of IRC +10 420 appears to be very complex (Humphreys et al. 1997), and scenarios proposed to explain the observed spectral features of IRC +10 420 include a rotating equatorial disk (Jones et al. 1993), bipolar outflows (Oudmaijer et al. 1994), and the infall of circumstellar material (Oudmaijer 1998).
Previous infrared speckle and coronographic observations were reported by Dyck et al. (DyckEtal84 (1984)), Ridgway et al. (RidgEtal86 (1986)), Cobb & Fix (CobFix87 (1987)), Christou et al. (ChrEtal90 (1990)) and Kastner & Weintraub (KastWein95 (1995)). In this paper we present diffraction-limited 73 mas bispectrum speckle-interferometry observations of the dust shell of IRC +10 420 as well as radiative transfer calculations to model its spectral energy distribution and visibility.
2 Observations and data reduction
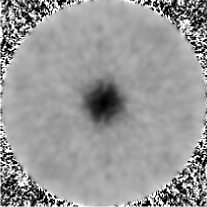
The IRC +10 420 speckle interferograms were obtained with the Russian 6 m telescope at the Special Astrophysical Observatory on June 13 and 14, 1998. The speckle data were recorded with our NICMOS-3 speckle camera (HgCdTe array, 2562 pixels, frame rate 2 frames/s) through an interference filter with a centre wavelength of 2.11 m and a bandwidth of 0.19 m. Speckle interferograms of the unresolved star HIP 95447 were taken for the compensation of the speckle interferometry transfer function. The observational parameters were as follows: exposure time/frame 50 ms; number of frames 8400 (5200 of IRC +10 420 and 3200 of HIP 95447); 2.11 m seeing (FWHM) 10; field of view 7878; pixel size 30.5 mas. A diffraction-limited image of IRC +10 420 with 73 mas resolution was reconstructed from the speckle interferograms using the bispectrum speckle-interferometry method (Weigelt Wei77 (1977), Lohmann et al. LohWeiWir83 (1983), Hofmann & Weigelt HofWei86 (1986)). The bispectrum of each frame consisted of 37 million elements. The modulus of the object Fourier transform (visibility) was determined with the speckle interferometry method (Labeyrie Lab70 (1970)).
It is noteworthy that 2.11 m filters also serve to image hydrogen emission as, for instance, H2 (2.125 m) or Br (2.166 m) emission. Accordingly, it is possible that one might look at hydrogen emission rather than at the dust emission of a circumstellar shell. The low-resolution spectrum of IRC +10 420 published in the atlas of Hanson et al. (HanEtal96 (1996)) shows a Br line in emission as the most prominent feature for the wavelength range considered here. Oudmaijer et al. (OudEtal94 (1994)) carried out high-resolution infrared spectroscopy and found an equivalent width of 1.2 Å for the Br emission line. This is only 0.06% of the bandwidth of our interference filter and consequently negligible.
Figure 1 shows the reconstructed 2.11 m visibility function of IRC +10 420. There is only marginal evidence for an elliptical visibility shape (position angle of the long axis , axis ratio to 1.1). The visibility 0.6 at frequencies cycles/arcsec shows that the stellar contribution to the total flux is 60% and the dust shell contribution is 40%. In order to compare our results with speckle observations of other groups we determined the Gauß fit FWHM diameter of the dust shell to be mas. By comparison, Christou et al. (1990) found for 3.8 m telescope K-band data a dust-shell flux contribution of 50% and mas. However, as will be shown later, a ring-like intensity distribution appears to be much better suited than the assumption of a Gaussian distribution whose corresponding FWHM diameter fit may give misleading sizes (see Sect. 3.4.5). Fig. 2 displays the azimuthally averaged diffraction-limited images of IRC +10 420 and the unresolved star HIP 95447.


3 Dust shell models
3.1 Spectral energy distribution
The spectral energy distrubion (SED) of IRC +10 420 with 9.7 and 18 m silicate emission features is shown in Fig. 3. It corresponds to the ’1992’ data set used by Oudmaijer et al. (OudGroeMatBloSah96 (1996)) and combines VRI (October 1991), near-infrared (March and April 1992) and Kuiper Airborne Observatory photometry (June 1991) of Jones et al. (JonHumGehEtal93 (1993)) with the IRAS measurements and 1.3 mm data from Walmsley et al. (WalEtal91 (1991)). Additionally, we included the data of Craine et al. (CraEtal76 (1976)) for m. In contrast to the near-infrared, the optical magnitudes have remained constant during the last twenty years within a tolerance of .
IRC +10 420 is highly reddened due to an extinction of by the interstellar medium and the circumstellar shell. From polarization studies Craine et al. (CraEtal76 (1976)) estimated an interstellar extinction of . Jones et al. (JonHumGehEtal93 (1993)) derived from their polarization data to . Based on the strength of the diffuse interstellar bands Oudmaijer (Oud98 (1998)) inferred for the interstellar contribution compared to a total of . We will use an interstellar of as in Oudmaijer et al. (OudGroeMatBloSah96 (1996)). This interstellar reddening was taken into account by adopting the method of Savage & Mathis (SavMat79 (1979)) with .
3.2 The radiative transfer code
In order to model both the observed SED and m visibility, we performed radiative transfer calculations for dust shells assuming spherical symmetry. We used the code DUSTY developed by Ivezić et al. (IveNenEli97 (1997)), which solves the spherical radiative transfer problem utilizing the self-similarity and scaling behaviour of IR emission from radiatively heated dust (Ivezić & Elitzur IveEli97 (1997)). To solve the radiative transfer problem including absorption, emission and scattering several properties of the central source and its surrounding envelope are required, viz. (i) the spectral shape of the central source’s radiation; (ii) the dust properties, i.e. the envelope’s chemical composition and grain size distribution as well as the dust temperature at the inner boundary; (iii) the relative thickness of the envelope, i.e. the ratio of outer to inner shell radius, and the density distribution; and (iv) the total optical depth at a given reference wavelength. The code has been expanded for the calculation of synthetic visibilities as described by Gauger et al. (GauEtal99 (1999)).
3.3 Single-shell models
We calculated various models considering the following parameters within the radiative transfer calculations: SED and visibility were modelled for to 9000 K, black bodies and Kurucz (1992) model atmospheres as central sources of radiation, different silicates (Draine & Lee DraLee84 (1984), Ossenkopf et al. OssEtal92 (1992), David & Pegourie DavPeg95 (1995)), single-sized grains with to 0.6 m and grain size distributions according to Mathis et al. (MRN77 (1977), hereafter MRN), i.e. , with 0.005 to m. We used a density distribution and a shell thickness of to with and being the outer and inner radius of the shell, respectively. Then, the remaining fit parameters are the dust temperature, , which determines the radius of the shell’s inner boundary, , and the optical depth, , at a given reference wavelength, . We refer to m. Models were calculated for dust temperatures between 400 and 1000 K and optical depths between 1 and 12. Significantly larger values for lead to silicate features in absorption.
Fig. 3 shows the SED calculated for = K, =, Draine & Lee (1984) silicates, MRN grain size distribution (m) and different dust temperatures. It illustrates that the long-wavelength range is sufficiently well fitted for cool dust with K, optical wavelengths and silicate features require . The inner radius of the dust shell is at (: stellar radius), the equilibrium temperature at the outer boundary amounts to K. However, the fit fails in the near-infrared underestimating the flux between 2 and 5 m. Instead this part of the SED seems to require much hotter dust of K (, K). This confirms the findings of Oudmaijer et al. (OudGroeMatBloSah96 (1996)) who conducted radiative transfer calculations in the small particle limit, where scattering is negligible. They introduced a cool (400 K) and a hot (1000 K) shell to achieve an overall fit.


We found this behaviour of single-shell SEDs to be almost independent of various input parameters. Increasing from to leads to somewhat higher fluxes, but only for m. The equilibrium temperature at the outer boundary decreases by a factor of two if the shell’s thickness is increased by one order of magnitude. Larger gives slightly less flux in the near-infrared, larger wavelengths (m) are almost unaffected. The Draine & Lee (1984) and David & Pegourie (1994) silicates give almost identical results, the optical constants of Ossenkopf et al. (1992) lead to a larger 9.7 m/18 m flux ratio for the silicate features, to somewhat higher fluxes between 2 and 10 m and to a somewhat flatter slope of the SED at short wavelengths. However, the need for two dust components still exists. Calculations with different grain sizes show that single-sized grains larger than 0.2 m are not suitable for IRC +10 420. The silicate features are worse fitted and, in particular, a significant flux deficit appears in the optical and near-infrared. The variation of the maximum grain size in the MRN distribution leads to much smaller differences due to the steep decrease of the grain number density with grain size.
The 2.11 m visibility is very sensitive against scattering, thus depending strongly on the assumed grain sizes (see Groenewegen Groe97 (1997)) as demonstrated in Fig. 4. For a given set of parameters both inclination and curvature of the visibility are mainly given by the optical depth, , and the grain size, . Since is fixed to small values due to the emission profiles, can be determined. The dust temperature must be varied simultaneously since an increase of leads to a steeper declining visibility. Our calculations show that the visibility is best fitted for an intermediate in contrast to the SED. Either single-sized grains with m (which, however, are ruled out by the SED) or MRN grain size distributions with to 0.5 m are appropriate. This result still depends on the kind of silicates considered, i.e. on the optical constants. For instance, if we take the ’warm silicates’ of Ossenkopf et al. (1992), we get somewhat smaller particles (by m, i.e. m for single-sized grains and m for a grain distribution, resp.). The differences to the corresponding ’cold silicates’ or to the data from David & Pegourie (1994) are found to be smaller. The fits to the SED are of comparable quality. We chose Draine & Lee (DraLee84 (1984)) silicates with m and m.
3.4 Multiple dust-shell compenents
3.4.1 Two component shells
Since we failed to model the SED with the assumptions made so far, we introduced a two-component shell as Oudmaijer et al. (1996). For that purpose, we assume that IRC +10 420 had passed through a superwind phase in its history as can be expected from its evolutionary status (see Schaller et al. 1992, García-Segura et al. 1996). This is in line with the conclusions drawn from the Oudmaijer et al. (1996) model and recent interpretations of HST data (Humphreys et al. 1997). A previous superwind phase leads to changes in the density distribution, i.e. there is a region in the dust shell which shows a density enhancement over the normal distribution. The radial density distribution may also change within this superwind shell. For more details, see Suh & Jones (SuhJon97 (1997)). Since dust formation operates on very short timescales in OH/IR stars, we assume a constant outflow velocity for most of the superwind phase and thus a density distribution. For simplicity, we consider only single jumps with enhancement factors, or amplitudes, at radii in the relative density distribution as demonstrated in Fig. 5.
Concerning the grains we stay with Draine & Lee (DraLee84 (1984)) silicates and an MRN grain size distribution with m and m as in the case of the single shell models. The influence of different grain-size distributions will be discussed later.

We calculated a grid of models for K with superwinds at to 8.5 with amplitudes ranging from 10 to 80. Due to the introduced density discontinuity the flux conservation has to be controlled carefully, in particular at larger optical depths and amplitudes. SED and visibility behave contrarily concerning the adjustment of the superwind: The SED requires sufficiently large distances, , and moderate amplitudes, to 40, in particular for the flux between 2 and m and for m.


A good fit was found for and corresponding to . Note that the bolometric flux at the inner dust-shell radius (and therefore ) is fully determined by the solution of the radiative transfer problem even though the overall luminosity is not (Ivezić & Elitzur 1997). The dust temperature at the density enhancement () has dropped to 322 K. This agrees well with the model of Oudmaijer et al. (OudGroeMatBloSah96 (1996)). The visibility, however, behaves differently. In order to reproduce the unresolved component (the plateau) large amplitudes, to 80, are required. On the other hand, the slope at low spatial frequencies is best reproduced for a close superwind shell, (at this distance independent on ). The best model found for both SED and visibility is that with and as shown in Fig. 6. It corresponds to and (with K), i.e. to angular diameters of mas and mas. The angular diameters depend on the model’s bolometric flux, , which is Wm-2. Accordingly, the central star has a luminosity of and an angular diameter of mas. Assuming a constant outflow velocity of km/s, the expansion ages of the two components are and . With a dust-to-gas ratio of 0.005 and a specific dust density of 3 g cm-3 the mass-loss rates of the components are and .
Fig. 7 shows the fractional contributions of the direct stellar radiation, the scattered radiation and the dust emission to the total emerging flux. The stellar contribution has its maximum at 2.2 m where it contributes 60.4% to the total flux in accordance with the observed visibility plateau of 0.6. At this wavelength scattered radiation and dust emission amount to 25.6% and 14% of the total flux, respectively. Accordingly, 64.6% of the 2.11 m dust-shell emission is due to scattered stellar light and 35.3% due to direct thermal emission from dust. For m the flux is determined by scattered radiation whereas for m dust emission dominates completely.

3.4.2 Influence of the grain-size distribution
As in the case of the single-shell models we also studied other grain size distributions. The MRN distribution derived for the interstellar medium gives a continuous decrease of the number density with increasing grain sizes. On the other hand, the distribution of grains in dust-shells of evolved stars rather appears to be peaked at a dominant size (e.g. Krüger & Sedlmayr 1997, Winters et al. 1997). It is noteworthy that even in the case of a sharply peaked size distribution the few larger particles can contribute significantly to the absorption and scattering coefficients (see Winters et al. 1997). Accordingly, the 2.11 m visibility reacts sensitively if some larger particles are added whereas the SED does not, as demonstrated in the previous section. In order to study the influence of different grain size distributions on the two-component model we calculated grids of models with for different exponents ( to ) and lower and upper cut-offs ( to 0.05 m and to 0.8 m). Additionally we considered single-sized grains ( to 0.8 m).
Concerning the visibility, a larger (smaller) negative exponent in the distribution function can, in principle, be compensated by increasing (decreasing) the maximum grain size. For instance, requires m to fit the 2.11 m visibility. On the other hand, if the distribution becomes too narrow, the SED cannot be fitted any longer since the m silicate feature turns into absorption. A distribution with and m best reproduces the flux-peak ratio of the silicate features.


For a given exponent in the grain-size distribution function of we arrive at the same maximum grain size as in the case of the one-component model, viz. 0.45 m, in order to yield a fit for both the SED and the visibility (see Fig. 8). This is due to the fact that larger particles increase the curvature of the visibility curve at low spatial frequencies whereas the high-frequency tail (the plateau) is found at lower visibility values. On the other hand, the inclusion of some larger particles does not change the shape of the SED as discussed above.
If sufficiently small, the lower cut-off grain size can be changed moderately (within a factor of two) without any significant change for SED and visibility. If exceeds, say, m, the fits of the observations begin to become worse. For instance, the curvature of the visibility at low spatial frequencies and the flux-peak ratio of the silicate features are then overestimated.
Finally, we repeated the calculations under the assumption of single-sized grains. In order to model the visibility a grain size close to m is required as shown in Fig. 9. In contrast, the reproduction of the relative strengths of the silicate features seems to require smaller grains, viz. close to m. Consequently, for the modelling of IRC +10 420 a grain size distribution appears to be much better suited than single-sized grains.


3.4.3 Influence of the density distribution
Inspection of the best fits derived so far reveals that there are still some shortcomings of the models. First, although being within the observational error bars, the model visibilities always show a larger curvature at low spatial frequencies. This seems to be almost independent of the chosen grain-size distribution. Second, the flux beyond m is somewhat too low. This may be due to our choice of a density distribution for both shells. We recalculated the model grid for different density distributions for both shells with x ranging between 1 and 4. A flatter distribution in the outer shell increases the flux in the long-wavelength range as required but leads also to a drop of the flux in the near-infrared. The plateau in the visibility curve remains unaffected but the curvature at low spatial frequencies is increased. To take advantage of the better far-infrared properties of cool shells with flatter density distributions, but to counteract their disadvantage in the near-infrared and at low spatial frequencies, the density distribution of the inner shell also has to be changed. It should be somewhat steeper than the normal distribution. Then the near-infrared flux is raised and the visibility shows a smaller curvature in the low-frequency range. It should be noted that the curvature is most affected for superwinds of low amplitudes. However, the steeper density decrease in the inner shell leads to increasingly low visibility values in the high frequency range. Since this has to be compensated by an increase of the superwind amplitude the advantages of the steeper distribution are almost cancelled.


Thus, we can stay with a density distrubution in the inner shell and moderate superwind amplitudes (). The then best suited models we found are those with superwinds at and a distribution in the outer shell. The corresponding SED and visibility are shown in Fig. 10 for different superwind amplitudes. We note again that the quality of the fits is in particular determined by the outer shell, whereas the inner shell’s exponent is less constrained. A distribution in the inner shell and large superwind amplitudes () give similar results.
The radii of the inner and outer shell are and (with K), resp., corresponding to angular diameters of mas and mas. Adopting the same assumptions for outflow velocity, dust-to-gas ratio and specific dust density as in the previous section, the expansion ages are and , for the mass-loss rate of the inner component one gets . In the outer component either the outflow velocity has increased or the mass-loss rate has decreased with time due to the more shallow density distribution. Provided the outflow velocity has kept constant, the mass-loss rate at the end of the superwind phase, 92 yr ago, was , and, for instance, amounted to 200 yr ago.
Since the flatter density distribution provides a better fit for the long-wavelength range of the SED, while the visibility is equally well fitted compared to the standard density distribution, it is superior to the model of Sect. 3.4.1. Fig. 11 gives the fractional flux contributions (stellar, dust, scattering) for the same model as shown in Fig. 7 but with an distribution in the outer shell. The various flux contributions at 2.11 m are very similar to those of the model: 62.2% stellar light, 26.1% scattered radiation and 10.7% dust emission. Thus, the total emission of the circumstellar shell is composed of 70.9% scattered stellar light and 29.1% direct thermal emission from dust.

3.4.4 Influence of the dust temperature
Finally, we studied the influence of the dust temperature at the inner boundary of the hot shell. For that purpose we recalculated the previous model grids for dust temperatures of 800 and 1200 K. As already shown for the single-shell models, an increase of the temperature at the inner boundary increases the flux in the near-infrared and substantially lowers the flux in the long-wavelength range. On the other hand, the higher the temperature the less is the curvature of the visibility at low spatial frequencies, the plateau is only significantly affected for low-amplitude superwinds. The shape of SED and 2.11 m visibility for different dust temperatures at the hot shell’s inner boundary for a given superwind is demonstrated in Fig. 12. A temperature less than 1000 K can be excluded in particular due to the worse fit of the visibility for low frequencies. Instead, the 1200 K model gives a much better fit to the visibility than previous ones. Fig. 12 refers to an amplitude of in order to be directly comparable with the models shown before. We note that we get an even better fit assuming , which leaves the low-frequency-range unchanged but improves the agreement with the measured plateau.


However, the improvement of the 2.11 m visibility model due to a hotter inner shell with K is at the expense of a considerable amplification of the flux deficit for m in the SED. In order to compensate this effect we have had to assume a flatter density profile for the outer shell than in the case of the K., viz. instead of . The corresponding curves are shown in Fig. 13. Again, increasing the far-infrared fluxes, as required to model the SED, leads to an increase of the 2.11 m visibility’s curvature at low spatial frequencies giving somewhat worse fits for the visibility. We note that the peak-ratio of the silicate features is better matched with a lower dust temperature of K.


The radii of the inner and outer shell are now considerably smaller than those of the previous models due to the higher temperature of the hot shell. The radiative transfer calculations give here and (with K), resp., resulting in angular diameters of mas and mas. Accordingly, the expansion ages are and , for the mass-loss rate of the inner component one gets . Provided the outflow velocity has kept constant, the mass-loss rate at end of the superwind phase, 63 yr ago, was , and, for instance, amounted to 200 yr ago.
3.4.5 Intensity distributions
Fig. 14 displays the spatial distribution of the obtained normalized model intensity for the model shown in Fig. 10 ( K, , , and density distribution in the inner and outer shell, resp.) The (unresolved) central peak belongs to the central star, and the two local intensity maxima to the loci of the inner rims of the two shells at 35 mas and 157 mas, resp. The m intensity shows a ring-like distribution with a steep decline with increasing distance from the inner boundary of the circumstellar shell. Similarly shaped intensity distributions have also been found by Ivezić & Elitzur (1996) for optically thin shells.

We recall that this intensity distribution is based on radiative transfer models taking into account both the SED and the m visibility. Figure 15 shows the model visibilities for much higher spatial frequencies than covered by the present observations. The required baselines would correpond to and 440 m instead to 6 m (13.6 cycles/arcsec). Since the dust-shell’s diameter is mas a plateau is only reached for spatial frequencies larger than, say, 15 cycles/arcsec depending on the strength of the superwind. The central star is resolved at spatial frequencies of cycles/arcsec. At frequencies cycles/arcsec the shape of the observed and the modelled visibility function is triangle-shaped, which is a consequence of the ring-like intensity distribution of the dust shell.


Visibility observations are often characterized by fits with Gaussian intensity distributions. The resulting Gaussian FWHM diameter is then assumed to give roughly the typical size of the dust shell. A Gauß fit to the observed visibility would yield a FWHM dust-shell diameter of (219 30) mas in agreement with the one given by Christou et al. (1990). However, radiative transfer models show that a ring-like intensity distributions appears to be more appropriate than a Gaussian one for the dust shell of IRC +10 420. The distribution shows a limb-brightenend dust condensation zone and a ring diameter of 70 mas.
4 Summary
Radiative transfer calculations show that the near-infrared visibility strongly constrains dust shell models since it is, e.g., a sensitive indicator of the grain size. Accordingly, high-resolution interferometry results provide essential ingredients for models of circumstellar dust-shells. Assuming spherical symmetry we carried out radiative transfer calculations for the hypergiant IRC +10 420 to model both its SED and m visibility. Since we failed to find good SED fits for single-component models, we improved our density distribution introducing a second component with enhanced values at a certain distance. For different scaled distances and density enhancements of this cool component we considered different grain-size distributions , density distributions within the shells, and temperatures at the inner boundary of the hot shell.
An MRN grain size distribution with was found to be well suited for IRC +10 420. Larger negative exponents, i.e. a narrower distribution, can be accounted for by increasing the maximum grain size. For instance, requires m. However, the range of appropriate exponents seemed to be quite small and steeper declining distributions led to significantly worse fits.
Assuming a density distribution for both shells and K gives the best fit for and (Fig. 6). This model can be improved by introducing a somewhat flatter density distribution, viz. , for the outer shell leading to a better match with the observed SED for m. The quality of the visibility fit remains almost unchanged (Fig. 10). Both models show a somewhat larger curvature of the visibility at low spatial frequencies. However, the deviations are within the observational uncertainties. The various flux contributions at 2.11 m are 62.2% stellar light, 26.1% scattered radiation and 10.7% dust emission.
Alternatively one may increase the temperature at the inner boundary of the hot shell to K which gives somewhat better matches to the near-infrared flux and lowers the low-frequency visibility curvature. To counteract the concomitant loss of flux in the far-infrared one has to assume a density distribution (Fig. 13). The fit to the silicate features is, however, somewhat worse than in the case of the K model.
The intensity distribution was found to be ring-like. This appears to be typical for optically thin shells (here , ; see also Ivezić & Elitzur 1996) showing limb-brightened dust-condensation zones. Accordingly, the interpretation of the observational data by FWHM Gauß diameters may give misleading results.
The two components can be interpreted as if IRC +10 420 has suffered from much higher mass-loss rates in its recent past than today. For instance, the K model gives and . The kinematic age of the outer component gives a corresponding timescale of yr (for kpc). If K both shells are located closer to the central star by approximately 30% leading to a correspondingly smaller timescale. The failure of constant mass-loss wind models to fit the SED agrees with the findings of Oudmaijer et al. (1996) and Humphreys et al. (1997). A previous high mass-loss episode is in line with the suspected post-RSG stage of IRC +10 420.
Although, the present observations give only marginal evidence for deviation from spherical symmetry (if elliptical, position angle of the long axis , axis ratio to 1.1), the hot shell may also be interpreted as a disk with a typical diameter of approximately 50 mas. The presence of a rotating equatorial disk has been proposed by Jones et al. (1993), and Oudmaijer et al. (1996) interpreted their hot dust-shell as a disk as well. Provided the disk is not viewed pole-on, the corresponding two-dimensional power spectra should be clearly elongated. It should be noted, however, that disks with an extension of typically 50 mas can only be detected in the power spectra if they provide at least, say, 10% of the total flux. Oudmaijer (1995) discussed several models for the circumstellar shell of IRC +10 420 and found neither a bipolar nor a disk-like wind to be consistent with optical and infrared high-resolution spectroscopy. This seems to be supported by the present observations. In order to be in line with optical blue-shifted emission lines and red-shifted absorption lines Oudmaijer suggested the scenario of infall of circumstellar material onto the stellar photosphere. However, according to Klochkova et al. (1997) the concept of accretion does not appear to be unproblematic either.
Thus, the question which scenario is best suited still appears to be a matter of debate. Bispectrum speckle interferometry gives important information on the spatial extension of the circumstellar shell. It will be in particular the combination of different observations - photometry, spectroscopy and high-resolution imaging - and their simultaneous modelling, which will shed more light on the nature of IRC +10 420 that is probably being witnessed in its transition to the Wolf-Rayet phase.
Acknowledgements.
The observations were made with the SAO 6 m telescope operated by the Special Astrophysical Observatory, Russia. We thank R. Oudmaijer for valuable discussions on this outstanding object and M.A.T. Groenewegen for providing us with the ’1992’ data set of the SED. The radiative-transfer calculations are based on the code DUSTY developed by Ž. Ivezić, M. Nenkova and M. Elitzur. A. Gauger and A. Men’shchikov are thanked for various discussions on radiative transfer problems. We are grateful to the referee for instructive remarks.References
- (1) Bowers P.F., 1984 ApJ 279, 350
- (2) Bowers P.F., Knapp G.R., 1989, ApJ 347, 325
- (3) Christou J.C., Ridgway S.T., Buscher D.F., Haniff C.A., McCarthy Jr. D.W., 1990, Astrophysics with infrared arrays, R. Elston (ed.), ASP conf. series 14, p. 133
- (4) Cobb M.L., Fix J.D., 1987, ApJ 315, 325
- (5) Craine E.R., Schuster W.J., Tapia S., Vrba F.J., 1976, ApJ 205, 802
- (6) David P., Pegourie B, 1995, A&A 293, 833
- (7) Diamond P.J., Norris R.P., Booth R.S., 1983, A&A 124, L4
- (8) Draine B.T., Lee H.M., 1984, ApJ 285, 89
- (9) Dyck H., Zuckerman B., Leinert C., Beckwith S., 1984, ApJ 287, 801
- (10) Fix J.D., Cobb M.L., 1987, ApJ 312, 290
- (11) García-Segura G., Langer N., Mac Low M-M., 1996, A&A 316, 133
- (12) Gauger A., Balega Y., Irrgang P., Osterbart R., Weigelt G., 1999, A&A, in press
- (13) Giguere P.T., Woolf N.J., Webber J.C., 1976, ApJ 207, L195
- (14) Groenewegen, M.A.T., 1997, A&A 317, 503
- (15) Hanson, M.M., Conti, P.S., Rieke,M.J., 1996, ApJS 107, 281
- (16) Hofmann K.-H., Weigelt G., 1986, A&A 167, L15
- (17) Humphreys R.M., Smith N., Davidson K. et al., 1997, AJ 114, 2778
- (18) Humphreys R.M., Strecker D.W., Murdock T.L., Low, F.J., 1973, ApJ 179, L49
- (19) Hrivnak B.J., Kwok S., Volk K.M, 1989, ApJ 346, 265.
- (20) Ivezić Ž., Elitzur M., 1996, MNRAS 279, 1019
- (21) Ivezić Ž., Elitzur M., 1997, MNRAS 287, 799
- (22) Ivezić Ž., Nenkova M. Elitzur M., 1997, User Manual for DUSTY, University of Kentucky (http://www.pa.uky.edu/m̃oshe/dusty)
- (23) Jones T.J., Humphreys R.M, Gehrz, R.D. et al., 1993, ApJ 411, 323
- (24) Kastner J., Weintraub D.A., 1995, ApJ 452, 833
- (25) Klochkova V.G., Chentsov E.L., Panchuk ,V.E., 1997, MNRAS 292,19
- (26) Knapp G.R., Morris M., 1985, ApJ 292, 640
- (27) Krüger D., Sedlmayr E., 1997, A&A 321, 557
- (28) Kurucz R.L., 1992, in The Stellar Populations of Galaxies, IAU Symp. 149, eds. B. Barbuy & A. Renzini, Kluwer, Dordrecht, p. 225
- (29) Labeyrie A., 1970, A&A 6, 85
- (30) Lohmann A.W., Weigelt G., Wirnitzer B., 1983, Appl. Opt. 22, 4028
- (31) Mathis J.S., Rumpl W., Nordsieck K.H., 1977, ApJ 217, 425 (MRN)
- (32) McLaren R.A., Betz A.L., 1980, ApJ 240, L159
- (33) Menten K.M., Alcolea J., 1995, ApJ 448, 416
- (34) Mutel R.L., Fix J.D., Benson J.M., Webber J.C., 1979, ApJ 228, 771
- (35) Nedoluha G.E., Bowers P.F., 1992, ApJ 392, 249
- (36) Oudmaijer R.D., 1995, PhD thesis, University of Groningen
- (37) Oudmaijer R.D., 1998, A&AS 129, 541
- (38) Oudmaijer R.D., Geballe T.R., Waters, L.B.F.M, Sahu K.C., 1994, A&A 281, L33
- (39) Oudmaijer R.D., Groenewegen M.A.T., Matthews H.E., Blommaert J.A.D.L, Sahu K.C., 1996, MNRAS 280, 1062
- (40) Ossenkopf V., Henning T., Mathis J.S., 1992, A&A 261, 567
- (41) Ridgway S.T., Joyce R.R., Connors D., Pipher J.L., Dainty C., 1986, ApJ 302, 662
- (42) Savage B.D., Mathis J.S., 1979, ARA&A 17, 73
- (43) Schaller G., Schaerer D., Meynet G., Maeder A., 1992, A&AS 96, 269
- (44) Suh K.W., Jones T.J., 1997, ApJ 479, 918
- (45) Walmsley C.M., Chini R., Kreysa E. et al., 1991, A&A 248, 555
- (46) Weigelt G., 1977, Optics Commun. 21, 55
- (47) Winters J.M., Fleischer A.J., Le Bertre T., Sedlmayr E., 1997, A&A 326, 305