Bar-driven Transport of Molecular Gas to Galactic Centers
and Its Consequences
Abstract
We study the characteristics of molecular gas in the central regions of spiral galaxies on the basis of our CO(J=1–0) imaging survey of 20 nearby spiral galaxies using the NRO and OVRO millimeter arrays. Condensations of molecular gas at galactic centers with sizescales kpc and CO-derived masses – are found to be prevalent in the gas-rich galaxies. Moreover, the degree of gas concentration to the central kpc is found to be higher in barred systems than in unbarred galaxies. This is the first statistical evidence for the higher central concentration of molecular gas in barred galaxies, and it strongly supports the theory of bar-driven gas transport. It is most likely that more than half of molecular gas within the central kpc of a barred galaxy was transported there from outside by the bar. The supply of gas has exceeded the consumption of gas by star formation in the central kpc, resulting in the excess gas in the centers of barred systems. The mean rate of gas inflow is statistically estimated to be larger than 0.1 – 1 yr-1.
There is no clear correlation between gas mass in the central kpc and the type of nuclear spectrum (HII, LINER, or Seyfert), suggesting that the amount of gas at this scale does not determine the nature of the nuclear activity. There is, however, a clear correlation for galaxies with larger gas-to-dynamical mass ratios to have HII nuclear spectra, while galaxies with smaller ratios show spectra indicating AGN. This trend may well be related to the gravitational stability of the nuclear gas disk, which is generally lower for larger gas mass fractions. It is therefore possible that all galaxies have active nuclei, but that dwarf AGN are overwhelmed by the surrounding star formation when the nuclear molecular gas disk is massive and unstable.
The theoretical prediction of bar-dissolution by condensation of gas to galactic centers is observationally tested by comparing gas concentration in barred and unbarred galaxies. If a bar is to be destroyed so abruptly that the gas condensation at the nucleus does not have enough time to be consumed, then there would be currently unbarred but previously barred galaxies with high gas concentrations. The lack of such galaxies in our sample, together with the current rates of gas consumption at the galactic centers, suggests that the timescale for bar dissolution is larger than – yr or a bar in a galaxy is not destroyed by a condensation of – gas in the central kpc.
keywords:
galaxies: dynamics and kinematics — galaxies: ISM — galaxies: spiral — galaxies: active — galaxies: starburst — galaxies: evolutionSakamoto et al. \rightheadBar-driven gas transport in galaxies
To appear in ApJ., vol. 525, No. 2, (10 Nov. 1999) issue.
1 Introduction
Stellar bars in disk galaxies have long been recognized as powerful tools to transport interstellar gas toward galactic centers (e.g., [Matsuda & Nelson 1977]; Simkin, Su, & Schwarz 1980). Gravitational torques from bars are much more efficient in gas transport on galactic scale than viscous torques (Combes, Dupraz, & Gerin 1990). Typically gas inflow rates of the order of 0.1 – 10 yr-1 have been obtained in numerical simulations of barred galaxies with ordinary amount of gas (e.g., [Friedli & Benz 1993]).
Two consequences of the bar-driven gas transport have been extensively investigated; fueling to (circum)nuclear star formation and to active galactic nuclei (AGN), and secular evolution of galaxies involving bar dissolution and bulge growth. Bursts of star formation in galactic centers ( kpc) consume – of gas in – years ([Balzano 1983]), and thus need the supply of gas as bars can provide. Active nuclei in barred galaxies may also benefit from the larger supply of infalling gas, though additional mechanisms may be necessary to deliver the gas from kpc to the nucleus (Shlosman, Frank, & Begelman 1989). Another aspect of the bar-driven gas transport is a significant mass transfer in galactic disks, possibly followed by drastic changes in the dynamical structure of galaxies. It is predicted that bars are destroyed if the bar-driven mass concentration at the nuclei is large enough, and that some of disk stars are added to bulges as a result of the bar dissolution ([Hasan & Norman 1990]; [Pfenniger & Norman 1990]). It has been inferred therefore that the formation-dissolution cycle of bars forces spiral galaxies to evolve from late to early Hubble types, in the direction of increasing bulge-to-disk ratios ([Friedli & Martinet 1993]; Hasan, Pfenniger, & Norman 1993).
On the observational side, there are three major pieces of evidence for bar-driven gas transport; metallicity gradients in galactic disks, estimates of gas inflow rates in a few barred galaxies, and statistics on H luminosity (and other tracers of star formation) in galactic centers. The radial gradients of metallicity in galactic disks are shallower in barred galaxies than in unbarred galaxies ([Vila-Costas & Edmunds 1992]; Zaritsky, Kennicutt, & Huchra 1994; [Martin & Roy 1994]). The shallower gradients in barred systems are attributed to better mixing of interstellar medium by bars. Metallicity gradients tell time-averaged effects of the bar-driven gas transfer, because the gradients are over galactic disks and hence vary on timescales larger than the dynamical time of the disks.
Estimates of gas inflow rate in barred galaxies have been obtained using near-IR and/or CO observations, but only in a few objects. Quillen et al. (1995) constructed a mass model of the bar in NGC 7479 from optical and near-IR images, calculated the torques to be exerted on the molecular gas seen in CO, and estimated a mass inflow rate. Benedict, Smith, & Kenney (1996) detected in CO large inward velocities at two positions near the center of a barred galaxy NGC 4314 and suggested a gas inflow, though the proof of net inflow was not provided. Regan, Vogel, & Teuben (1997) compared the H velocities in a barred galaxy NGC 1530 with hydrodynamical models and gas distributions to calculate the mass inflow rate. The estimated rates of gas flow are of the order of 0.1–10 yr-1 all directed inward. There is, however, a fundamental difficulty in the observational estimation of mass inflow. The gas flux into a region is a line integral (on the boundary of the region) of gas mass multiplied by inward velocity normal to the boundary. The inward velocities are not observable on the minor axis of a galaxy, and thus the inflow rate can not be usually measured without a gas dynamics model (e.g., Regan et al. 1997). The model usually needs multi-wavelength observations and assumptions on the mass-to-luminosity ratio, gas properties, the pattern speed of the bar, etc. Statistics on the gas inflow rates have not been obtained in this way, presumably owing to the complexity of the method. The estimated rates of gas inflow are current and instantaneous values, though they probably vary.
Luminosities of H and other tracers of star formation tend to be higher in the centers of barred galaxies than their unbarred counterparts (IR, [de Jong et al. 1984], [Hawarden et al. 1986], [Devereux 1987]; radio, [Hummel 1981]; H, Ho, Filippenko, & Sargent 1997b, among others). The enhanced star formation rates (SFRs) in barred nuclei have been attributed to abundant star-forming gas accumulated by bars, in an assumption that star formation efficiency is not systematically different in barred and unbarred nuclei. It has been also reported that the higher SFR in barred nuclei is evident in early-type spirals (S0/a–Sbc) but not so in late-type spirals (Sc–Sm), which is attributed to different properties of the bars ([Devereux 1987]; [Dressel 1988]; [Huang et al. 1996]; [Ho et al. 1997b]). The SFRs in galactic centers reflect time-integrated properties of bar-driven gas transport, because a central SFR likely correlates better with the amount of gas currently in the galactic center than with the rate of gas inflow to that region. Nevertheless the information provided by SFRs is statistical, and one can not tell much about the amount of gas in galactic centers because star formation efficiency is hardly constant over time or among galaxies.
Although all the pieces of evidence reviewed above point to bar-driven transport of gas to galactic centers, the evidence from direct observations of molecular gas, which is the gas to be transported in the inner regions of galaxies, has been very limited; and evidence from statistical studies of molecular gas is largely lacking. The only study based on observations of molecular gas in a sample of galaxies is, to our knowledge, that by Nishiyama (1995) who measured radial distributions of CO in disk galaxies at kpc resolutions. Excess gas in barred nuclei was suggested and attributed to viscous accretion (due to different rotation curves in barred and unbarred systems) and bar-driven accretion, though the statistical test for the excess was not provided. Observations of a broad sample of barred and unbarred galaxies are needed in order to clarify whether there really is more molecular gas in the centers of barred systems, how much gas there is and how the gas is distributed in galactic centers, and how the gas is related to nuclear star formation and AGN.
In this paper, we use the NRO-OVRO survey of nearby spiral galaxies ([Sakamoto et al. 1999]) to address the issues on bar-driven gas transport and its consequences. We show that condensations of molecular gas with sizes kpc and masses – are frequently seen at the centers of spiral galaxies, that the degree of gas concentration to the central kpc is higher in barred galaxies than unbarred systems, and that the amount of molecular gas in the central kpc does not correlate with the optical classification of nuclear activity (AGN or star formation). The higher gas concentration in barred galaxies is not only an important addition to the evidence for bar-driven gas transport but also a constraint to the rate of mass inflow and the fate of bars. The lack of correlation between the central gas mass and a detectable AGN forces us to reconsider the relation between gas and AGN.
2 The NRO-OVRO Survey
Our CO(J=1–0) imaging survey was conducted toward the central regions of 20 nearby spiral galaxies using the millimeter-wave interferometers at the Nobeyama Radio Observatory (NRO) and the Owens Valley Radio Observatory (OVRO). The principal goal of the survey was to determine the distribution and kinematics of molecular gas in a sample of nearby spiral galaxies selected with little bias on their morphologies and activities (such as starburst and Seyfert nuclei). It was intended that the survey provided a basic dataset for statistical studies on gas properties and gas-related phenomena in spiral galaxies. A companion paper ([Sakamoto et al. 1999], hereafter paper I) gives details of the design and basic results of the survey; relevant points are summarized below.
The 20 galaxies were selected with the following four criteria: (1) inclination ; (2) declination ; (3) integrated CO intensity in at least one position in the galaxy (usually at the center) in the FCRAO Extragalactic CO Survey ([Young et al. 1995]; [Kenney & Young 1988]); and (4) no evidence of significant perturbation (e.g., merging). All galaxies satisfying the above criteria except UGC 2855 were observed. No selection was made on the basis of nuclear activity, far-IR luminosity, and bar properties. The parameters of the sample galaxies are listed in Table 1. The distance of the galaxies ranges from 4 to 35 Mpc ([Tully 1988]), the average being 15 Mpc. Their morphological types in the Third Reference Catalogue (RC3; [de Vaucouleurs et al. 1991]) are SA:SAB:SB=10:9:1 and a:ab:b:bc:c:cd=1:4:2:9:2:2. Their blue-band and far-IR luminosities are (i.e., , roughly comparable to the Milky Way) and , respectively. The sample represents nearby ordinary galaxies with relatively bright CO emission in the central kiloparsecs to enable high resolution observations.
— Table 1 —
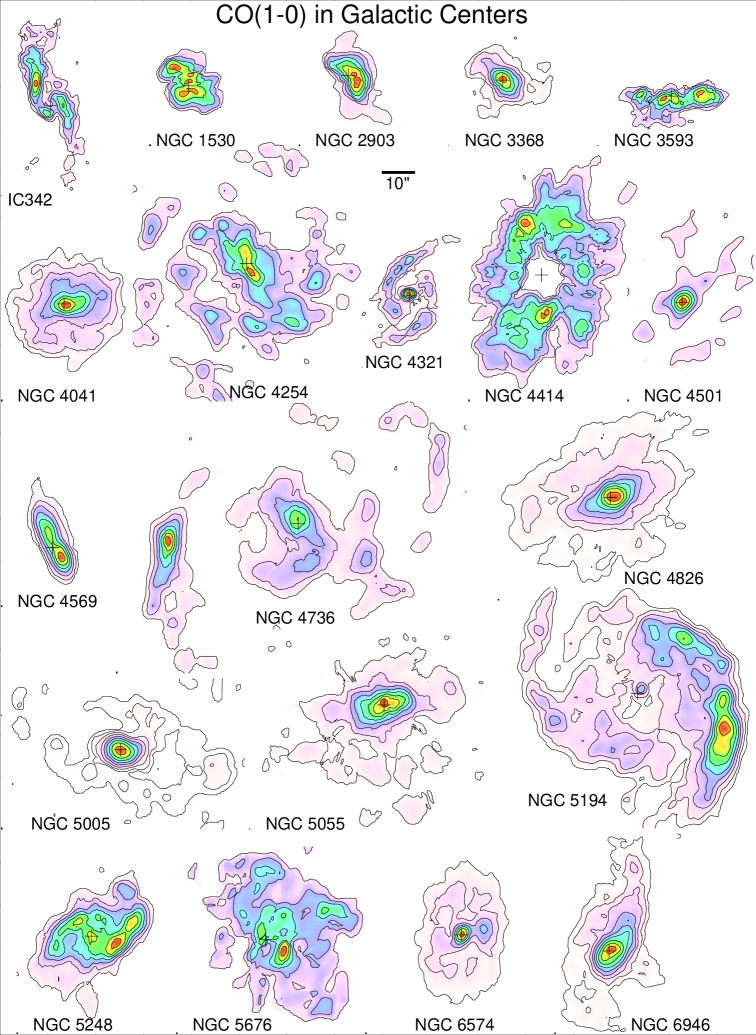
Our observations have a field of view of 1\arcmin (4 kpc at 15 Mpc), a mean resolution of 4\arcsec (300 pc at 15 Mpc), and velocity resolutions of 5 – 40 km s-1. The standard sensitivity of the survey was 40 mJy beam-1 () for a velocity resolution of 10 km s-1, equivalent to K for a 4\arcsec beam. The aperture synthesis observations recovered most of CO flux; the fraction of recovered flux was % on average. The integrated intensity maps are presented in Fig. 1.
— Fig. 1 —
3 Central Gas Condensations
3.1 Properties
The most apparent feature in the CO maps (Fig. 1) is that CO emission peaks toward galactic centers in most galaxies. The galactic centers marked in the maps are from paper I and are mostly dynamical centers determined from our CO observations. The central peaks of CO emission, which we call central gas condensations, are often very sharp and distinct and sometimes made of twin peaks or other subfeatures. The analysis of radial CO distributions in paper I showed that CO integrated intensities fall to of the central peaks at radii less than 500 pc in half of the galaxies, and at radii less than 1 kpc in 3/4 of the sample. These scale lengths of the nuclear CO emission are much smaller than the scale lengths of gas distributions in disks, which are usually a few kpc. The sub-kpc scale lengths are not artifacts of aperture synthesis observations, because we detected most of total flux (see discussion in paper I).
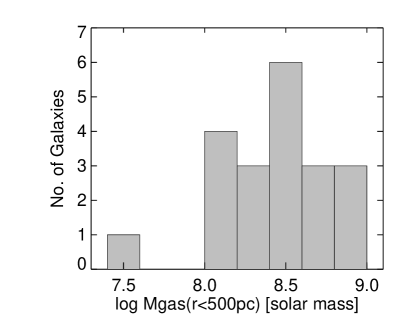
The mass of molecular gas in the central kpc of each galaxy is listed in Table 1, and its histogram is shown in Fig 2. The central gas masses are mostly in the range of – . The gas masses are calculated from CO using a Galactic CO-to-H2 conversion factor cm-2 (K km s-1)-1 ([Scoville et al. 1987]; [Solomon et al. 1987]; [Bloemen 1986]) with a correction factor 1.36 for He and heavy elements ([Allen 1973]). The uncertainty of due to the variation of metallicity is such that is in the range of 1 – 4 cm-2 (K km s-1)-1 (paper I), which is from the central metallicities and the metallicity– relation proposed by Wilson (1995) and Arimoto, Sofue, and Tsujimoto (1996).
— Fig. 2 —
Dynamical masses in the central kpc are calculated using the Keplerian formula, . The velocities at pc are measured from the CO position-velocity maps in paper I. The central dynamical masses are in the range of – . Fig. 3 compares the gas and dynamical masses in the central kpc.111 Three galaxies lack for the reasons given in Table 1, and hence are absent in the figure. The gas-to-dynamical mass ratio is typically 0.1, and 0.3 at maximum. The error of the Keplerian dynamical mass due to the flatness of mass distribution is at most 30 % for an exponential disk ([Binney & Tremaine 1987]). We did not attempt to subtract the effect of noncircular motions, because it needs detailed modeling of mass distribution and gas dynamics in individual galaxies (see, e.g., Wada, Sakamoto, & Minezaki 1998). The effects of noncircular motions tend to cancel out in statistical sense if many barred galaxies are observed from random viewing angles (see Appendix B of paper I).
— Fig. 3 —
Compact CO condensations at galactic centers, such as seen in this survey, have been seen in the Galaxy (Sanders, Solomon, & Scoville 1984) and in other nearby galaxies, e.g., NGC 1068 (Planesas, Scoville, & Myers 1991) and four galaxies in Kenney et al. (1992), in which three have twin-peak structure within the condensations. The scale (size and CO-derived mass) of these CO cores is similar to that found in our survey. Taken together, compact CO peaks (or central gas condensations) with sizes 1 kpc and CO-derived masses appear to be prevalent in large () galaxies, though there are certainly galaxies without such CO condensations (e.g., M31, [Dame et al. 1993]; M33, [Wilson & Scoville 1989]; NGC 4414, [Sakamoto 1996]).
3.2 What are they?
The most straightforward interpretation of the central CO peaks is that they are condensations of molecular gas at galactic centers, probably caused by dynamical mechanisms such as bar-induced transport of gas. Detailed analysis of one of the sample galaxies, NGC 4321, showed that it was indeed the case for this moderately barred galaxy ([Sakamoto et al. 1995]; [Wada et al. 1998]). Another possible interpretation of the CO condensations is that they are due to enhanced CO emissivity per unit mass of molecular gas, presumably caused by extreme physical conditions in galactic centers such as high pressure causing partly pressure-bound clouds ([Spergel & Blitz 1992]).
It is often argued that the CO-to-H2 conversion factor in the Galactic disk, which we adopt, may overestimate the gas mass in the Galactic center (e.g., [Sodroski et al. 1995]; [Oka et al. 1998]; [Dahmen et al. 1998]). It has not been possible, however, to determine the in each galactic center of our sample using the techniques applied for the Galactic center, and thus there has been no direct evidence that CO emissivities are high in the galaxies with CO cores. We note that the gas-to-dynamical mass ratios in the central kpc of our sample, , are not very high but comparable to that in the Galactic disk ([Sanders et al. 1984]), which seems to make it unlikely that the gas masses in the central regions are significantly overestimated with the Galactic conversion factor. We also note that the variation of the central gas masses in our sample, about an order of magnitude, is unlikely to be dominated by a random variation of . It is because if the in the galactic centers have a random scatter of a factor of then there would be no reasonable explanation for the correlation (discussed in §4) between bars and the degree of gas (CO) concentration. Therefore we interpret the CO condensations to be mostly due to peaks of molecular gas rather than enhanced CO emissivity, though of course some errors in the derived gas masses may exist.
We also have to consider whether the prevalence of the central CO peaks is due to some bias in our sample selection. The selection using single-dish CO flux certainly precludes galaxies devoid of CO emission in the central kiloparsecs. However, it is not directly biased toward galaxies with sub-kpc CO cores, because the single-dish beam (3.3 kpc in FWHM on average) is much larger than sub-kpc and hence the CO emission could be more uniformly distributed in the central few kpc. On the other hand, it is predicted that self-gravity of molecular gas, combined with perturbations from a bar or oval distortion, can efficiently drive the gas to the nucleus ([Wada & Habe 1992]). Our sample consists of galaxies with larger amount of molecular gas in their central regions than average (provided that CO luminosity traces gas mass). Thus, it is possible that the fraction of galaxies with central gas condensations is high in our sample because of the self-gravitational gas inflow.
4 Higher Concentration of Molecular Gas in Barred Galaxies
4.1 Index of gas concentration
To quantify the degree of gas concentration in each galaxy we use the ratio of the surface density of molecular gas averaged over the central kpc and that averaged over the whole optical disk, i.e.,
| (1) |
The central surface density, , is from our observations and the disk-averaged surface density, , is from the total CO flux of the galaxy (Young et al. 1995) and the galaxy’s de Vaucouleurs radius , which is the radius at a -band surface brightness of 25 mag arcsec-2. Young et al. (1995) observed CO emission along the major axes of the galaxies at 45\arcsec resolution to at least half of the optical radii , and, if CO emission was detected at multiple positions, extended the observations until no detectable emission was seen. The total CO fluxes were estimated from the radial distributions with uncertainties of % ([Young et al. 1995]). The surface densities and the concentration factors are listed in Table 1.
The concentration factor is robust against many possible biases as an index of gas concentration in galactic disks. First, it indicates the degree of gas concentration better than the amount of gas in the central region (e.g., ) because is not affected by the total amount of gas in the galaxy. Second, does not depend on galaxy distance if the distance is correct. A distance error would affect through the size of the averaging area but would not affect . Third, the missing flux in our observations does not change much, not only because we detected most of total flux but also because the extended missing flux must have much lower surface densities in the central kpc than the detected emission that is peaked at most galactic centers. Finally and most importantly, the uncertainty in the CO-to-H2 conversion factor does not directly affect the concentration factor. If is constant in each galaxy, then the constant value can be different from one galaxy to another without affecting , because the in and cancels out. This is true in a more general case where varies with radius but in the same manner, i.e., with being similar in galaxies. In this case, correctly indicates the degree of gas concentration even if the multiplier is different among galaxies. A probable cause for the variation of among galaxies is the metallicity– correlation (Wilson 1995; Arimoto et al. 1996) combined wit the different metallicity gradients in barred and unbarred galaxies (see §1). In barred galaxies, the shallower metallicity gradients tend to decrease than in unbarred systems. This possible bias, however, is opposite to what we observed (see below), and thus does not weaken our conclusion.
Figure 4 plots the central and disk-averaged surface densities of molecular gas and the gas concentration factors with different symbols for barred and unbarred galaxies. It clearly shows the higher degree of gas concentration in barred galaxies than in unbarred galaxies; the concentration factor is on average four times higher in barred systems. The Kolmogorov-Smirnov test shows that the difference in between barred and unbarred systems is statistically significant; the probability for the null hypothesis of no difference between the two classes is only .
— Fig. 4 —
The concentration factor may be biased by metallicity, as we mentioned, and may tend to be smaller in barred galaxies than unbarred systems for the same gas distribution. The correction for this would only increase the difference in between barred and unbarred galaxies. Fig. 5 plots versus . The barred galaxies in our sample have, on average, larger sizes than unbarred galaxies. Larger galaxies have lower and higher for the same total amount of gas. One might think for this reason that the higher in the barred systems in our sample is due to their larger sizes. However, since larger galaxies tend to have larger amount of gas (in our sample and in general), the bias in due to galaxy size is small. In any case, the higher in barred than unbarred systems is still observed when we set the mean of the two classes same by dropping four largest and four smallest galaxies. Figure 6 compares the total mass of molecular gas in each galaxy with the mass of molecular gas in the central kpc. The ratio of the two masses is another index of gas concentration, though it is more susceptible to galaxy size if larger galaxies have larger total gas mass (i.e., is roughly constant, for the same far-IR luminosity; see Casoli et al. 1998). The figure shows that for the same total mass of molecular gas, the gas masses in the central kpc are higher in barred galaxies than in unbarred galaxies, being consistent with our finding in Fig. 4. We conclude therefore that molecular gas is more concentrated to the central kpc in barred galaxies than in unbarred galaxies.
— Fig. 5 —
— Fig. 6 —
4.2 Bar-driven gas transport
The higher gas concentration in barred galaxies strongly supports the bar-driven transport of gas to galactic centers. The result is the first one that is based on observations of molecular gas, obtained from a sample of galaxies, and passed a statistical test. It is therefore complementary to the existing pieces of observational evidence for the bar-driven gas transport. In particular, our result supports the conjecture that the higher SFRs in barred nuclei is due to larger amount of star forming material there. Our sample is mostly in Sbc or earlier types and thus our result could explain the higher SFRs in the nuclei of barred early-type spirals.
The four-fold increase (on average) of the in barred galaxies provides an important clue on the amount of gas transported to the galactic centers. To increase by a factor of four in a galaxy, three times more gas than previously in the central kpc must be funneled there. One might think that barred galaxies originally had larger amount of gas in their centers. However, this seems less likely than the gas transport after galaxy formation, because some barred galaxies must have been formed from unbarred galaxies by tidal interactions. Thus it is most likely that more than half of molecular gas within the central kpc of barred galaxies was transported there from outside by bars. If the higher is solely due to the bar-driven gas transport then the amount of transported gas should be more than , excluding the gas that has been already consumed.
Finally we note on the distinction between barred and unbarred galaxies. We called SB and SAB galaxies in RC3 as barred and SA galaxies as unbarred. The SB and SAB classes are combined because we have only one SB galaxy (NGC 1530). In reality, the barred and unbarred classes are continuous rather than discrete. It is usual to find a weak bar or oval distortion in almost every disk galaxy when the galaxy is observed in red or near-IR light (e.g., [Zaritsky & Lo 1986]). Indeed, there are a few SA galaxies in our sample, e.g., NGC 4254 and 4736, that exhibit gas distributions probably caused by minor bars (paper I). On the other hand, some barred galaxies, e.g., NGC 5248 and 6946, may be regarded as unbarred galaxies with a pair of open spiral arms that mimics a bar (paper I; [Regan & Vogel 1995]). The morphological classification in RC3 is based on optical imagery of galaxies. Bars in our conclusion thus refer to the elongated structures recognizable (for those who classified the galaxies) in optical photographic images. Such bars must cause larger distortions in gravitational potential than small bars and weak oval distortions missed in the classification. Even if a bar really is made of open spiral arms, the elongated mass distribution causes the oval distortion in gravitational potential needed to transport gas. Therefore our result obtained using the optical classification is in accord with a reasonable conjecture that galaxies with stronger oval distortions have larger power to transport gas to their centers.
5 Fueling star formation and AGN
5.1 Star formation and gas supply
The higher concentration of molecular gas in barred galaxies not only demonstrates the power of stellar bars to fuel galactic centers but also constrains the relation between the supply and consumption of star forming gas in the central regions. The total amount of gas transported so far to the central kpc of barred galaxies must be larger than the total amount of gas consumed there mainly by star formation, because otherwise we would not see the higher in the barred nuclei. Dividing the above amounts of gas and stars by the age of the bar in each galaxy one obtains a constraint that the time-averaged rate of gas inflow must be larger than the time-averaged SFR in the central kpc, i.e.,
| (2) |
where is the inflow rate of gas to the central kpc and the angle brackets denote an average over the age of the bar. The ages of bars are likely different among galaxies in our sample. Therefore the above relation probably hold in a broad range of time (if not always) in the lifetime of a bar. The constraint (2) also gives a crude estimate of the time-averaged rate of gas inflow if one substitutes the time-averaged SFR with an ensemble average of current SFRs.
We estimate the SFR in the central kpc of each galaxy in two ways, from H and from far-IR. Derived SFRs are in Table 1. The SFRs from H and FIR agree well (except for NGC 5194) considering their uncertainties (at least a factor of a few for each). The H data are from the aperture observations of Ho et al. (1997a). In each galaxy, we estimate H luminosity of the central kpc assuming that the line intensity is uniform in the area, then correct it for extinction using the H to H ratio (Ho et al. 1997a), and calculate the SFR using the coefficient in Kennicutt, Tamblyn, & Congdon (1994). The SFRs are a factor of two lower (on average) if the H luminosities are estimated from the larger () aperture observations by Keel (1983). The far-IR data are from the IRAS survey, which are tabulated in the Table 2 of paper I along with the total FIR luminosities. The FIR luminosity from the central kpc is estimated using the ratio. We compute from ground-based observations (of 5\arcsec – 20 \arcsec apertures) assuming the uniformity of 10 \micron intensity in the central kpc, and by extrapolation from the IRAS 12 \micron data with a color correction ([Devereux 1987]). The conversion from to SFR uses the mean of the coefficients derived by Kennicutt (1998) and Buat & Xu (1996) for starbursts and more quiescent spirals (Sb and later), respectively.
The star formation rates in the central kpc of barred galaxies in our sample are mostly in the range of 0.1 – 1 yr-1. As we saw above, it gives a lower limit to the time-averaged rate of gas inflow . The value is consistent with theoretical predictions of 0.1–10 yr-1 and the instantaneous estimated in a few barred galaxies (see §1). Note that, however, the equation (2) does not require the current to be larger than the current SFR. It is possible that the mass inflow rate has been declining because the amount of gas available from the outer regions is limited, and that the SFR has been increasing as the star forming gas in the central region has been increasing. Thus the current could be below the current SFR and also below the lower limit of .
— Table 1 —
5.2 AGN and gas condensations
Figure 7 plots the gas and dynamical masses in the central kpc using symbols according to the types of nuclear activity, which are from optical spectroscopy by Ho et al. (1997a). By looking only the gas masses, the vertical axis of the plot, it is apparent that the amount of gas in the central kpc does not determine the type of nuclear activity; the gas masses are not different for HII, transition type (= intermediate type between LINER and HII), and LINER or Seyfert nuclei. In particular, we note that the large amounts of gas concentrated within 500 pc are not necessarily accompanied by AGN, which is in Seyferts and probably in LINERs and transition nuclei. A similar result has been obtained by Vila-Vilaro et al. (1999) who made a CO survey of Seyfert and non-Seyfert galaxies (Vila-Vilaro, Taniguchi, & Nakai 1998) and did not find a significant difference in the amount of molecular gas in their 16\arcsec ( kpc) beam. These results suggest that the gas fueling to this scale ( pc) does not determine the nature of the nuclear activity. This could explain why no correlation is found between bars and Seyfert activity ([Ho et al. 1997b]; [Mulchaey & Regan 1997]) despite the higher concentration of molecular gas in barred nuclei as we saw in §4.
— Fig. 7 —
Figure 7 also shows a segregation between HII nuclei and active nuclei (i.e., Seyfert, LINER, and transition) according to the gas-to-dynamical mass ratio. The gas-to-dynamical mass ratios in HII nuclei are significantly larger than those in active nuclei222 We could not measure / in three galaxies from our data. For IC 342, however, Sage & Solomon (1991) obtained within kpc. If corrected for the distance of 3.9 Mpc adopted by us, or for Mpc adopted by Turner & Hurt (1992), / would be 0.32 within 1.3 kpc and 0.15 within 0.6 kpc, respectively. (.) The gas-to-dynamical mass ratio inside 0.5 kpc is probably larger than the above values, because of the gas central concentration in IC 342. Even the smallest value of / = 0.15 is larger than the apparent boundary of between HII and AGN classes, being consistent with the HII type of IC 342. Thus it would just strengthen our observation if IC 342 could be plotted in Fig. 7. , judging from the Kolmogorov-Smirnov test (the probability for no difference is ). The larger gas-to-dynamical mass ratios (and hence smaller values [see below]) in non-AGN galaxies than in galaxies with active nuclei have also been noticed by Vila-Vilalo et al. (1999) and Kohno et al. (1999).
A straightforward interpretation for this is that galaxies with larger amounts of gas for their sizes have more active star formation, resulting in nuclear spectra dominated by HII regions. A simple assessment of the stability of the nuclear gas disk supports this idea. If a uniform gas disk with a surface density has a rotational velocity at a radius , its gas-to-dynamical mass ratio within is . The stability parameter of the same disk ([Safronov 1960]; [Toomre 1964]) is where and are epicycle frequency and gas velocity dispersion, respectively. We have used the fact that the rotation curves are steeply rising in the nuclear regions (paper I) and hence the epicyclic frequency is . The two parameters have a relation
| (3) |
Thus the gas-to-dynamical mass ratio is closely related to the parameter. Numerically, is unity for typical values of km s-1 and km s-1 when is 0.1. The gas disk is unstable when is below unity, and the disk instability likely results in cloud formation and subsequent star formation. Therefore it is not surprising that HII nuclei appear predominantly above the line of .
The average H luminosity of the HII nuclei is larger than that of the active nuclei (see Table 1), though the sample is very small. Therefore it is possible that emission from a dwarf AGN, which may exist in most spiral galaxies, is overwhelmed by the emission from nuclear HII regions when the nuclear gas disk is unstable, resulting in the HII spectral classification for the galaxy. Such hidden AGN in HII nuclei have been inferred from models of diagnostic line ratios with more than one type of ionizing source, and from optical spectroscopy at high-spatial resolutions (e.g., Kennicutt, Keel, & Blaha 1989). Similar situations may be prevalent.
— Table 1 —
There are of course caveats for the above argument on disk stability, and there exist other possible causes that could explain the lack of correlation between the central gas mass and AGN. The errors in the values include the uncertainty of and likely internal structure in the CO cores. The alternative causes for the apparent independence of gas mass and AGN include the difficulty of delivering gas from pc to the central accretion disk, the small ( pc) central holes of gas that are inferred in several galaxies (paper I), and the higher chance of obscuration for the AGNs in gas-rich nuclei. Probably all of these, including the effect of disk stability, contribute to the relation between the central gas mass and the appearance of emission line spectrum.
6 Constraints on Secular Evolution
Theoretically it is predicted that the bar-driven transport of significant amount of gas to the center of a galaxy eventually destroys the bar ([Hasan & Norman 1990]; [Pfenniger & Norman 1990]; [Friedli & Benz 1993]). The critical mass for the bar dissolution has been estimated to be about 5 % of the total mass of disk and bulge for the model of Norman, Selwood, & Hasan (1996). For the Galaxy, which is comparable to our sample, the total mass of disk and bulge is about ([Dehnen & Binney 1998]), and the critical mass is a few . The timescale for the bar dissolution is very short, being comparable to the dynamical timescale of the bar or a few yr ([Norman et al. 1996]). However, as noted by Norman et al. (1996), there are many parameters involved in the bar dissolution, and they may well change the critical mass and the dissolution timescale. For example, the following parameters have not been fully explored; the shape of the bar, that of the disk, and the spatial distribution of funneled gas in the central regions (some simulations use a central point source with a variable mass instead of a gas condensation with finite extent). In a different model, a bar was destroyed by a smaller amount of mass concentration, 0.5 % of the disk mass or a few for the Galaxy, at a longer timescale of a few yr ([Hozumi & Hernquist 1998]). Berentzen et al. (1998) also obtained a longer timescale for bar dissolution, yr or rotations, in their (stars + gas in a halo) model of a galaxy.
Our observations can constrain the timescale as well as the critical mass of the bar dissolution. First, our sample galaxies are among galaxies with largest amount of molecular gas in their inner regions ( kpc) and hence their gas masses in the galactic centers, – , are probably among the largest in ordinary spiral galaxies. Thus if these gas condensations (plus the amount of stars formed from the gas) are not enough to destroy bars, then the bar-dissolution would be rare in galaxies of similar scales (). Second, if a bar can be destroyed by a gas condensation of – , then the different degree of gas concentration between barred and unbarred galaxies constrains the lifetime of the bars. It is because the bars responsible for the higher gas concentrations must be alive until a large part of the funneled gas is consumed; otherwise we would frequently observe currently unbarred (but previously barred) galaxies with high degree of gas concentration due to the destroyed bars. This argument leads to a constraint on timescales for bar dissolution and gas consumption,
| (4) |
The gas consumption time may be evaluated using the current SFR and the current mass of molecular gas in the central region.
| (5) |
The inequality is due to the ignored return of gas from stars and the supply of gas by a bar, though the latter might be small in old barred galaxies because of the limited supply of gas from the outer regions. At the current SFR of 0.1 – 1 yr-1 the consumption times of the central gas condensations of – are larger than – yr. The smallest value does not contradict with the shortest timescale predicted by simulations. On the other hand, if larger values are the case in many spiral galaxies, then the bar dissolution would take longer time than predicted or would not be caused by a gas concentration of – . The latter case does not contradict with the critical mass estimated by Norman et al. (1996), but makes the bar dissolution in galaxies a rare phenomenon caused only by exceptionally large transport of gas.
The above argument on the timescales for bar dissolution and gas consumption is an exploratory one, and may involve considerable errors for individual galaxies because, for example, the gas consumption may be much faster owing to episodic starbursts. However, statistical analysis of this kind is one of a few ways to observationally constrain the evolution of bars, and thus worthwhile to pursue. Also, the measurement of the gas concentration is a way to find out galaxies with young bars and galaxies whose bars have been recently destroyed. The former would have low for barred galaxies, while the latter would have high () for unbarred galaxies. There probably are galaxies with young bars in interacting systems ([Noguchi 1988]). The galaxies in which bars have recently been destroyed would be most interesting to discover in order to elucidate the conditions and mechanisms for bar dissolution.
7 Conclusions
From our CO(1–0) imaging survey of the central regions of 20 nearby spiral galaxies, we find:
1. Strong peaks of CO emission, with radial scale lengths pc and CO-derived masses – in the central kpc, are prevalent in the nuclei of gas-rich spiral galaxies. These central gas condensations constitute about 10% of the dynamical masses in the central kpc.
2. Molecular gas is more concentrated to the central kpc in barred galaxies than in unbarred systems. This strongly supports the theory of bar-driven gas transport to galactic centers. More than half of molecular gas within the central kpc of barred galaxies was transported there from outside by bars.
3. The higher gas concentration in barred galaxies suggests that the statistically higher SFRs in barred nuclei are due to abundant star-forming material there, and that star formation in the nuclear regions has not been able to catch up with the supply of gas by bars. A lower limit to the time-averaged rate of mass inflow to the central kpc is 0.1 – 1 yr-1.
4. No correlation is found between nuclear activity (AGN) and the mass of molecular gas within 500 pc of the nucleus. The similar incidence of AGN between barred and unbarred galaxies is thus not due to the problem of bars to transport gas to the central kpc but must be due to the difficulties in gas fueling within the central kpc and in detecting the dwarf AGN.
5. The gas-to-dynamical mass ratio in the central kpc is higher in galaxies with HII spectral classification than in galaxies having an AGN, with the dividing line at . It may well be related to the stability of the nuclear molecular gas disk, which is lower when is high. In HII galaxies, star formation triggered by the instability may be overwhelming dwarf active nuclei.
6. The different degrees of gas concentration in barred and unbarred galaxies would not have been observed if gas condensations of – in the central kpc could destroy bars on a timescale shorter than the gas consumption times. The gas consumption time, or a lower limit to the bar dissolution timescale, is in the range of – yr. The lowest value does not contradict models of bar dissolution while the highest value implies that bar dissolution is not caused by the – gas condensations in galaxies. Measurement of gas concentration in more galaxies would provide an observational test on the bar dissolution scenario.
Acknowledgements.
We are grateful to NRO and OVRO for the generous allotments of observing time, and to the observatory staffs whose work on the arrays enabled our survey. Discussions with colleagues at NRO and Caltech/OVRO, in particular comments from Andrew Baker to an early draft, greatly helped to clarify our points. We also thank the referee, Dr. Jean Turner, for her valuable comments and suggestions. K.S. is supported by Grant-in-Aid for JSPS Fellows. OVRO is funded by NSF grant AST 96-13717.References
- [Allen 1973] Allen, C. W. 1973, “Astrophysical Quantities (3rd. ed.)”, (The Athlone Press)
- [Arimoto et al. 1996] Arimoto, N., Sofue, Y. & Tsujimoto, T. 1996, PASJ, 48, 275
- [Balzano 1983] Balzano, V. A. 1983, ApJ, 268, 602
- [Becklin et al. 1980] Becklin, E. E., Gatley, I., Matthews, K., Neugebauer, G., Sellgren, K., Werner, M. W., & Wynn-Williams, C. G. 1980, ApJ, 236, 441
- [Benedict et al. 1996] Benedict, G. F., Smith, B. J., & Kenney, J. D. P. 1996, AJ, 111, 1861
- [Berentzen et al. 1998] Berentzen, I., Heller, C. H., Shlosman, I., & Fricke, K. J. 1998, MNRAS, 300, 49
- [Binney & Tremaine 1987] Binney, J. & Tremaine, S. 1987, “Galactic Dynamics”, (Princeton Univ. Press), p. 78
- [Bloemen 1986] Bloemen, J. B. G. M. et al. 1986, A&A, 154, 25
- [Buat & Xu 1996] Buat, V. & Xu, C. 1996, A&A, 306, 61
- [Casoli et al. 1998] Casoli, F., Sauty, S., Gerin, M., Boselli, A., Fouqué, Braine, J., Gavazzi, G., Lequeux, J., & Dickey, J. 1998, A&A, 331, 451
- [Cizdziel et al. 1985] Cizdziel, P. J., Wynn-Williams, C. G., & Becklin, E. E. 1985, AJ, 90, 731
- [Combes et al. 1990] Combes, F., Dupraz, C., & Gerin, M. 1990, in “Dynamics of Interactions of Galaxies”, ed. R. Wielen (Springer), 205
- [Dahmen et al. 1998] Dahmen, G., Hűttemeister, S., Wilson, T. L., & Mauersberger, R. 1998, A&A, 331, 959
- [Dame et al. 1993] Dame, T. M., Koper, E., Israel, F. P., & Thaddeus, P. 1993, 418, 730
- [Dehnen & Binney 1998] Dehnen, W., & Binney, J. 1998, MNRAS, 294, 429
- [de Jong et al. 1984] de Jong, T., Clegg, P. E., Soifer, B. T., Rowan-Robinson, M., Habing, H. J., Jouck, J. R., Aumann, H. H., & Raimond, E. 1984, ApJ, 278, L67
- [de Vaucouleurs et al. 1991] de Vaucouleurs, G., de Vaucouleurs, A., Corwin, H. G., Buta, R. J., Paturel, G., & Fouque, P. 1991, “Third Reference Catalogue of Bright Galaxies”, (Springer)
- [Devereux 1987] Devereux, N. 1987, ApJ, 323, 91
- [Devereux et al. 1987] Devereux, N., Becklin, E. E., & Scoville, N. Z. 1987, ApJ, 312, 529
- [Dressel 1988] Dressel, L. L. 1988, ApJ, 329, L69
- [Friedli & Benz 1993] Friedli, D. & Benz, W. 1993, A&A, 268, 65
- [Friedli & Martinet 1993] Friedli, D. & Martinet, L. 1993, A&A, 277, 27
- [Hasan & Norman 1990] Hasan, H. & Norman, C. 1990, ApJ, 361, 69
- [Hasan, Pfenniger, & Norman 1993] Hasan, H., Pfenniger, D. & Norman, C. 1993, ApJ, 409, 91
- [Hawarden et al. 1986] Hawarden, T. G., Mountain, C. M., Leggett, S. K., & Puxley, P. J. 1986, MNRAS, 221, 41p
- [Ho et al. 1997a] Ho, L. C., Filippenko, A. V., & Sargent, W. L. W. 1997a, ApJS, 112, 315
- [Ho et al. 1997b] Ho, L. C., Filippenko, A. V., & Sargent, W. L. W. 1997b, ApJ, 487, 591
- [Hozumi & Hernquist 1998] Hozumi, S., & Hernquist L. 1998, submitted to ApJ, (astro-ph/9806002)
- [Huang et al. 1996] Huang, J. H., Gu, Q. S., Su, H. J., Hawarden, T. G., Liao, X. H., & Wu, G. X. 1996, A&A, 313, 13
- [Hummel 1981] Hummel, E. 1981, A&A, 93, 93
- [Keel 1983] Keel, W. C. 1983, ApJS, 52, 229
- [Kenney & Young 1988] Kenney, J. D. P., & Young, J. S. 1988, ApJS, 66, 261
- [Kenney et al. 1992] Kenney, J. D., Wilson, C. W., Scoville, N. Z., Devereux, N. A., & Young, J. S. 1992, ApJ, 395, L79
- [Kennicutt et al. 1989] Kennicutt, R. C., Keel, W. C., & Blaha, C. A. 1989, AJ, 97, 1022
- [Kennicutt et al. 1994] Kennicutt, R. C., Tamblyn, P., & Congdon, C. W. 1994, ApJ, 435, 22
- [Kennicutt 1998] Kennicutt, R. C. 1998, ApJ, 498, 541
- [Kohno et al. 1999] Kohno, K., Kawabe, & R., Vila-Vilaro, B. 1999, in “The Physics and Chemistry of the Interstellar Medium” (proceedings of the 3rd Cologne-Zermatt Symposium), in press, (astro-ph/9902251)
- [Martin & Roy 1994] Martin, P. & Roy, J.-R. 1994, ApJ, 424, 599
- [Matsuda & Nelson 1977] Matsuda, T., & Nelson, A. H. 1977, Nature, 266, 608
- [Mulchaey & Regan 1997] Mulchaey, J. S., & Regan, M. W. 1997, ApJ, 482, L135
- [Nishiyama 1995] Nishiyama K. 1995, Ph. D. thesis, The Graduate University for Advanced Studies
- [Noguchi 1988] Noguchi, M. 1988, A&A, 203, 259
- [Norman et al. 1996] Norman, C., Sellwood, J. A., & Hasan, H. 1996, ApJ, 462, 114
- [Oka et al. 1998] Oka, T., Hasegawa, T., Hayashi, M., Handa, T., & Sakamoto, S. 1998, ApJ, 493, 730
- [Pfenniger & Norman 1990] Pfenniger, D. & Norman, C. 1990, ApJ, 363, 391
- [Planesas et al. 1991] Planesas, P., Scoville, N., & Myers, S. T. 1991, ApJ, 369, 364
- [Quillen et al. 1995] Quillen, A. C., Frogel, J. A., Kenney, J. D. P., Pogge, R. W., & DePoy, D. L. 1995, ApJ, 441, 549
- [Regan & Vogel 1995] Regan, M. W., & Vogel, S. N. 1995, ApJ, 452, L21
- [Regan et al. 1997] Regan, M. W., Vogel, S. N., & Teuben, P. J. 1997, ApJ, 482, L143
- [Rieke 1976] Rieke, G. H. 1976, ApJ, 206, L15
- [Safronov 1960] Safronov, V. S. 1960, Annales d’Astrophysiquie, 23, 979
- [Sage & Solomon 1991] Sage, L., & Solomon, P. M. 1991, ApJ, 380, 392
- [Sakamoto et al. 1995] Sakamoto K., Okumura S., Minezaki T., Kobayashi Y., & Wada K. 1995, AJ, 110, 2075
- [Sakamoto 1996] Sakamoto, K. 1996, ApJ, 173, 471
- [Sakamoto et al. 1999] Sakamoto, K., Okumura, S., Ishizuki, S. & Scoville, N. Z. 1999, ApJS, 124 (Oct. 10 issue), in press (paper I)
- [Sanders et al. 1984] Sanders, D. B., Solomon, P. M., & Scoville, N. Z. 1984, ApJ, 276, 182
- [Scoville et al. 1987] Scoville, N. Z., Yun, M. S., Clements, D. P., Sanders, D. B., & Walker, W. H. 1987, ApJS, 63, 821
- [Shlosman et al. 1989] Shlosman, I., Frank, J., & Begelman, M. C. 1989, Nature, 338, 45
- [Simkin et al. 1980] Simkin, S. M., Su, H. J., & Schwarz, M. P. 1980, ApJ, 237, 404
- [Sodroski et al. 1995] Sodroski, T. J. et al. 1995, ApJ, 452, 262
- [Solomon et al. 1987] Solomon, P. M., Rivilo, A. R., Barrett, J., & Yahil, A. 1987, ApJ, 319, 730
- [Spergel & Blitz 1992] Spergel, D. N., & Blitz, L. 1992, Nature, 357, 665
- [Telesco et al. 1986] Telesco, C. M., Decher, R., & Gatley, I. 1986, ApJ, 302, 632
- [Toomre 1964] Toomre, A. 1964, ApJ, 139, 1217
- [Tully 1988] Tully, R. B. 1988, “Nearby Galaxies Catalog”, (Cambridge University Press)
- [Turner & Hurt 1992] Turner, J. L., & Hurt, R. L. 1992, ApJ, 384, 72
- [Vila-Costas & Edmunds 1992] Vila-Costas, M. B. & Edmunds, M. G. 1992, MNRAS, 259, 121
- [Vila-Vilaro et al. 1998] Vila-Vilaro, B., Taniguchi, Y., & Nakai, N. 1998, AJ, 116, 1553
- [Vila-Vilaro et al. 1999] Vila-Vilaro, B., Taniguchi, Y., & Nakai, N. 1999, submitted to AJ
- [Wada & Habe 1992] Wada, K., & Habe, A. 1992, MNRAS, 258, 82
- [Wada et al. 1998] Wada, K., Sakamoto, K., & Minezaki, T. 1998, ApJ, 494, 236
- [Wilson 1995] Wilson, C. D. 1995, ApJ, 448, L97
- [Wilson & Scoville 1989] Wilson, C. D., & Scoville, N. Z. 1989, ApJ, 347, 743
- [Wynn-Williams & Becklin 1985] Wynn-Williams, C. G., & Becklin, E. E. 1985, ApJ, 290, 108
- [Young et al. 1995] Young, J. S., et al. 1995, ApJS, 98, 219
- [Zaritsky et al. 1994] Zaritsky, D., Kennicutt, R. C., & Huchra, J. H. 1994, ApJ, 420, 87
- [Zaritsky & Lo 1986] Zaritsky, D., Lo, K. Y. 1986, ApJ, 303, 66
| name | morph. typeaaMorphological classification in the RC3 (de Vaucouleurs et al. 1991). | classbbSpectral classification of the nucleus taken from Ho et al. (1997a). H = HII nucleus, S = Seyfert nucleus, L = LINER, T = Transition object (= HII + LINER). The number designates the type (e.g., S2 is a type 2 Seyfert nucleus.) | ccGalaxy distance derived in Tully (1988) using km s-1Mpc-1 with correction for the Virgocentric inflow. | ddIsophotal radius at 25 mag arcsec-2 in -band, which is corrected for extinction and inclination and from RC3 (de Vaucouleurs et al. 1991). | eeGas mass within 500 pc from the nucleus. | ffDynamical mass in 500 pc of the nucleus. Three galaxies do not have for the following reasons: (IC342) no gas to measure velocity is at a radius of 500 pc on the major axis; (NGC 1530) spatial resolution is insufficient to determine the rotation curve; and (NGC 4569) very large noncircular motion in the p-v map in Sakamoto et al. (1999). | ggGas-to-dynamical mass ratio within 500 pc of the nucleus. | hhMean surface density of molecular gas averaged within 500 pc from the nucleus. | iiSurface density of molecular gas averaged over the galactic disk, which is derived from the total CO flux (Young et al. 1995) and the optical size of the galaxy . | jjConcentration factor of molecular gas, . |
|---|---|---|---|---|---|---|---|---|---|---|
| Mpc | kpc | % | pc-2 | pc-2 | % | |||||
| IC 342 | SAB(rs)cd | H | 3.9 | 25.4 | 22.4 | 285 | 3.5 | 81.1 | ||
| NGC 1530 | SB(rs)b | 36.6 | 27.7 | 42.8 | 545 | 4.3 | 127.6 | |||
| NGC 2903 | SAB(rs)bc | H | 6.3 | 11.5 | 22.2 | 1.5 | 14.8 | 283 | 4.2 | 68.1 |
| NGC 3368 | SAB(rs)ab | L2 | 8.1 | 9.0 | 33.3 | 12.0 | 2.8 | 424 | 2.5 | 166.9 |
| NGC 3593 | SA(s)0/a | H | 5.5 | 3.9 | 12.9 | 2.4 | 5.4 | 164 | 9.1 | 18.0 |
| NGC 4041 | SA(rs)bc | H | 22.7 | 8.9 | 47.2 | 1.5 | 31.5 | 601 | 24.1 | 24.9 |
| NGC 4254 | SA(s)c | H | 16.8 | 13.7 | 25.5 | 1.2 | 21.2 | 325 | 23.0 | 14.1 |
| NGC 4321 | SAB(s)bc | T2 | 16.8 | 18.6 | 37.1 | 3.1 | 12.0 | 472 | 13.9 | 34.0 |
| NGC 4414 | SA(rs)c | T2: | 9.7 | 5.1 | 3.3 | 3.7 | 0.9 | 42 | 50.9 | 0.8 |
| NGC 4501 | SA(rs)b | S2 | 16.8 | 17.4 | 31.5 | 2.3 | 13.7 | 401 | 10.6 | 37.9 |
| NGC 4569 | SAB(rs)ab | T2 | 16.8 | 24.0 | 75.1 | 956 | 3.8 | 254.5 | ||
| NGC 4736 | (R)SA(r)ab | L2 | 4.3 | 7.0 | 10.7 | 5.6 | 1.9 | 136 | 4.9 | 27.7 |
| NGC 4826 | (R)SA(rs)ab | T2 | 4.1 | 6.3 | 25.1 | 4.8 | 5.2 | 320 | 4.7 | 67.5 |
| NGC 5005 | SAB(rs)bc | L1.9 | 21.3 | 18.0 | 82.5 | 12.9 | 6.4 | 1050 | 9.0 | 116.6 |
| NGC 5055 | SA(rs)bc | T2 | 7.2 | 13.2 | 26.1 | 3.7 | 7.1 | 332 | 8.6 | 38.7 |
| NGC 5194 | SA(s)bc | S2 | 7.7 | 12.5 | 12.1 | 3.5 | 3.5 | 154 | 17.7 | 8.7 |
| NGC 5248 | SAB(rs)bc | H | 22.7 | 20.5 | 38.7 | 1.9 | 20.4 | 493 | 7.4 | 66.2 |
| NGC 5676 | SA(rs)bc | H | 34.5 | 20.1 | 12.8 | 0.9 | 14.1 | 163 | 15.9 | 10.2 |
| NGC 6574 | SAB(rs)bc | 35.0 | 8.7 | 80.8 | 6.7 | 12.1 | 1029 | 56.6 | 18.2 | |
| NGC 6946 | SAB(rs)cd | H | 5.5 | 13.3 | 58.8 | 3.7 | 15.9 | 749 | 10.8 | 69.3 |
llcccccc \tablecaptionStar formation rates in galactic centers \tablewidth0pt \tablehead \colheadname & SFR( kpc) \colheadref. \nl\colhead yr-1 \colhead \nl\colhead(1) \colhead(2) \colhead(3) \colhead(4) \startdataIC 342 0.87 0.53 1 \nlNGC 1530 \nodata \nodata \nodata\nlNGC 2903 1.12 0.48 2 \nlNGC 3368 0.44 0.11 3 \nlNGC 3593 0.26 \nodata \nodata\nlNGC 4041 0.78 \nodata \nodata\nlNGC 4254 0.28 \nodata \nodata\nlNGC 4321 0.24 0.14 4 \nlNGC 4414 0.02\tablenotemarka \nodata \nodata\nlNGC 4501 0.08 0.03 4 \nlNGC 4569 1.26 0.22 4 \nlNGC 4736 0.09 0.38 3 \nlNGC 4826 0.56 0.34 3 \nlNGC 5005 0.10\tablenotemarka 0.29 4 \nlNGC 5055 0.12 \nodata \nodata\nlNGC 5194 3.46 0.06 5 \nlNGC 5248 0.76 \nodata \nodata\nlNGC 5676 0.02 \nodata \nodata\nlNGC 6574 \nodata \nodata \nodata\nlNGC 6946 2.95 0.56 6 \nl\enddata\tablecomments Col. (1): Galaxy name. Col. (2): SFR in the central kpc estimated from H (see text). [ yr-1] = [erg s-1] (Kennicutt et al. 1994). Extinction is corrected using the H/H ratio with the assumed intrinsic ratio of 2.86. Col. (3): SFR in the central kpc estimated from infrared data (see text). [ yr-1] = []. Col. (4): References for 10 \micron data. 1. Becklin et al. (1980); 2. Wynn-Williams & Becklin (1985); 3. Cizdziel, Wynn-Williams, & Becklin (1985); 4. Devereux, Becklin, & Scoville (1987); 5. Telesco, Decher, & Gatley (1986); 6. Rieke (1976) \tablenotetextaCorrection for extinction is not made.
lccccc \tablecaptionAverage parameters in the galactic centers \tablewidth0pt \tablehead \colheadclass \colhead(pc) \colhead(pc) \colhead \colhead \colheadSFR(pc)\tablenotemarka \nl\colhead \colhead \colhead \colhead% \colhead \colhead yr-1 \startdataSB+SAB (10) ( 7) ( 7) (10) (8) \nlSA (10) (10) (10) (10) (9) \nlHII ( 8) ( 7) ( 7) ( 8) (8) \nlTransition ( 5) ( 4) ( 4) (5) (5) \nlLINER/Seyfert ( 5) ( 5) ( 5) ( 5) (4) \nl\enddata\tablecomments Mean and standard deviation are given for each class. Number of objects in each class is in the parentheses. The standard deviation does not include the errors in each measurement. \tablenotetexta Star formation rate in the central kpc estimated from H. NGC 5194 is excluded from the statistics.