Evidence for an ionised disc in the narrow-line Seyfert 1 galaxy Ark 564
Abstract
We present simultaneous ASCA and RXTE observations of Ark 564, the brightest known ‘narrow-line’ Seyfert 1 in the 2–10 keV band. The measured X-ray spectrum is dominated by a steep () power-law continuum extending to at least 20 keV, with imprinted Fe K-line and -edge features and an additional ‘soft excess’ below keV. The energy of the iron K-edge indicates the presence of highly ionised material, which we identify in terms of reflection from a strongly irradiated accretion disc. The high reflectivity of this putative disc, together with its strong intrinsic O viii Ly- and O viii recombination emission, can also explain much of the observed soft excess flux. Furthermore, the same spectral model also provides a reasonable match to the very steep 0.1–2 keV spectrum deduced from ROSAT data. The source is much more rapidly variable than ‘normal’ Seyfert 1s of comparable luminosity, increasing by a factor of 50% in 1.6 hours, with no measurable lag between the 0.5–2 keV and 3–12 keV bands, consistent with much of the soft excess flux arising from reprocessing of the primary power-law component in the inner region of the accretion disc. We note, finally, that if the unusually steep power-law component is a result of Compton cooling of a disc corona by an intense soft photon flux, then the implication is that the bulk of these soft photons lie in the unobserved extreme ultraviolet.
keywords:
galaxies: active – galaxies: individual: Ark 564 – X-rays: galaxies1 Introduction
Narrow-line Seyfert 1 galaxies (NLS1), defined as having H FWHM 2000 km/s (Osterbrock & Pogge 1985), possess distinctive X-ray properties that set them apart from ‘normal,’ broad-line Seyfert 1 (BLS1) galaxies. ROSAT observations have shown that NLS1s exhibit rapid variability and steep spectra in the soft X-ray band (Boller et al. 1996) with more recent ASCA measurements revealing that this anomalous spectral steepness often extends into the 2–10 keV band (Brandt et al. 1997; Vaughan et al. 1999).
It seems likely that the distinctive observational properties of this sub-class of AGN relate to some fundamental physical parameter common to all NLS1. By analogy with the ‘high state’ properties of Galactic black-hole candidates (GBHCs), it has been suggested that the fundamental ‘driver’ in NLS1 is the central black hole accreting at or above the Eddington limit (Pounds et al. 1995; Laor et al. 1997). One consequence of a high accretion rate might be that most of the power in NLS1 is liberated in a hot, photoionised accretion disc rather than a disc corona (Ross et al. 1992). Thermal emission from such a hot disc could then explain the strong soft excess flux and steep hard X-ray continuum often seen in NLS1s, as the copious soft photons will Compton cool the disc corona resulting in a steepening of the spectrum (Pounds et al. 1995).
The X-ray spectrum should also bear the signature of Compton ‘reflection’ from the disc surface, which is expected to be highly ionised in high accretion rate objects (e.g., Matt et al. 1993). The form of the reflection features, particularly the iron K line and absorption edge and the form of the soft X-ray continuum, should therefore differ in NLS1s from BLS1s if indeed NLS1s are accreting at a higher rate. Tentative support for this view has recently been presented by Comastri et al. (1998a) and Turner et al. (1999) who find evidence for an emission line near 7 keV, consistent with K emission in hydrogen-like iron in the NLS1 Ton S180.
Ark 564 is the brightest known NLS1 in the 2–10 keV band and hence can be considered an ideal object in which to study the spectral features described above. ROSAT data revealed a complex spectrum in the soft X-ray band, well fitted with either a power law and strong soft excess, or a (steeper) power law and an absorption edge at 1.2 keV (Brandt et al. 1994). Vaughan et al. (1999) in their study of the ASCA spectra of 22 NLS1 find evidence in Ark 564 for an emission feature at 1 keV or a broad absorption feature at 1.2 keV. In the present paper we perform a more detailed analysis of these ASCA data together with simultaneous RXTE observations of Ark 564, to provide the first study of a NLS1 out to 20 keV. All line and edge energies derived from the spectral fitting are given in the rest frame of the source and errors are quoted at the 90% confidence level unless stated otherwise.
2 Observations and data reduction
2.1 The ASCA observations
Ark 564 was observed by ASCA on 23–25 December 1996 for a duration of 103 ksec. After applying standard screening criteria, the total ‘good’ exposure time reduced to 47 ksec. In both pairs of SIS and GIS instruments counts were accumulated from a 4′ circular aperture centred on the source position, with background estimated from source free regions at similar off-axis angles. The derived pulse height spectra were binned to give at least 20 counts per spectral channel. There appear to be significant calibration problems in these ASCA spectra at soft energies; the SIS and GIS spectra diverge at keV, differing by 30% at 0.8 keV, and the two SIS spectra diverge from each other at lower energies. This is most likely due to radiation damage to the SIS CCDs. The response of the GIS detectors is not thought to be time-dependent, but their sensitivity is poor below 1 keV. In order to minimize the effect of these uncertainties in the spectral analysis presented here, the SIS data below 1.0 keV have been ignored, as have the GIS data below 0.8 keV.
We note that the SIS lower-level discriminator setting changed during the observation. In order to assess the impact on the spectral analysis, we generated separate SIS spectra and response matrices for each discriminator setting. The difference between the spectra obtained with the different discriminator settings was not significant and was much smaller than the difference between the SIS-0 and SIS-1 spectra. We therefore did not distinguish between data gathered with different discriminator settings in the following analysis.
Source and background light curves were extracted in 128s bins, from both SIS detectors, in the soft (0.5–2 keV) band. (Note that a softer band was used for the light curves because the spectral calibration problems above have a much smaller effect on temporal analysis.) The two background subtracted light curves were combined to increase signal/noise and the resulting light curve was binned by orbit (5760s) for the temporal analysis.
2.2 The RXTE observations
Ark 564 was observed by RXTE simultaneously with ASCA for a duration of 95 ksec. Data from the top (most sensitive) layer of the PCU array was extracted using the rex reduction script supplied by NASA/GSFC. Poor quality data were excluded on the basis of the following acceptance criteria: the satellite is out of the South Atlantic Anomaly; Earth elevation angle 10∘; offset from optical position of Ark 564 0.02∘; and electron-0 0.1. This last criterion removes data with high anti-coincidence rate in the PCUs. The total ‘good’ exposure time selected was 42 ksec. Data were collected from PCUs 0,1 and 2 and the background was estimated using the L7–240 model.
As with the ASCA data, the background-subtracted pulse height spectrum from the PCU array was binned to give at least 20 counts per channel. In the subsequent spectral fitting the RXTE data below 2.5 keV have been ignored in order to avoid calibration uncertainties, as well as above 20 keV where the signal is almost entirely background. The hard band (3–12 keV) light curve was extracted in 16s bins and, as with the ASCA light curve, was rebinned by orbit.
3 Spectral analysis
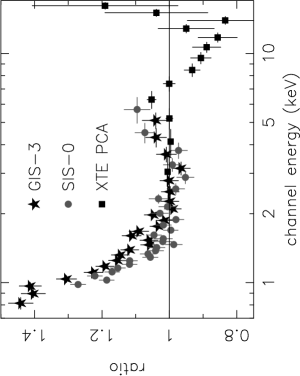
The background subtracted spectra from ASCA and RXTE were fitted using the xspec v10.0 software package. After examining the spectral fits separately to check for cross-calibration problems, we then fitted the spectra from both satellites simultaneously but with the relative normalisations free to vary. The RXTE spectrum overestimates the flux in the overlapping 2.5–10 keV band compared with ASCA, but there are no systematic differences in the shape of the spectrum. The fitting of a simple power-law model to the combined ASCA and RXTE spectra revealed strong residuals in the 5–9 keV band and a strong soft excess below 1.5 keV (as in Fig. 1).
| Model | Eline | EW | Eedge/ | /NH/R | /dof | |
|---|---|---|---|---|---|---|
| (1) | (2) | (3) | (4) | (5) | (6) | (7) |
| 1. PL | – | – | – | – | 1087/1062 | |
| 2. PL+LINE | – | – | 1047/1060 | |||
| 3. PL+LINE+EDGE | 1045/1060 | |||||
| 4. PL+LINE+EDGE | 1024/1060 | |||||
| 5. PL+LINE+EDGE | 1021/1058 | |||||
| 6. PL+ABSORI+LINE | 6.4f | 1019/1059 | ||||
| 7. PL+PEXRIV+LINE | 6.4f | 1016/1059 |
3.1 The 2.5–20 keV spectrum
We first examined the spectra in the 2.5–20 keV band, ignoring for the time being the lower energy data. A simple spectral fit using a model consisting of a power-law continuum modified by Galactic absorption of cm-2 (Dickey & Lockman 1990) gives a steep slope but a poor overall fit to the data (see Table 1, model 1). In particular there are clear deviations in the data–model residuals around 5–9 keV (see Fig. 1).
The addition of a narrow ( keV) Gaussian line at 6.4 keV, to represent K emission from neutral iron (model 2), improved the fit significantly (% significance in an F-test). The best-fit energy of the line is consistent with 6.4 keV but the width of this line is not well constrained using these data. Even after the addition of an iron line the residuals show a deficit at 8 keV, particularly in the RXTE data. In order to quantify these features we fitted a range of simple models (see Table 1). Specifically, we tested models with a line and an edge at energies expected from neutral iron (model 3), from helium-like iron (model 4), and with the line and edge energies free to vary (model 5). The He-like features provided a better fit than neutral features, but the best fit values lie between these two extremes (see Fig. 2). The important point is that the iron K-edge is at an energy clearly above that for neutral iron. We have verified that the edge energy is not an artefact of trying to fit a possible broad emission feature with a narrow line, by repeating the fit with lines of increasing width, up to keV. The absorption edge energy and optical depth remained consistent with the values given above for the narrow line fit. In particular, the measured energy of the edge implies an origin in strongly ionised material. This could, in principle, lie along the line of sight (a ‘warm absorber’) or arise by reflection from optically thick matter having a highly ionised surface layer (an ‘ionised reflector’).

To pursue these alternatives we first fitted the spectra above 2.5 keV with the absori warm absorber model contained within the xspec package. The free parameters were power-law slope and normalisation, iron line equivalent width, hydrogen column density and the ionisation parameter (; where is the particle density at a distance from a source of ionising luminosity , measured in the 0.005–20 keV range). The temperature of the absorbing gas was fixed at K. This model provides a good fit to the data (; see Table 1, model 6). An unusually high is needed to explain the energy of the iron edge, with a column density in excess of . Such a highly ionised absorber, if indeed stable, will be essentially transparent at lower energies.
As an alternative we fitted the 2.5–20 keV spectrum with the ionised reflector model pexriv in xspec (Magdziarz & Zdziarski 1995). This model consists of a power-law and reflection component from ionised material but does not contain the emission lines expected from such a reflector. The energy of the iron line is only poorly constrained but is consistent with emission in the range 6.3–6.7 keV (see Fig. 2). We therefore added a narrow emission line at 6.4 keV to model the iron K line. This is not necessarily inconsistent with emission from an ionised disc as the line is expected to be broadened and redshifted if the emitting region is in close proximity to the central black hole. The free parameters in the fit were the power law index and normalisation, iron line equivalent width, the reflection strength () and the ionisation parameter. The inclination of the reflector was fixed at 30∘(a value which is unlikely to be exceeded in NLS1s) and the elemental abundances were assumed to be solar. The surface temperature of the reflector was fixed at K, consistent with values expected for an ionised disc (e.g., Ross et al. 1999). This model also provides a good fit to the data (; Table 1, model 7), comparable with the warm absorber model, with plausible values for both and .
| Model | kT | R | EWFe | EWOVIII | kTOVIII | /dof | ||
|---|---|---|---|---|---|---|---|---|
| (1) | (2) | (3) | (4) | (5) | (6) | (7) | (8) | (9) |
| 1. PL+PEXRIV | 2.68f | – | 2400f | 0.7f | 38f | – | – | 2040/1564 |
| 2. PL+PEXRIV+BB | – | – | 1595/1557 | |||||
| 3. PL+PEXRIV+LINES | – | 1975 | 1596/1557 | |||||
| 4. PL+PEXRIV+LINES | – | 2000f | 1619/1574 |
3.2 The 0.8–20 keV spectrum
Having obtained a satisfactory description of the hard X-ray spectrum of Ark 564 we extended our analysis to cover the 0.8–20 keV range, but exclude the SIS data below 1.0 keV in order to avoid the calibration uncertainties mentioned above. Applying the ionised reflector model (with parameters as in Table 1, model 7) gave some reduction in the ‘soft excess,’ due to the enhanced reflectivity of the ionised matter. However the fit (Table 2, model 1) leaves a substantial excess flux which can be well modeled by the addition of a eV black body component (leading to ; Table 2, model 2).
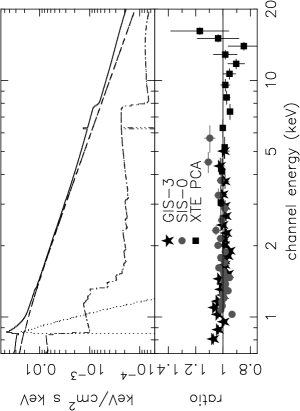
The steep underlying power law, enhanced by the high reflectivity of the ionised disc, lead to a smaller black body component than would otherwise be the case. We note, furthermore, that a more complete ionised reflector model would include significant soft X-ray emission. Reference to the disc reflection model recently published by Ross et al. (1999), suggests that ionised oxygen features, in particular the recombination continuum of O viii (above 0.87 keV) and the O viii Ly- emission line (at 0.65 keV), will be prominent for values of the ionisation parameters similar to those derived for Ark 564. Therefore, as an alternative to the black body component, we refitted the ionised reflector model with the addition of O viii recombination at 0.87 keV (using the redge model in xspec). The result (Table 2, model 3) was a good fit (very similar, in statistical terms, to the previous model) with a best fit temperature of eV (i.e. within a factor of two of our earlier assumption of a disk temperature of K). We conclude from this that, to first order, both the iron K features and the soft excess in the ASCA and RXTE observation of Ark 564 can be explained in terms of reflection from highly ionised matter, presumably the putative accretion disc in this NLS1. Specifically, the anomalous spectral form of Ark 564 below 2 keV may have a natural explanation in terms of the combined effects of deep O viii and Si xiii and xiv edges (present in the pexriv reflection continuum) together with associated recombination continuum and line emission (see Fig. 3).
One important consequence of our ionised reflector description for Ark 564 is the need to reassess the strong ‘primary’ soft emission component, thought to be a major feature of NLS1 (and generally associated with internally generated emission from the accretion disc) and extending up to 1 keV. Indeed when we included the ROSAT spectrum considered by Brandt et al. (1994) in our model fitting (assuming that the spectral shape of Ark 564 is constant but allowing the relative level of the spectrum to vary from epoch to epoch) we found that the ionised reflector, now including O viii recombination and Ly- emission (the latter with an equivalent width of eV), allowed a reasonable fit down to 0.2 keV (Table 2, model 4).
Comastri et al. (1998b) present a preliminary analysis of a BeppoSAX observation of Ark 564. Our interpretation of the X-ray spectrum of Ark 564 in terms of an ionised reflector is broadly consistent with the measured BeppoSAX spectrum.

4 Temporal analysis
These data were also used to study the variability properties of Ark 564. Fig. 4 shows that the ASCA soft (0.5–2 keV) and RXTE hard (3–12 keV) band light curves reveal strong flaring, with an increase of 50% in a single orbit that is almost identical in amplitude and phase in both bands.
In order to quantify the variability in Ark 564, we computed the ‘excess variance’ () in the same fashion as Nandra et al. (1997), except that paper used 128s bins while we use orbital bins. For Ark 564, the hard and soft band excess variances were measured to be and 0.0325, respectively. This compares with a typical value found by Nandra et al. (1997) for ‘normal’ Seyfert 1s with a similar luminosity ( erg/s) of in the ASCA 0.5–10 keV band.
It is also interesting that Ark 564 shows almost identical variability amplitudes in the hard RXTE and soft ASCA bands. Furthermore, the hard and soft band variations track almost perfectly, with no measurable lag, especially during the large flare. In terms of our present model of Ark 564, in which a substantial fraction of the soft X-ray flux is reprocessed harder radiation, the observed limit on the lag ( 96 min), gives a maximum size for the effective reprocessing region of cm.
5 Discussion
The simultaneous ASCA and RXTE data presented here give the first determination of the spectrum of an ‘ultra-soft’ NLS1 extending above 10 keV. The spectrum is extremely steep () and shows little sign of flattening at harder energies. There is good evidence for both K-edge and line features from ionised iron and the spectrum also shows a strong excess over the best-fit power law below 1.5 keV. Due to calibration problems with the ASCA detectors at low energies (see Iwasawa, Fabian & Nandra 1999), the data have not been fitted below 0.8 keV and so the form of this soft excess is not well determined by these data.
The existence of strong soft X-ray emission and an underlying power law much steeper than typical of BLS1s and quasars are well established characteristics of the X-ray spectra of NLS1s. It has been suggested that the two features are linked, whereby Compton cooling of the hard X-ray source (possibly in a disc corona), and hence its steeper power law, is a consequence of the strong soft EUV flux (Pounds et al. 1995). In this picture, the soft component, probably peaking in the hidden EUV band, is intrinsic emission from the accretion disc, which is expected to be stronger in high accretion rate objects (e.g. Szuszkiewicz et al. 1996).
In the present analysis we now find other spectral features, namely an ionised iron K-edge and recombination emission below 1.5 keV, indicative of reflection from an ionised disc. The higher level of irradiation thought to occur in NLS1s would lead naturally to the surface layers of the disc becoming strongly ionised (Matt et al. 1993). In contrast, the alternative interpretation we have considered for the observed iron K-edge, in terms of absorption in a large column of highly ionised gas, is less attractive, since it may well be unstable (Netzer 1996) and because such material would be transparent in the soft X-ray band, leaving the need for a separate explanation of the the observed spectral features below 2 keV.
An important consequence of the steep underlying power law of Ark 564, enhanced at low energies both by the high reflectivity of the disc and the additional line and recombination emission, is that the need for a primary emission ‘soft excess,’ at least within the observable X-ray band, must be reconsidered when better data from e.g., XMM and Chandra become available. However, the circumstantial evidence for the soft X-ray/EUV flux to dominate energetically in NLS1 remains persuasive, particularly in providing a natural explanation for the steep hard power law spectrum and the absence of broad optical lines.
Finally we note that evidence for reflection from an ionised disc has been reported in several GBHC, exhibiting strong, ionised edges with weak, Compton-broadened Fe lines (e.g., Zycki et al. 1997, 1998; but see Done & Zycki 1999). The similarity of NLS1 to GBHC in their high flux mode has been noted earlier (Pounds et al. 1995). It is interesting to speculate that the reported weakness in higher luminosity AGN (e.g. Reeves et al. 1997), of the reflection components commonly seen in BLS1 (George et al. 1998), may be a due to the accretion disc material in the former being highly ionised, with the classical indicators of cold reflection, namely strong iron fluorescence and a continuum hump near 10 keV, consequently reduced.
Acknowledgments
This research made use of data obtained from the LEDAS and HEASARC. We thank Andy Young for providing data files on the Ross et al. ionised disc model. SV acknowledges a research studentship from PPARC. RE acknowledges support from NASA grant NAG 5-3295.
References
- [1] Brandt, W. N., Fabian, A. C., Nandra, K., Reynolds, C. S., Brinkmann, W. 1994, MNRAS, 271, 958
- [2] Brandt, W. N., Mathur, S., Elvis, M. 1997, MNRAS, 285, L25
- [3] Boller, Th., Brandt, W. N., Fink H. H. 1996, A&A 305, 53
- [4] Comastri, A. et al. 1998a, A&A, 333, 31
- [5] Comastri, A., Brandt, W. N., Leighly, K. M., Fiore, F., Guainazzi, M., Matt, G., Stirpe, G. M. 1998b, in Scarsi L., Bradt H., Giommi P., Fiore F., The Active X-ray sky, Amsterdam: Elsevier, p523
- [6] Done, C., Zycki, P. T. 1999, MNRAS, 305, 457
- [7] Dickey J. M., Lockman F. J. 1990, ARA&A 28, 215
- [8] George, I. M., Turner, T. J., Netzer, H., Nandra, K., Mushotzky, R. F., Yaqoob, T. 1998, ApJS, 114, 73
- [9] Iwasawa, K., Fabian, A. C., Nandra, K., 1999, MNRAS, in press astro-ph/9904071
- [10] Laor, A., Fiore, F., Elvis, M., Wilkes, B. J., McDowell, J. C., 1997, ApJ, 477, 93
- [11] Magdziarz, P., Zdziarski, A. A. 1995, MNRAS, 273, 837
- [12] Matt, G., Fabian, A., Ross, R. 1993, MNRAS, 262, 179
- [13] Nandra, K., George, I. M., Mushotzky, R. F., Turner, T. J., Yaqoob, T. 1997, ApJ, 476, 70
- [14] Netzer, H. 1996, ApJ, 473, 781
- [15] Osterbrock, D. E., Pogge, R. 1985, ApJ 297, 166
- [16] Pounds, K., Done, C., Osborne, J. 1995, MNRAS, 277, L5
- [17] Reeves, J. N., Turner, M. J. L., Ohashi, T., Kii, T. 1997, MNRAS, 292, 468
- [18] Ross, R. R., Fabian, A. C., Young, A. J. 1999, MNRAS, 306, 461
- [19] Ross, R., Fabian, A., Mineshige, S. 1992, MNRAS, 258, 189
- [20] Szuszkiewicz, E., Malkan, M. A., Abramowicz, M. A. 1996, ApJ, 458, 474
- [21] Turner, T. J., George, I. M., Nandra, K. 1999, ApJ, 508, 648
- [22] Vaughan, S., Reeves, J., Warwick, R., Edelson, R. 1999, MNRAS, in press, astro-ph/9905323
- [23] Zycki, P. T., Done, C., Smith, D., A. 1997, ApJ, 488, L113
- [24] Zycki, P. T., Done, C., Smith, D., A. 1998, ApJ, 496, L25