Optical observations of the black hole candidate XTE J1550-564 during the September/October 1998 outburst
Abstract
We report here optical observations during the September/October 1998 outburst of the black hole candidate XTE J1550-564. CCD photometry was obtained for the optical counterpart with the 0.9m Dutch telescope at La Silla since the onset of this event. We analysed 211 U, V and i frames, from Sep 10 to Oct 23. Stochastic flaring activity was observed on Sep 11-16, but no evidence for a superhump period, as seen in other soft X-ray transients, was found. An optical flare nearly simultaneous to an X-ray flare that occurred on Sep 21 was observed in the V-band. A reddened optical spectrum showed the typical emission lines corresponding to X-ray transients in outburst. From the interstellar absorption lines, we derive E(B-V) = 0.70 0.10 and suggest D 2.5 kpc. In such case, MB +7 mag. for the progenitor, which is consistent with the spectral type of a low-mass K0–K5 main-sequence companion.
Key Words.:
Black hole physics — Stars: neutron – Stars: binaries: general — X-rays: general1 Introduction
Low Mass X-ray Binaries (LMXBs) are systems formed by a low-mass companion and a compact object. A subclass of LMXBs are the Soft X-ray Transients (SXTs, so called X-ray Novae, although the physics is quite different from the classical novae). In these systems, sporadic outbursts are produced due to some poorly understood mechanism for which some mass is sporadically transferred onto the compact primary via an accretion disk. There are two types of SXTs. In Type I, the compact object is a weakly magnetized neutron star, whereas in Type II, the compact object is likely to be a black hole. Normally they brighten in the course of a few days to become one of the brightest sources in the X-ray sky, then declining in brightness over the next few months. The X-ray spectra are often dominated by an ultrasoft component and a hard X-ray tail.
The most recent Type II SXT, XTE J1550-564 was first detected on Sep 7.09 UT by the All-Sky Monitor on the Rossi X-Ray Timing Explorer. First detection yielded an intensity of 70 mCrab (2-12 keV; 5- significance) (Smith and Remillard 1998). The source showed a steady rise to 1.7 Crab on Sep 15. Thereafter, there was increased variability, with the intensity reaching 3.2 Crab on Sep 18.7 UT. On Sep 19 and 20, a large flare peaked at 6.8 Crab, and the intensity fell back to the range of 2.7-3.6 Crab on Sep 20 and 21 (Remillard et al. 1998). The source was also detected in hard X-rays (20-100 keV) by the Burst and Transient Source Experiment on the Compton Gamma-Ray Observatory (Wilson et al. 1998).
An optical counterpart with V 16 mag. was proposed by Orosz et al. (1998) by means of V-band images obtained on Sep 8.99 UT. It is located at R.A. = 15h50m5878, Decl. = (equinox 2000.0)( = 326.2, = -2.3). A likely radio counterpart to the X-ray transient, coincident with the optical one, was detected on Sep 9 and 10 (Campbell-Wilson et al. 1998).
| # | (2000) | (2000) | U | B | V | R | i |
|---|---|---|---|---|---|---|---|
| 2 | 15 50 58.5 | -56 28 57 | 15.74 | 15.44 | 14.46 | 13.98 | 13.47 |
| 3 | 15 50 52.3 | -56 29 40 | 16.37 | 15.65 | 14.37 | 13.67 | 12.98 |
| 4 | 15 52 05.0 | -56 30 15 | 15.23 | 13.78 | 14.67 | 13.40 | 12.91 |
| 5 | 15 51 02.6 | -56 27 04 | 18.27 | 17.70 | 14.47 | 15.87 | 15.23 |
| 6 | 15 51 01.6 | -56 28 23 | 15.68 | 15.22 | 14.42 | 14.02 | 13.56 |
| 7 | 15 51 01.7 | -56 28 34 | 18.51 | 17.76 | 16.66 | 16.13 | 15.55 |
| 8 | 15 51 00.0 | -56 28 07 | 18.53 | 17.61 | 16.28 | 15.60 | 14.90 |
| 9 | 15 51 00.5 | -56 27 55 | 18.56 | 17.80 | 16.60 | 16.00 | 15.36 |
| 10 | 15 51 01.4 | -56 27 24 | 17.89 | 17.35 | 16.23 | 15.67 | 15.08 |
In this paper we present a series of optical observations of the XTE J1550-564 counterpart taken with the 0.9m Dutch telescope at the European Southern Observatory (ESO), La Silla between Sep 11 and Oct 23, 1998.
2 Observations
Observations of the optical counterpart of XTE J1550-564 were carried out with the 0.9m Dutch telescope at the ESO La Silla Observatory. Observations were taken between Sep 10 and Oct 23, 1998. The apparent proximity of the source to the Sun after Oct 23 prevented additional optical observations.
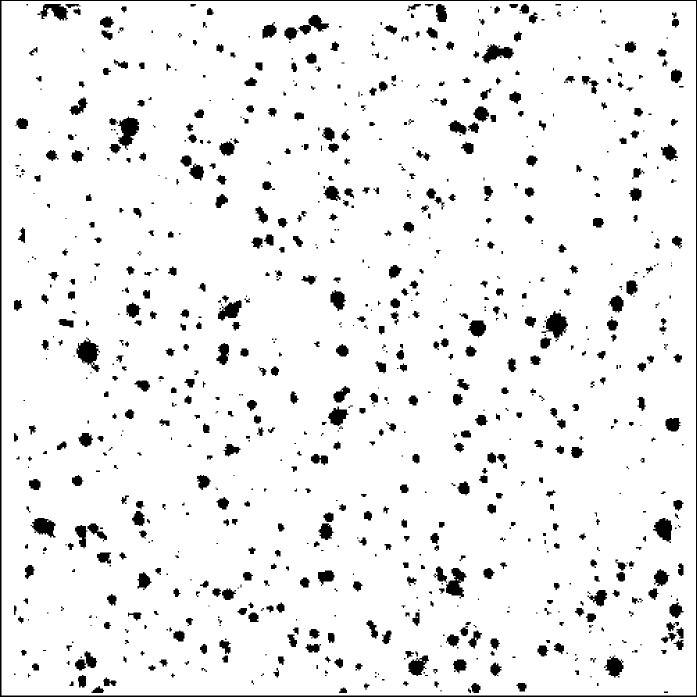
The CCD used was a TEK CCD (512 x 512 pixels) that yielded a x square field (see Figure 1). Typical exposure times were 600 s for the Johnson-U filter, 180 s for the Johnson-V filter, and 120 s for the Gunn-i filter per observing night. On Sep 11-16, a series of exposures were taken in the UVi-bands during 3 hr/night in order to search for short-term variations. The number of frames were 54 (U), 1 (B), 69 (V), 1(R) and 88 (i) during the observing period. The data were reduced using IRAF. The images were processed to eliminate the electronic bias and flat field corrected to remove the pixel-to-pixel sensitivity variations. The optical light curve was obtained when using the differences in magnitude between the object and 9 field stars, given on Table 1. The typical uncertainties for the quoted coordinates and UBVRi magnitudes are 1′′ and 0.01 mag respectively. The magnitudes were calculated using the SExtractor software package (Bertin and Arnouts 1996).
A 300-s spectrum of the optical counterpart (range 3500-7400 Å, resolution 2.0 Å) was obtained with the 3.6-m ESO telescope (equipped with EFOSC2 and a B300 grism) on Sep 15.98 UT. He-Ar lamps were used for wavelength calibration and the standard LTT 7379 for the flux calibration. The reduction of the spectroscopic data was also carried out with IRAF. We corrected the spectrum for interstellar reddening following Cardelli et al. (1989), using E(B-V) = 0.7, as discussed in the next section.

3 Results and discussion
The first CCD images were taken on Sep 11 (MJD 51066), and showed XTE J1550-564 with magnitudes V = 16.66 0.01, U = 18.14 0.01 and i= 14.98 0.01. The object was monitored on an almost daily basis in the UVi filters.
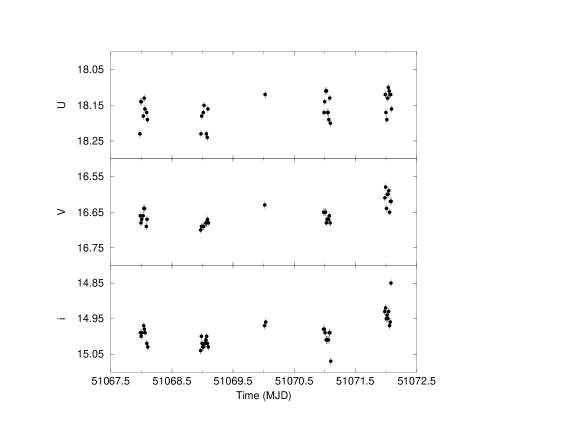
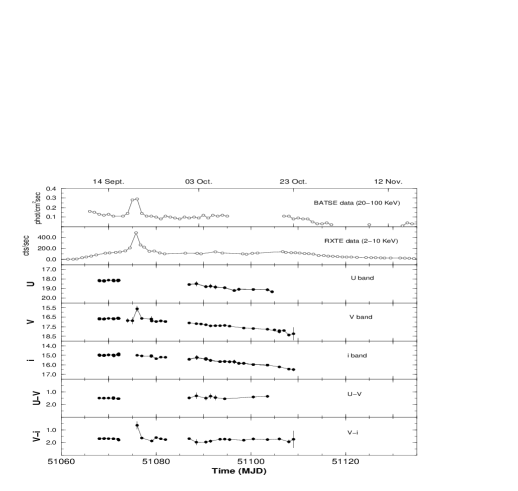
The flux dropped by 1.5 mag during our observing period. It is striking that at the early epochs (MJD 50165 to 50175), the optical light curve seems to remain approximately on a constant level, with some stochastic flaring activity (Figure 2), whereas the X-ray spectrum is very hard, although is gradually softening. Figure 3 shows the complete optical light curve based on our measurements. X-ray light curves from RXTE and BATSE have been included in the figure for comparison. Just after the flaring activity, a large brightening, with an amplitude of 1 mag in the V-band is detected, coincident with the X-ray flare during which the V flux of the system reaches V = 15.6 mag. We do not find support for the delay of 1 day claimed by Jain et al. (1999). Unfortunately, we could not get observations in the U filter during the maximum, so we cannot confirm that this peak is also present in the U band. However, there is no signature of this peak in the i band. After this flaring episode, the light curve shows a constant decrease in brightness, that extends at least until our last data taken on MJD 51110. We measure the following decay rates: dU/dt= 0.041 0.006 mag/day, dV/dt= 0.048 0.004 mag/day and di/dt=0.048 0.005 mag/day.
We have searched for a superhump periodicity as seen in other SXTs (see Della Valle, Masetti and Bianchini 1998 and references therein) by means of Fourier analysis of the data obtained during Sep 11-16 following the prescription of Horne and Baliunas (1986) for unequally spaced time series. No convincing periodicity was found in the 0.05-2 day interval.
| Line | EW | Flux | FWHM | |
|---|---|---|---|---|
| ID | Å | Å | (erg cm-2 s-1) | (km s-1) |
| N III | 4640 | 4.3 | 2.8 10-15 | 2900 |
| He II | 4686 | 3.2 | 2.6 10-15 | 1550 |
| H- | 4861 | 2.3 | 2.1 10-15 | 1650 |
| He I | 5876 | 1.5 | 2.1 10-15 | 900 |
| H- | 6563 | 11.9 | 2.0 10-14 | 1250 |
The optical spectrum shown in Figure 4 shows a strong and broad H- emission line, and broad and weaker emission lines from H- and He II (4686 Å), as initially reported by Castro-Tirado et al. (1998). He I (5876 Å) is strong and N III (4640 Å) is also marginally detected. Line characteristics are given in Table 2. These lines are typical for soft X-ray transients in outburst (Bradt and McClintock 1983). The emission lines and several interstellar absorption lines are superposed on a red continuum. The main interstellar features are the diffuse interstellar band at 4430 Å (EW = 1.9 Å), the blend (EW = 2.4 Å) due to the Na D lines at 5890 and 5898 Å and the blend due to the 6269 and 6282 Å lines (EW = 1.7 Å). The ‘warp’ feature around 5000 Å has been observed in other SXTs at maximum or during the decline phase (Della Valle et al. 1991, Bianchini et al. 1997, Masetti et al. 1997) where the Balmer lines (especially Hβ) were normally seen in emission filling in shallow absorptions.
The colour excess can be estimated on several ways. From the equivalent width (EW) of the 4430 Å band (EW = 1.9 Å), we estimate a colour excess of E(B-V) = 0.80 (Herbig 1975). From the empirical relation between the width of the Na D lines given by Barbon et al. (1990) and considering EW = 2.4 Å for the Na D lines, E(B-V) = 0.60. Hereafter we will adopt E(B-V) = 0.70 0.10, i.e. AV = 2.2 following the relationship given by Savage and Mathis (1979).
The distance to RXTE J1550-564 could be estimated on the basis of the linear relation between the equivalent width of the Na D lines and the distance (following Charles et al. 1989). We get D 2.5 kpc. From the work of Neckel and Klare (1980) it can be roughly seen how the absorption AV varies with the distance. On two fields 2 away from the RXTE J1550-564 position, AV apparently remains constant up to 2-3 kpc so no firm conclusion can be drawn. Hererafter we consider D 2.5 kpc, that is significantly different from D 6 kpc (Sobczak et al. 1999), a value obtained on the basis of the similarities of the optical and X-ray brightness of XTE J1550-564 with respect to the X-ray Nova Oph 1977. Given the large uncertainty in all the parameters, this distance estimate cannot be excluded.
The peak luminosity during the flare on MJD 51075 is, following Sobczak et al. (1999), L = 2.0 1038 (D/2.5 kpc)2 erg s-1, which corresponds to the Eddington luminosity for M = 1.5 M⊙ at 2.5 kpc. The optical to X–ray ratio during the flare is L(V-band)/L 2200, higher than the average value of 500 found by van Paradijs & McClintock (1995).
For a quiescent magnitude of B 22 (Jain et al. 1999), i.e. B 19 after the dereddening correction and a distance D 2.5 kpc, we derive MB +7 for the progenitor, assuming that there is no contribution from the disk in quiescence. This value is consistent with the spectral type of a low-mass K0–K5 main-sequence companion (Allen 1976), similar to other SXTs for which radial velocities studies have been performed. The low-mass companion is also supported by the large magnitude range from quiescence to the outburst ( 5 mag).
4 Conclusions
Both the overall optical and X-ray light curves for XTE J1550-564 during the first two months since the onset of the source resemble the light curves of other type II SXTs (Tanaka and Shibazaki 1996). The spectrum shows emission lines arising from H-, H-, He II and N III, typical of soft X-ray transients in outburst. From the interstellar absortion lines, we derive E(B-V) = 0.70 0.10 and D 2.5 kpc, and MB +7 for the progenitor, which is consistent with a low-mass K0–K5 main-sequence companion. Only spectroscopic observations, to be performed when the system returns to quiescence, may lead to determine of the mass function of the system. This will make possible to discern whether the compact object in the XTE J1550-564 system is a neutron star or a black hole.
Acknowledgements.
We thank the referee, R. A. Remillard, for useful suggestions. One of us (CSF) is very grateful to J. Gorosabel for his valuable help. This work has been partially supported by the spanish INTA grant Rafael Calvo Rodés and the spanish CICYT grant ESP95-0389-C02-02.References
- (1) Allen C. W. 1976, Astrophysical Quantities, The Athlone Press, 206
- (2) Barbon R., Benetti S., Rosino L., Capellaro E., Turatto M., 1990, A&A 237, 79.
- (3) Bertin E., Arnouts S., 1996, A&AS 117, 393
- (4) Bianchini A., Della Valle M., Masetti N., Margoni R., 1997, A&A 321, 477
- (5) Bradt H.V, McClintock J., 1983, ARA&A 21, 30
- (6) Campbell-Wilson D., McIntyre V., Hunstead, R. et al., 1998 IAUC 7010
- (7) Cardelli J. A., Clayton G. C., Mathis J. S., 1989, ApJ 345, 245
- (8) Castro-Tirado A. J., Duerbeck H. W., Hook I., Yan, L., 1998 IAUC 7010
- (9) Charles P.A., Casares J., Jones D.H.P. et al., 1989, Proc. 23rd ESLAB Symposium, Paris, p. 103.
- (10) Della Valle M., Jarvis B., West R., 1991, Nat 353,50
- (11) Della Valle M., Masetti N., Bianchini A. 1998, A&A 329, 606
- (12) Herbig G. H., 1975, ApJ 196, 129
- (13) Horne, J. H., & Baliunas, S. L. 1986, ApJ 302, 757
- (14) Jain R. K., Bailyn C. D., Orosz J. A., Remillard R. A., McClintock J. E., 1999, ApJ, in press (astro-ph/9903398)
- (15) Masetti N., Bianchini A., Della Valle M., 1997, A&A 317, 769
- (16) Neckel T., Klare G., 1980, A&ASS 42, 251
- (17) Orosz J. A., Bailyn C. D., Jain, R. K., 1998, IAUC 7009
- (18) Remillard R. A., Morgan E. H., McClintock J. E., Sobczak, G. J., 1998, IAUC 7019
- (19) Savage B. D., Mathis J. S., 1979, ARA&A 17, 73
- (20) Smith D. A., Remillard R., 1998, IAUC 7008
- (21) Sobczak G.J., McClintock J. E., Remillard R. A. et al., 1999, ApJ, in press (astro-ph/9903395)
- (22) Tanaka Y., Shibazaki N., 1996, ARA&A 34, 607
- (23) van Paradijs J., McClintock J. E. 1995, In: Lewin W. H. G., van Paradijs J., van den Heuvel E. P. J. (eds.) X–ray binaries, Cambridge University Press, Cambridge, p. 58
- (24) Wilson C. A., Harmon B. A., Paciesas W. S., McCollough M. L., 1998 IAUC 7010