On the HR 4796 A circumstellar disk ††thanks: Based on observations collected at the European Southern Observatory, La Silla, Chile
Abstract
We investigate in details the properties of the disk surrounding the 8 Myr old star HR 4796 A, one of the few stars bringing precious clues to better understand the scenario which lead to planetary system formation. We propose a model able to reproduce all the available observations : the full spectral energy distribution from the mid-infrared to the millimeter wavelengths, resolved scattered light and thermal emission observations. We show that the circumstellar matter splits into two dust components : a cold annulus, peaked at 70 AU from the star, made of ISM-like grains (amorphous composition, porosity 0.6) larger than 10 m and a population of hot dust close to the star (at about 9 AU) made of comet-like grains (crystalline composition, porosity 0.97). Both dust populations are highly collisional and the grain size distribution in the cold annulus is found to be cut-off by radiation pressure. At 70 AU, bodies as large as a few meters are required to fit the data leading to a minimum disk mass of a few Earth masses and to a gas to dust ratio less than . We discuss aftewards some implications on the disk structure and effects of larger bodies.
Key Words.:
Stars: circumstellar matter – Stars: HR 4796 A1 Introduction
HR 4796 A is one of the A type stars showing a high infrared excess ( / ) due to the thermal emission from circumstellar dust. The excess is twice that of Pictoris, the best studied case among Vega-like stars so far. The star age, 82 Myr (Stauffer et al. 1995), is about 5 to 15 times less than Pictoris implying that HR 4796 A is tracing an evolutionary phasis prior to that of Pictoris.
Koerner et al. (1998) and Jayawardhana et al. (1998) resolved first the circumstellar dust at thermal infrared wavelengths (m) recently followed by Schneider et al. (1999) in scattered light ( and m). Interestingly, the disk lies nearly in the direction to HR 4796 B, a physically bound companion of HR 4796 A (Jura et al. 1993), located 7.7” away, i.e. 515 AU in projected distance according to the Hipparcos star distance pc.
According to the resolved images, the disk is extending only a few tens of AU outside the peak of the dust distribution assessed to about 70 AU (Schneider et al. 1999). Outer truncation of circumstellar disks within a binary system has been predicted at typical distances of 1/3 – 1/2 of the binary separation (Papaloizou & Pringle 1977; Artymowicz et al. 1994). However, the impact of the companion HR 4796 B on the disk extension is still unclear.
In the inner part of the disk, Jura et al. (1995) first suggested a depletion of dust close to the star so as to reproduce the 110 K color temperature deduced from IRAS data. The comparison between resolved mid-IR images and first order modeling (see below) confirmed the necessity of an inner hole in the disk at 5515 AU from the star for Koerner et al. (1998) and 6020 AU for Jayawardhana et al. (1998).
According to Koerner et al. (1998), a second population of hotter grains may however lie closer to the star (inside the inner hole). Located at distances similar to those of the zodiacal dust in our Solar System, this dust population would be responsible for both the 12.5 m detected excess and for a faint emission at 20.8 m (less than 10% of the total flux at the wavelenght) in excess of the resolved disk and centered on the star.
The grains properties are so far poorly constrained. According to Jura et al. (1995), grains smaller than about 3 m are blown outward by radiation pressure. Considering the Poynting-Robertson effect, they found that the grains are probably larger than 40 m under the assumption of a 40 AU inner hole. Koerner et al. (1998) used thermal absorption/emission laws for the grains following the model proposed by Backman et al. (1992) for Pictoris : is constant for and proportionnal to otherwise, the parameter is expected to be related to an effectif grain size in the disk. Although Koerner et al. (1998) constrain to 2515 m, they do not specify the ratio in the case of HR 4796 A. This ratio could vary by a factor 40 between the lower and the higher value (Backman et al. 1992).
Before beeing imaged in the mid-IR spectral range, no optical or near-IR observations succesfully resolved the disk around HR 4796 A, if we except for a slight asymmetry in the coronographic adaptive optics system images performed with the ESO adaptive optics system in K’ band Mouillet et al. (1997a). Because of the low signal to noise ratio in this data, these results were not presented as a positive detection. Knowing the position angle of the disk, we reduced again these observations and we now marginally detect the disk. After a brief summary of thermal available data, we present in section 2 the newly reduced scattered light images and compare then with more recent and better signal to noise ratio scattered ligth images (Schneider et al. 1999).
As data become actually more numerous, we wish to better constrain the grain properties in the HR 4796 A disk. Sophisticated grains models developed by Greenberg et al. (1972) succeeded both in reproducing interstellar observations (extinction, polarization (Li & Greenberg 1997)) and in fitting the shape of the SED of the disk surounding Pictoris (Li & Greenberg 1998; Pantin et al. 1997). In addition, Li & Greenberg (1998) proposed a link between ISM particles and circumstellar evolved environments assuming that dust grains in the Pictoris disk are of cometary origin (see also Backman & Paresce (1993); Lecavelier des Etangs et al. (1996)) and could be fluffy aggregates of primitive interstellar dust.
In this paper, we adopt a similar approach for the grains in the HR 4796 A disk. We describe section 3 the disk model assumptions and try to fit (sections 4.1 and 4.2) the Spectral Energy Distribution (hereafter SED) to derive some physical and chemical grain properties such as typical size, porosity, presence of ice and finally to estimate if the grains are more similar to interstellar dust grains or to comet-like grains.
In addition, we test whether the presence of a second population responsible for the 10 m excesses is necessary or not. Given the constraints on the grain distribution derived from the SED fitting, we try to reproduce the thermal and scattered light resolved images (section 4.3). We finally discuss section 5 the implications on the disk dynamics.
2 Available data
2.1 Spectral Energy Distribution
The available photometric data for the HR 4796 A disk are summarized in Table 1. They include color-corrected IRAS measurements, IRTF bolometer measurements (Fajardo-Acosta et al. 1998), Keck/Mirlin (Koerner et al. 1998) and Cerro Tololo/ OSCIR (Jayawardhana et al. 1998) images and the IRTF bolometer datum obtained by Jura et al. (1993) at 20 m. They also include the available submillimeter data : JCMT upper limit at 800 m (Jura et al. 1995) and recent SCUBA measurements at 450 m and 850 m (Greaves et al. 1999).
| Excess | Uncertainty | ||
|---|---|---|---|
| m | Jy | Jy | Reference |
| 4.80 | no excess | Fajardo-A. et al. (1998) | |
| 7.80 | 0.067 | 0.037 | Fajardo-A. et al. (1998) |
| 9.80 | no excess | Fajardo-A. et al. (1998) | |
| 10.1 | 0.087 | 0.026 | Fajardo-A. et al. (1998) |
| 10.3 | 0.057 | 0.024 | Fajardo-A. et al. (1998) |
| ∗11.6 | 0.086 | 0.070 | Fajardo-A. et al. (1998) |
| ∗12.0 | 0.173 | 0.028 | IRAS |
| ∗12.5 | 0.101 | 0.018 | Koerner et al. (1998) |
| ∗12.5 | 0.133 | 0.027 | Fajardo-A. et al. (1998) |
| ∗18.2 | 1.100 | 0.150 | Jayawardhana et al. (1998) |
| 20.0 | 1.860 | unknown | Jura et al. (1993) |
| ∗20.8 | 1.813 | 0.170 | Koerner et al. (1998) |
| ∗24.5 | 2.237 | 0.700 | Koerner et al. (1998) |
| ∗25.0 | 3.250 | 0.130 | IRAS |
| ∗60.0 | 8.630 | 0.430 | IRAS |
| ∗100.0 | 4.300 | 0.340 | IRAS |
| 450.0 | 0.180 | 0.150 | Greaves et al. (1999) |
| 800.0 | 0.028 | Jura et al. (1995) | |
| 850.0 | 0.0191 | 0.0034 | Greaves et al. (1999) |
2.2 Resolved mid infrared thermal data
Mid-IR images revealed the morphology of the dust distribution sensitive to these wavelengths. Actually, the rather low resolution does not allow to precisely describe the radial shape of the surface brightness along the major axis and its vertical shape. However, simple models are consistent with data if the suface density of grains follows a radial power law where is badly constrained in the range (Koerner et al. (1998) and Jayawardhana et al. (1998)). Assuming that the disk is optically and geometrically thin (2-D disk model) and using a Bayesian approach, Koerner et al. (1998) assessed a disk inclination less than about with respect to the line of sight. Indeed, the vertical height to radial height ratio for a given isophote at m is close to which corresponds to a flat disk inclined at from edge-on. Finally, both Koerner et al. (1998) and Jayawardhana et al. (1998) images are consistent with a disk located at the position angle (PA) in the ranges : for Koerner et al. (1998) and for Jayawardhana et al. (1998).
2.3 Resolved near infrared data
2.3.1 Reduction procedure
The coronographic observations we reinvestigate in this paper have been first presented in Mouillet et al. (1997a). This paper also describes the reduction procedure used. A main step in coronographic data reduction is the removal of the scattered light remaining around the mask. This implies to use a comparison star which scattered light is scaled to that of the object of interest. The scaling factor is generally estimated by azimuthally averaging the division of the star of interest by the comparison star. Azimuthal averaging over 360 prevents from detecting pole on disks and decreases the chance of detection of inclined disks or faint structures. Knowing the orientation of the disk, we were able to estimate more precisely the scaling factor in a section perpendicular to the disk.
2.3.2 Radial excess almost in the direction of HR 4796 B
We present Figure 1 the newly reduced coronographic image of HR 4796 A in K’ band. An excess is present in the NE and SW regions. Due to the spreading of the excess and due to the rather low signal to noise, the position angle is badly constrained but is roughly consistent with both the PA deduced from previous images and the direction of the physical companion HR 4796 B.
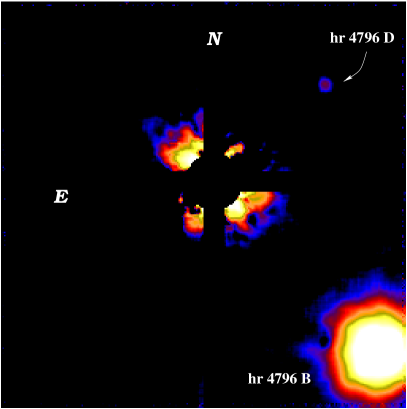


We extract the residual signal azimuthally averaged in the ranges of PA : and as a function of the distance from the star. We plot in Figures 2 and 3 the comparison with the noise on the image estimated in the regions perpendicular to the excess. Between about 1.1” and 2.3”, the NE and SW remaining signals appear above the noise whereas in the perpendicular region the residual signal fluctuates around 0 which characterizes the lack of circumstellar structure in the NW and SE regions. Although the signal to noise ratio is rather low close to the star, we find an azimuthally averaged surface brightness at 1.1” – 1.2” (75 – 80 AU) from the star : 12.2 mag.arcsec-2 quite similar to the range 11.7 – 12.7 mag.arcsec-2 measured in H band by Schneider et al. (1999) between 1.1” and 1.2”. The observed surface brightness is roughly proportionnal to but deconvolved images would lead to steeper slopes as also suggested by Schneider et al. (1999) observations.
3 Disk model assumptions
3.1 Grain distribution
We adopt a parametrical approach to describe the grain distribution in the disk similarly to that adopted to describe the Pictoris disk (Artymowicz et al. 1989) :
where is axisymmetrical grain density, and are respectively the radial and the vertical no-dimensional distributions and the grain density at the normalized distance when . The distance is fixed to 70 AU in all the simulations and is normalized so as to have .
Following Artymowicz et al. (1989), we assume a vertical distribution characterized by an exponential with a shape depending on the parameter ( :
where the radial shape of the vertical scale height depends on the parameter . is the normalized height when . This notation is useful because the integration of along the vertical axis () of the disk is proportionnal to . Therefore, the surface density of the grains, which is the interesting quantity to model the photometric data, can be written as :
where and ( is an non-dimensional variable).
We parametrize the radial distribution of the grains with a smooth combination of two power laws :
with and . The inner disk is assumed to be cut-off at the distance corresponding to the grain sublimation temperature ( 1800 K). The maximum of the surface density is not but also depends on , and :
| (1) |
with and . Outside this maximum, is roughly proportionnal to , and roughly proportionnal to inside. Finally, the SED computation requires a four parameters grain distribution : , , , and .
3.2 Grains characteristics
3.2.1 Composition assumptions :
We assume that the grains are porous aggregates made of a silicate core coated by an organic refractory mantle (Greenberg (1986) and references therein, Pollack et al. (1994)). Vaccum is assumed to fill the holes due to porosity. If the grain temperature is less than the sublimation temperature of the H2O ice (T K), the H2O ice is able to fill all or part of the vaccum in the grain. The relative abundances of each compound are given by the volume ratios : and , where , and are respectively the silicate, the organic refractories and the H2O volumes. The corresponding grain density is :
| (2) |
where the individual densities are : g.cm-3, g.cm-3 and g.cm-3. Given the Si+or aggregate porosity , the corresponding percentage of vaccum removed due to the presence of the H2O ice is therefore :
Li & Greenberg (1998) proposed two extreme types of dust in Vega-like disks :
amorphous or crystalline grains mainly depending on the evolution of the circumstellar environment and probably depending on the spectral type.
In this paper, we investigate the two following types of grains :
- 1.
- 2.
For all the models, we consider spherical grains and therefore we fixed the volume ratio to .

3.2.2 Optical properties computation :
We compute theorical absorption/emission and scattering efficiencies for spherical grains via Mie theory (Bohren & Huffman 1983) knowing the ratio where is the grain radius and knowing the complex index of refraction of the grain. In some extreme cases, Mie theory is not efficient : we used the Rayleigh-Gans theory when and or the geometric optics when and (Laor & Draine 1993).
We adopt the Maxwell-Garnett effective medium (MGEM) theory to compute for the mixture (Si + ”or” + H2O ice and/or vaccum) given the complex indexes of refraction of each compound, the volumes ratios and the porosity. We prefer the MGEM theory to the Bruggman effective medium (BEM) theory because the MGEM theory considers that a mixture is composed of an inclusion (the core) embedded in an homogeneous matrix (the mantle) whereas the BEM theory treats both components in the same way (Bohren & Huffman 1983).

3.2.3 Optical constants :
The wavelength dependence of the grain complex index of refraction depends on the individual compounds :
Silicates :
there is presently no consensus on what could be “representative” astronomical silicates. In the case of amorphous silicates, we arbitrarily adopt the modified (Laor & Draine 1993) Draine & Lee optical constants (Draine & Lee 1984; Draine 1985). In the case of crystalline silicates, we adopt the analytic complex indexes of refraction for crystalline olivine particles proposed by Mukai & Koike (1990) between m and m and we extrapolate (as Li & Greenberg (1998)) with Draine & Lee (1984) optical constants for m and m.
Organic refractories :
we adopt the optical constants computed by Li & Greenberg (1997) (a full discussion on organic refractories can be found in this paper).
H2O ice :
in the case of amorphous ice and between m and m, we use the optical constants derived from Fink & Sill (1982) ( K) combined with the K data from Hudgins et al. (1993). In the case of crystalline ice and between m and m, we adopt the hexagonal water ice optical constants at a temperature of about K derived by Ockman (1958) and Bertie et al. (1969). For both the amorphous and crystalline ices, we extrapolate with the Warren (1984) optical constants.
3.2.4 Grain size distribution :
The choice of the grain size distribution in the disk is a key step in the grain modeling. We assume either a single grain size () or a grain size distribution following the classical power law in the range which may be better suited if the grains result from collisions among larger bodies. We fixed , a typical value usually assumed for collisional disks (Hellyer 1970; Mathis et al. 1977). We use : so as to have :
Finally, the grains are characterized by their amorphous or crystalline nature and by the three free parameters : , and for a single grain size distribution or by the four free parameters : , , and for a power law grain size distribution. Some examples of the dust temperature and of the grain size corresponding to the H2O ice sublimation limit versus the distance from the star are plotted Figures 4 and 5 respectively.
| no | |||||||||||
| amorphous | |||||||||||
| #1 | 2.94 | -12.52 | 0.95 | 440 | 0.79 | 0.9 | 11.2 | 262 | 0.78 | 0.51 | 7.84 |
| #2 | 2.83 | -12.21 | 5.45 | 183 | 0.65 | 0.5 | 11.6 | 130 | 0.64 | 0.84 | 5.50 |
| #3 | 2.91 | -11.97 | 3.17 | 242 | 0.72 | 2.3 | 11.9 | 158 | 0.70 | 0.68 | 5.85 |
| crystalline | |||||||||||
| #4 | 2.88 | -10.49 | 8.11 | 147 | 0.93 | 38 | 5.7 | 59 | 0.58 | 0.59 | 3.04 |
| #5 | 3.11 | -7.27 | 1.06 | 391 | 0.975 | 19 | 6.7 | 114 | 0.79 | 0.28 | 4.21 |
| #6 | 3.30 | -11.85 | 0.74 | 505 | 0.975 | 15 | 7.5 | 148 | 0.83 | 0.23 | 4.09 |
4 Modelling
4.1 SED fitting assuming a single grain size distribution :
Our aim is to derive the dust distribution and to constrain the grains properties with the available measurements.
We already have a constraint on the peak of the grain distribution (). Indeed, the shape of the isophotes in scattered light at m and mm (Schneider et al. 1999) suggests faint anisotropic scattering properties for the grains at these wavelengths (see also 4.3.2) implying that the observed maximum surface brightness at roughly 70 AU is probably close to the peak of the grain distribution. We therefore fix AU.
We let the 6 remaining parameters free in their respective ranges :
-
•
the 2 grains distribution parameters : and in , and , respectively,
-
•
the 3 grains characteristics parameters : grain size in m , m, porosity in the range , if the grains are amorphous or in , if the grains are crystalline and percentage of H2O ice in % , %.
-
•
the normalized dust surface density : given a set of the 5 previous parameters, the normalized dust surface density is used as a flux scaling factor so as to provide the best fit of the SED.
As a first step, we try to fit the 10 – 100 m SED only. Our aim is to minimize the :
where are the simulated flux and the number of data and discuss afterwards the consistency with thermal and scattered light resolved images.
We start the minimization with a random vector of the parameters. One has to note that we limit to the ten data marked with a “”. Indeed, taking into account the numerous measurements at about 10 m, compared to the few data at larger wavelengths, would give a too high weight to this SED region. The probability gives us a criterion for the quality of the fit. For example, so as to have % we need with .
| no | ||||||||||||
| amorphous | ||||||||||||
| #7 | 1.08104 | 4 | 18 | 0.57 | 39 | 18 | 3 | 14 | 0.35 | 1.29 | 3.78 | 1.59 |
| #8 | 8.10103 | 5 | 410 | 0.63 | 35 | 18 | 3 | 294 | 0.41 | 1.14 | 2.81 | 5.25 |
| #9 | 1.69103 | 10 | 137 | 0.8 | 12 | 27 | 6 | 80 | 0.70 | 0.59 | 3.15 | 2.31 |
| crystalline | ||||||||||||
| #10 | 1.02103 | 12 | 246 | 0.93 | 18 | 54 | 5 | 101 | 0.77 | 0.36 | 1.98 | 1.78 |
| #11 | 1.27102 | 35 | 296 | 0.975 | 7 | 55 | 10 | 87 | 0.88 | 0.14 | 2.28 | 1.33 |
| #12 | 4.11101 | 64 | 116 | 0.975 | 4 | 84 | 18 | 34 | 0.94 | 0.10 | 3.15 | 0.85 |
We present Table 2 six different sets of the parameters which lead to the best 10 – 100 m SED fitting assuming a single grain size distribution and a single grain distribution.
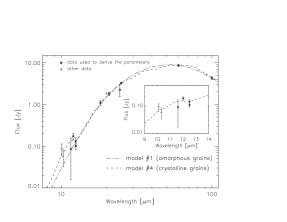
The 3 crystalline grains models satisfy the criterion : % whereas the amorphous grains models do not. Amorphous grains do not provide a proper fit of the 10 – 12.5 m data. The crystalline hypothesis reproduce very well the 10 m emission feature. Furthermore, the 10.1 m and 10.3 m data, not used to derive the parameters, are also well fitted with the model (Figure 6). Note that the 20 m – 100 m continuum is fitted both with crystalline grains and with amorphous grains.
Grains with m are needed to reproduce the shape of the SED (see Table 2 for the definition of ) which leads to grains sizes larger than m. Most of the grains are located further than the H2O ice sublimation distance (Figure 5) and have to be significantly icy : % (consistent with Jura et al. (1998) assumptions).
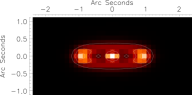
We find to be close to 3 and the outer surface density () to be steeper than (more probably as steep as ). Whereas the outer slope of the grain surface density is consistent with the scattered ligth images, the inner slope is not. It would induce much more light in the inner disk than observed. Indeed, an inner surface density yields an inner midplane surface brightness in scattered light less steep than at least (case of an edge-on disk assuming isotropic scattering properties for the grains, Nakano (1990)). As an example, we plot Figure 7 the surface brigthness contours for a 15 tilted (from edge-on) disk in scattered light at m.
Taking into account the constraint from scattered light images, we therefore try to derive the grains properties which could reproduce the 10 – 100m SED with . Such an inner slope acts as a cut-off for the short wavelengths efficient emitters which are located close to the star. Under these assumptions neither the crystalline nor the amorphous grains provide good fits of the 10 – 100m SED (Figure 8).

In the present case, we also exclude to add an inner dust distribution (typically inside 50 AU) to fit the SED at short wavelengths. In this scheme, the inner and outer disks would have similar contributions (flux) at 20 m (Figure 8), which is not compatible with 20 m resolved images (Koerner et al. 1998; Jayawardhana et al. 1998).
In conclusion, assuming a single grain size distribution, we are able to properly fit the 10 – 100 m SED but not the resolved images. Moreover, the presence of hot crystalline grains seems necessary to fit the 10 m measurements.
4.2 SED fitting assuming a grain size distribution proportionnal to :
We now assume a collisional grain size distribution proportionnal to between a minimum and a maximum grain size and . We also assume that the relative abundances of the different compounds and the porosity do not depend on the grain size.
We adopt a spatial grain distribution consistent with the scattered light images and therefore fix to 70 AU, the inner slope to and the outer slope to . The grain properties are now the free parameters left.
4.2.1 Single grain population :
We try to fit the SED by minimizing the associated to the 10 data marked with a “” in Table 1 plus the 850 m measurement. We keep the porosity and the percentage of H2O ice free in the same ranges as for the single grain size distribution and investigate the respective broad ranges m , m and m , m for the minimum and the maximum grain sizes.
The results are summarized in Table 3. Whatever the nature of the grains, the fits do not satisfy the criterion (% if ), but micronic to centimetric amorphous grains better reproduce the shape of the SED continuum than crystalline grains (Figure 9). Therefore, crystalline grains (if any) probably represent a minor part of the grain population in the annulus peaked at 70 AU. On the other hand, the 10 m measurements are not well reproduced with the amorphous grain model still suggesting (see previous section) the presence of a small amount of crystalline grains in order to significantly emit at 10 m but not at larger wavelengths. If there are crystalline grains at 70 AU, they are neither numerous nor hot enough to produce such a spectral energy distribution. Therefore, if the 10 m data are not overestimated (especially the 10.1 m, the 10.3 m and the 12 m measurements), we can exclude to fit the full SED from the NIR to the submillimeter wavelengths with the same dust population.
| no | |||||||||||
| amorphous | |||||||||||
| #13 | 1.79103 | 10 | 143 | 3.03 | 1.38 | 7 | 106 | 0.58 | 0.97 | 5.10 | 3.87 |
| #14 | 1.65103 | 10 | 291 | 2.12 | 2.06 | 7 | 214 | 0.59 | 0.96 | 5.10 | 5.43 |
| #15 | 1.38103 | 11 | 36 | 0.13 | 2.72 | 8 | 27 | 0.60 | 0.95 | 5.58 | 2.01 |
| crystalline | |||||||||||
| #16 | 2.70101 | 80 | 208 | 2.95 | 17.3 | 33 | 86 | 0.90 | 0.20 | 8.00 | 2.58 |
| #17 | 1.12102 | 38 | 359 | 6.54 | 22.8 | 16 | 148 | 0.87 | 0.24 | 4,53 | 2.76 |
| #18 | 9.94101 | 41 | 276 | 6.49 | 23.5 | 17 | 114 | 0.87 | 0.24 | 4.80 | 2.50 |

4.2.2 Two grain populations :
The cold annulus :
We now assume that the excesses at large wavelengths mainly come from the annulus resolved in scattered light. This is consistent in terms of spatial extension with the disk observed at 20.8 m (Koerner et al. 1998) suggesting that the same dust population may be responsible for both the 20.8 m and the 1.1 m images.
We therefore try to fit the 5 data at wavelengths larger than 20 m (excluding the 24.5 m and 450 m data due to too high uncertainties) and try to constrain the grains properties consistent with the colder part of the SED. We fix the porosity to 0.6 for amorphous grains or to 0.93 for crystalline grains as suggested by the full SED fitting (Table 3). We keep the three parameters , and free in the same ranges as in the previous subsection (4.2.1).
The results of the minimization are summarized in Table 4 and Figure 10 shows the best fits for each grain nature. The cold SED continuum is remarkably well fitted (% if ) with amorphous grains whereas the crystalline grains lead to very poor . Very little icy grains (%) with sizes larger than 10 m (15 m if we assume ) are required to fit the 20 – 25 m data and bodies as large as a few meters are necessary to correctly reproduce the submillimeter excess. This leads to an outer disk mass larger than a few Earth masses.

The hot dust population :
At 20.8 m, the simulated cold annulus (model #13) contributes to about 90% of the measured excess at this wavelength. Therefore and conversely to the single grain size model, the addition of a second grain population would not modify the consistency between the simulated thermal images at 20.8 m and the observations.
We therefore subtract the simulated flux coming from the outer annulus (model #13) to the observed excesses and try to fit the remaining excesses with a second dust distribution made of crystalline grains (suggested by the single grain size distribution fitting (section 4.1)). The full SED assuming two grain populations is now very well fitted (see Figure 11). In this example, the inner dust distribution represents a mass of about made of 450 m crystalline grains () peaked at 9 AU from the star and heated at about 210 – 220 K (see for example Figure 4).

 Cold annulus alone ( 1.6 Jy)
 Cold annulus + hot dust population
( 0.2 Jy)
Cold annulus + hot dust population
( 0.2 Jy)
4.3 Images
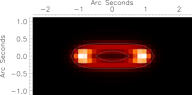
We now adopt the two grain populations model from previous section (4.2.2) : an amorphous dust population peaked at 70 AU (model #13) plus a crystalline dust population at 9 AU from the star. We assume a disk inclination of 15 with respect to the line of sight.
4.3.1 Thermal images
We simulate the disk in thermal emission so as to derive further informations on the vertical shape of the disk (parameters , and assumed to be constant over all the disk). We actually have very few constraints on the vertical shape of the disk, also we arbitrarily start with parameters derived for Pictoris disk : opening angle of the disk (i.e. AU), and (Mouillet et al. 1997a). We plot (Figure 11) the simulated disk at m. The simulated vertical height to radial height ratios for a given isophote are between 0.32 and 0.35 ; they compare very well with the values 0.350.5 from Koerner et al. (1998).
If we afterwards simulate the thermal images for different sets of the parameters , and , we get a few interesting results :
-
•
The normalized height at AU is probably less than about 7 – 8 AU leading to opening angles of the disk smaller than about 15. For example, AU provides a too large vertical structure and the vertical spreading of the dust yields a smaller surface flux density for the outer annulus compared to the inner one. Such a high constrast is not observed.
-
•
The parameter is badly constrained : 0.75 provides a good shape of the isophotes (Figure 11) but 1.5 might also be a correct value.
-
•
Given the resolution of the observations, the parameter is completly undetermined.
4.3.2 Scattered light images
To simulate the scattered light images, we adopt the empirical Henyey-Greenstein phase function (Henyey & Greenstein 1941) which depends on the single parameter ( for isotropic scattering and for total forward or backward scattering). Indeed, theoretical phase functions from Mie theory are probably not realistic for porous fluffy grains.
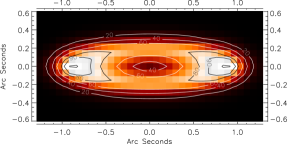
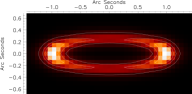
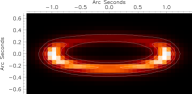
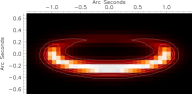
We simulate at m the cold annulus, which is responsible for the scattered light images, assuming different values of the parameter . As anticipated, due to the disk inclination with respect to the line of sight, the morphology of the observed disk strongly depends on the anisotropic scattering properties (Figure 12). The observed isophotes at m (Schneider et al. 1999) implies that the asymmetry factor is smaller than 0.15.
At 1.1 m, the simulated cold annulus scattered a total flux close to 8.6 mJy (5.0 mJy at 1.6 m) assuming . The integrated flux density corresponding to the detected part of the annulus with HST (outside 0.65” in radius) represents 5.2 mJy at m, i.e. only slightly smaller than 7.50.5 mJy from Schneider et al. (1999).
We also simulate the disk in K’ band. At 1.1” from the star along the major axis of the annulus, the flux density is about 16 Jy in a 0.05”0.05” pixel. The corresponding surface brightness is about 12.5 mag.arcsec-2 consistent with the 12.20.5 mag.arcsec-2 measured between 1.1” and 1.2” (subsection 2.3.2).
4.4 Summary of model results
Our model involves two dust components :
-
•
a cold annulus peaked at 70 AU from the star made of ISM-like grains in terms of chemical composition (amorphous) and porosity () and a very few icy. Assuming a collisional grain size distribution (), we infer a minimum grain size in the ring of m and we find that bodies as large as at least a few meters may have already been formed. This leads to a total dust mass of a few Earth masses held in a very narrow annulus.
-
•
an inner dust population at about 9 – 10 AU from the star made of very porous () crystalline grains responsible for the emission feature at m and for the slight excess centered on the star in the m images (Koerner et al. 1998).
5 Implications of the results on the disk dynamics
5.1 Gas to Dust ratio
It is of interest to assess the gas to dust ratio in the disk. Given the upper limit on the gas mass derived by Greaves et al. (1999) and the dust mass from model #13 which can be reasonably considered as a lower limit (see also 5.4.1), we infer a gas to dust ratio less than 1. In this scheme, the gas would probably not play anylonger an important role, as claimed by Greaves et al. (1999).
5.2 Radiation pressure

The ratio of radiation pressure to gravity as a function of the grain size is given by :
assuming and . We find a blow-out grain size limit () close to m for the amorphous grains in the cold annulus (Figure 13). Also, amorphous grains with sizes between m () and about m () have orbits significantly excentric. Interestingly, the smallest grains we find in our fits in the cold annulus : m is very close to the blow-out size limit. For the crystalline grains at 9 AU from the star, the blow-out grain size limit is close to m (Figure 13). The grains deduced from our modelling are then gravitationally bound.
5.3 Times scales and dominant processes
The life times of the grains in the disk under Poynting-Robertson drag, collisions and sublimation, can be written respectively as (e.g. Backman & Paresce 1993) :
where is the absorption efficiency averaged over the star spectrum,
where is the Keplerian circular rotation frequency at radius , and the grain size square averaged over the grain size distribution,
where is the equivalent grain radius for a pure ice sphere with the same mass of ice as in a grain with a size . The time-scales for the cold annulus and the hot dust population are summarized in Table 5.
| Cold | ||||
|---|---|---|---|---|
| Hot |
Collisions are then the dominant process in the cold annulus. The smallest grains produced by collisions in very short time-scales are not efficiently removed from the ring by Poynting-Robertson drag. Only radiation pressure is then able to explain the minimum grain size (m) derived from the SED fitting. Also, this is consistent with the fact that this minimum grain size is very close to the blow-out size limit. Of course, this argument applies only if the gas does not play an important role, as suggested in a previous subsection (5.1). At 70 AU from the star, the H2O ice within the smallest grains is sublimated in a short time-scale in comparison with the star age. This is consistent with the little percentage of H2O ice required to fit the 20 – 25 m SED (subsection 4.2.2).
The hot dust population is poorly constrained; the time-scales in Table 5 have then to be taken with care. The life time of the m crystalline grains under Poynting-Robertson drag is long compared to the collision time-scale, and even m crystalline grains with have about 4 times larger than . Also, collisions and radiation pressure are probably the two main processes which shape the hot dust distribution.
5.4 Ring Dynamics and confinement
5.4.1 Collision dynamics and Mass loss
We here consider the implications of the model parameters for the ring centred at AU given in Table 4. As representative example we consider model #13. This has a total grain surface density grains.cm-2. For the assumed size distribution (), the mean collision time for the smallest grains with m is approximately yr. As these grains are at the radiation pressure blow out limit and the majority of grains have the minimum size, the minimum mass loss rate is given by :
where cm2 is the area of the annulus. For model #13 this corresponds to yr-1. Thus the dust mass reservoir required to supply this mass loss over the age of the system is which corresponds to a surface density in solids g.cm-2.
It is of interest to note that if we assume a gas to dust ratio of in the primordial nebulae, this corresponds to a surface density for the original protostellar disk. This surface density is consistent with that expected at AU for standard disk models corresponding to a minimum mass solar nebula (e.g. Papaloizou & Terquem 1999).
If the surface density resides predominantly in objects with m, their collision time would be yr. This is still shorter than the age of the system. With a ring aspect ratio of for instance, collisions are expected to occur with a relative velocity km.s-1, and are likely to be destructive. In order to have a collisional lifetime greater than the star age, the objects would have to have larger than about m. A population of such larger objects providing a mass source for those with m, may exist but they would not be detectable. In that case the disk mass could be significantly larger than .
5.4.2 Formation, vertical height and possible presence of larger bodies
In the standard model of planetary formation (Weidenschilling & Cruzzi 1993), objects in the size range m – km are formed by accumulation of smaller objects through collisions when there was still gas present. The presence of gas drag, effective enough here with g.cm-2, would be essential to damp eccentricity and inclination so collisions occur with small relative velocity. However, the collision timescales would be the same as estimated above. Thus it is reasonable that objects as large as m could be formed if the gas residence time was similar to the present age of the system.
When significant amount of gas was present during earlier phases, the disk would be expected to be thin because of gas drag (Weidenschilling & Cruzzi 1993) but this could have been thickenned due to gravitational perturbations from large external objects. Unfortunately the observations are not yet able to provide contraints on the vertical thickness, but this does not affect the discussion about mass loss rates or collision times because these are independent of the vertical thickness.
5.4.3 Radial confinement
The fact that the mass distribution in the ring is tightly radially confined to a width of about times the mean radius, which may be comparable to its vertical thickness, gravitational confinement mechanisms may operate to sculpt its form. As it is likely that many collisions are required to reduce a metre sized object to fragments small enough to be blown out by radiation pressure, if the the vertical thickness is as much as , the ring should be significantly wider without a confinement mechanism. Even if the ring is very thin as it might have been immediately post formation so that little collisional spreading occurs, a mechanism is still required to explain why the protostellar gaseous disk was truncated at around 70 AU.
Confinement may occur through gravitational interaction with external perturbers. This situation is familiar in the case of planetary rings (Goldreich & Tremaine 1982) where the interaction with external orbiting satellites provides confinement. It also occurs for accretion disks in close binary systems where interaction with a binary companion truncates the disk (Papaloizou & Pringle 1977). The presence of a binary companion in the system discussed here is suggestive that it could play a role in determining the location of the outer boundary to the disk as well as pumping up inclinations after gas dispersal. Note also that an exterior as yet undetected giant planet might provide a similar role.
The binary companion HR 4796 B is seen at a projected distance of AU from the central star whereas the outer disk radius is AU. Thus if it is to play any role in confinement the orbit should be eccentric. As significant interaction with the ring requires the pericentre distance to be less than three times the ring radius, the minimum value for the eccentricity is thus , although it could be significantly larger on account of projection effects.
Disk edge truncation can be effective in the presence of binary companions with significant mass ratio in circular or eccentric orbits. In the case of very eccentric orbits, as may well be the case here, the truncation process is most easily modelled as a succession of encounters which occur at each pericentre passage (Ostricker 1994; Korycansky & Papaloizou 1995; Hall 1997). From these studies it is clear that in order to be truncated, the disk radius should initially exceed about one third of pericentre distance. Material beyond this radius is strongly perturbed and removed from the disk which develops a truncated edge there. The latter phenomenon, which occurs because of angular momentum transported from the disk to the companion, was seen in the gas disk simulations of Korycansky & Papaloizou (1995) and the free particle simulations of Hall (1997) and is also expected for the disks of the type considered here.
6 Conclusion
We propose a two dust populations model able to reproduce all the available observations of the HR 4796 A circumstellar disk. The first dust population, peaked at 70 AU from the star, shapes like a narrow annulus. Its small radial extension suggests a gravitational confinement mechanism both outside and inside the peak at 70 AU. This ring is made of amorphous grains quite similar to those found in the interstellar medium. Under the assumption of a collisionnal grain size distribution, grains larger than m to meter sized bodies are required to fit the data. Collisions, occuring in short time scales, are expected to produce smallest grains down to the blow out size limit (m). This conclusion applies because of the gas to dust ratio smaller than 1 inferred. The second dust population at 9-10 AU from the star is made of comet-like grains. Higher signal to noise ratio measurements and resolved images at m would allow to better constrain this dust population (spatial extension, grain size range) and its dynamics.
The dust surrounding HR 4796 A probably shows an intermediate stage for the circumstellar matter between pre-main sequence stars and evolved ones like Pictoris, Fomalhaut, Vega, 55 Cnc …The presence of a companion (HR 4796 B) is also an interesting peculiarity among the Vega-like stars. As a large number of field stars are members of binary (or more) systems, HR 4796 A does not represent a marginal case. Therefore, the dynamics of the disk has to be further studied, in terms of chemical evolution of the grains and dust distribution to better understand the steps which lead or not to planetary systems formation.
Acknowledgements.
We wish to thank G. Schneider and J.S. Greaves for providing data prior to publication and S. Warren for providing water ice optical constants. We also thank Hervé Beust for helpfull discussions on the dynamics of the system. All the computations presented in this paper were performed at the Service Commun de Calcul Intensif de l’Observatoire de Grenoble (SCCI).References
- Artymowicz et al. (1989) Artymowicz P., Burrows C., Paresce F., 1989, ApJ 337, 494
- Artymowicz et al. (1994) Artymowicz P. & Lubow S.H., 1994, ApJ 421, 651
- Backman et al. (1992) Backman D., Gillett F.C. and Witterborn F.C., 1992, ApJ 385, 670
- Backman & Paresce (1993) Backman D. and Paresce F. 1993, in Protostars and Planets III, (ed. E.H. Levy and Lunine), Tucson: University of Arizona Press, p. 1253
- Bertie et al. (1969) Bertie J., Labbe H. & Walley E., 1969, J. Chem. Phys., vol. 50, 4501
- Bohren & Huffman (1983) Bohren C.F., Huffman D.R., 1983, Absorption and scattering of light by small particles, Wiley, New-York
- Draine & Lee (1984) Draine B.T. & Lee H.M., 1984, ApJ 285,89
- Draine (1985) Draine B.T., 1985, ApJS 57, 587
- Fajardo-Acosta et al. (1998) Fajardo-Acosta S.B., Telesco C.M. & Knacke R.F., 1998, AJ 115, 2101
- Fink & Sill (1982) Fink & Sill, in Comets, U. Arizona Press, 1982
- Goldreich & Tremaine (1982) Goldreich P. & Tremaine S., 1982, ARA&A, 20, 294
- Greaves et al. (1999) Greaves J.S., Mannings V. & Holland, 1999, submitted in Icarus
- Greenberg et al. (1972) Greenberg J.M., Yencha A.J., Corbett J.W. & Frisch H.L. 1972, Mem. Soc. Roy. des sciences de Liege, 6e Serie, tome IV, p.425
- Greenberg (1986) Greenberg J.M., 1986, in Light on Dark Matter, Israel F. (eds), Reidel, Dordrecht, p.177
- Greenberg & Hage (1990) Greenberg J.M. and Hage J.I., 1990, ApJ 361, 260
- Greenberg (1998) Greenberg J.M., 1998, A&A 330, 375
- Hall (1997) Hall S.M., 1997, MNRAS, 287, 148
- Hellyer (1970) Hellyer B., 1970, MNRAS 148, 383
- Henyey & Greenstein (1941) Henyey L.G., Greenstein J.L., 1941, ApJ 93, 70
- Hudgins et al. (1993) Hudgins D.M., Sandford S.A., Allamandola L.J., Tielens A.G.G.M, 1993, ApJS 86, 713
- Jayawardhana et al. (1998) Jayawardhana R., Fisher S., Hartmann L., Telesco C., Pina R., Fazio G., 1998, ApJ, 503, L79
- Jura et al. (1993) Jura M., Zuckerman B., Becklin E.E. and Smith R.C., 1993, ApJL 418, L37
- Jura et al. (1995) Jura M., Ghez A.M., White R.J., McCarthy D.W., Smith R.C. and Martin P.G., 1995, ApJ 445, 451
- Jura et al. (1998) Jura M., Malkan M., White R.J., Telesco C., Pina R. & Fisher R.S., 1998, ApJ 505, 897
- Kalas & Jewitt (1993) Kalas P., Jewitt D., 1993, BAAS 25, 1353
- Koerner et al. (1998) Koerner D.W., Ressler M.E., Werner M.W., Backman D.E., 1998, ApJ, 503, L83
- Korycansky & Papaloizou (1995) Korycansky D.G. and Papaloizou J.C.B., 1995, ApJS, 105, 181
- Laor & Draine (1993) Laor A. & Draine B.T., 1993, ApJ 402, 441
- Lecavelier des Etangs et al. (1996) Lecavelier des Etangs A., Vidal-Madjar A. & Ferlet R., 1996, A&A 307, 542
- Li & Greenberg (1997) Li A. & Greenberg J.M., 1997, A&A 323, 566
- Li & Greenberg (1998) Li A. & Greenberg J.M., 1998, A&A 331, 291
- Mathis et al. (1977) Mathis J.S., Rumpl W. and Nordsieck K.H., 1977, ApJ 217, 425
- Mathis & Whiffen (1989) Mathis J.S. & Whiffen G., 1989, ApJ 341, 808
- Mathis (1996) Mathis J.S., 1996, ApJ 472, 643
- Mouillet et al. (1997a) Mouillet D., Lagrange A.M., Beuzit J.-L., 1997a, A&A 324, 1083
- Mukai & Koike (1990) Mukai T. & Koike C., 1990, Icarus 87, 180
- Nakano (1990) Nakano T., 1990, ApJL 355, 43
- Ockman (1958) Ockman N., 1958, Adv. Phy., vol. 7, 199
- Ostricker (1994) Ostricker E.C., 1994, ApJ, 424, 292
- Pantin et al. (1997) Pantin E., Lagage P.-O., Artymowicz P., 1997, A&A 327, 1123
- Papaloizou & Pringle (1977) Papaloizou J.C.B. & Pringle J.E., 1977, MNRAS 181, 441
- Papaloizou & Terquem (1999) Papaloizou J.C.B.& Terquem C., 1999, ApJ, In Press
- Pollack et al. (1994) Pollack J.B., Hollenbach D., Beckwith S., Simonelli D.P., Roush T. & Fong W., 1994, ApJ 421, 615
- Schneider et al. (1999) Schneider G., Smith B.A., Becklin E.E., Koerner D.W., Meier R., Hines D.C., Lowrance P.J., Terrile R.J., Thompson R.I., Rieke M, 1999, ApJL, 513, 127
- Stauffer et al. (1995) Stauffer J.R., Hartmann L.W., Barrado y Navascues D., 1995, ApJ 454, 910
- Warren (1984) Warren, S., 1984, Appl. Opt. 23, 1206
- Weidenschilling & Cruzzi (1993) Weidenschilling S.J. and Cruzzi J.N., 1993, in Protostars and Planets III, (ed. E.H. Levy and Lunine), Tucson: University of Arizona Press, p. 1031