Multifrequency Studies of Bright Radio Supernova Remnants. III. X-ray and Radio Observations of 3C 397
Abstract
Radio-bright, presumably young supernova remnants offer the opportunity of studying strong-shock physics and the nature of the interaction of ejected material with the surrounding medium. The relation between radio and X-ray morphology varies considerably among supernova remnants, with important implications for the physics of the emission processes at different wavelengths. We use Very Large Array (VLA) and Roentgen Satellite (ROSAT) images of the radio-bright supernova remnant 3C 397 (G41.1–0.3) to examine the shock structure in both thermal X-ray emission and nonthermal radio emission. The unusual rectangular morphology can be seen in VLA maps at 20 and 6 cm wavelength at a resolution of , and in ROSAT High-Resolution Imager (HRI) images. The X-ray images resemble the radio strongly, except for a small, possibly unresolved X-ray hot spot near the center. There is no variation in the X-ray hardness ratio from ROSAT Position Sensitive Proportional Counter data across the remnant, suggesting that at least between 0.4 and 2 keV, the interior emission is not different in character from that in the bright shell regions. Thus 3C 397 is not a member of the “thermal composite” or “mixed-morphology” class (Rho & Petre 1998). The remnant is unpolarized at 20 cm, and has a mean fractional polarization of at 6 cm. The polarized flux, and polarized fraction, peak inside the remnant at a location not coincident with either an internal maximum in total-intensity radio emission, or with the X-ray hot spot. Spectral-index maps between 6 and 20 cm do not show any systematic differences associated with interior emission; there appears to be no “plerionic” or pulsar-driven component in 3C 397 at least as normally characterized by high polarization and a flat radio spectrum. Spectral-index values spread about the mean by about , a result consistent with previous work. The steep total-intensity profile off the SW edge of 3C 397 allows an inference of the upstream electron diffusion coefficient, and implies a mean free path for electron scattering shorter than in the general interstellar medium but longer than that similarly inferred for Tycho and SN 1006 (Achterberg, Blandford & Reynolds 1994). A simple analysis based on the observed X-ray flux gives an estimate of the mean density in 3C 397 of about 4 cm-3, which would also be enough to depolarize the 20 cm emission completely, as observed. The remnant age is then of order yr, and the current shock velocity about 1600 km s-1. Finally, we speculate on possible mechanisms producing the X-ray hot spot.
Subject headings:
supernova remnants — polarization — radiation mechanisms: non-thermal — shock waves — X-rays: general — radio continuum: general1. Introduction
1.1. X-ray and Radio Comparisons of Supernova Remnants
Understanding and modeling emission from supernova remnants (SNRs) can provide a rich mine of astrophysical information. The physics of strong shocks has applications beyond SNRs to encompass phenomena as diverse as the earth’s bow shock and extragalactic jets. It has been long believed that SNRs play an important, perhaps determining role in the structure of the interstellar medium. Recent observations seem to confirm that SNRs are the source of cosmic rays (Koyama et al. 1995; Tanimori et al. 1998) and may produce gamma-ray emission (Pohl & Esposito 1998). To examine in more detail the physics of these processes, and to study the interaction of remnants with their immediate surroundings, the ideal targets for study would be young remnants, with high shock velocities, and with high surface brightnesses so that they are easy to observe, and are likely to be in the well-characterized Sedov evolutionary phase.
Like 3C391 (Moffett & Reynolds 1994a, hereafter Paper I) and W49B (Moffett & Reynolds 1994b, hereafter Paper II), subjects of previous study by our group, 3C 397 was selected from a list of the ten highest radio-surface-brightness shell remnants in the Galaxy at 1 GHz. The characteristics of 3C 397 are detailed in Table Multifrequency Studies of Bright Radio Supernova Remnants. III. X-ray and Radio Observations of 3C 397.
3C 397 has striking characteristics that make it ideal for addressing questions of supernova-remnant physics. Its high radio brightness suggests that it is relatively young, perhaps a transition between the historical shells and older remnants with radiative shock waves such as the Cygnus Loop. Becker, Markert, and Donahue (1985) found internal polarization they described as coincident with interior radio emission, implying the possibility that 3C 397 might harbor a pulsar-driven nebula or “plerion” in its interior. Einstein observations failed to detect enough emission to give a good idea of the X-ray morphology, which was essentially unknown until our observations. Thus it was completely unclear whether 3C 397 would show the strong radio–X-ray morphological correlation characteristic of the historical shells, or the center-brightened X-rays shown by older but still bright remnants such as W49B (Paper II & Pye et al. 1984). Proper classification of 3C 397, and characterization of its X-ray emission as shell-like, thermal but center-brightened, or plerionic, is clearly critical to further understanding of this object.
As will be detailed below, we have found that the X-ray emission from 3C 397 is highly spatially correlated with the radio. The similar morphology leads to several straightforward questions: To what extent does the X-ray emission track the edge of the radio emission? How does the location of the X-ray edge, where electrons are heated, compare to that of the radio edge, presumably the shock location? Do the edge profiles have the same shape? Can we detect spectral index variations within the remnant and how are they correlated with other emission?
1.2. Previous Observations of 3C 397
3C 397 (G41.1–0.3) has also been referred to in the literature as HC26, NRAO597, PKS1905+07 and CTB67. The source originally identified as 3C 397 is now known to be two sources, the SNR (3C 397 E) and a thermal H II region (3C 397 W). Failure by early single-dish measurements to resolve the two sources complicates flux determinations, as we discuss later. We will follow standard usage and will refer to the SNR alone as 3C 397. H I absorption measurements place the SNR at 6.4 kpc, the tangent point in that direction (Caswell et al. 1975, corrected to a solar Galactocentric distance of 8.5 kpc). No absorption is seen at negative velocities, locating the remnant closer than 12.8 kpc. For our calculations, we will assume a nominal distance to the SNR of 10 kpc, at which distance pc and pc.
Observations of the radio recombination lines H 159 and H 159 by Cersosimo & Magnani (1990) place the H II region at a near distance of 3.6 kpc or a far distance of 9.3 kpc. H 110 measurements by Downes et al. (1980) give identical values (after correction to a solar Galactocentric distance of 8.5 kpc). Caswell et al. (1975) favor the near distance to the HII region, since it would explain the smaller fractional absorption at higher velocities they observed. Relatively strong foreground free-free absorption in the spectrum of 3C 397 ( at MHz; Kassim 1989a) could conceivably be due to the outer fringes of the H II region if it is in front of 3C 397. As we report below, there is no morphological evidence for interaction between the SNR and the H II region, and we shall assume the H II region is a foreground object.
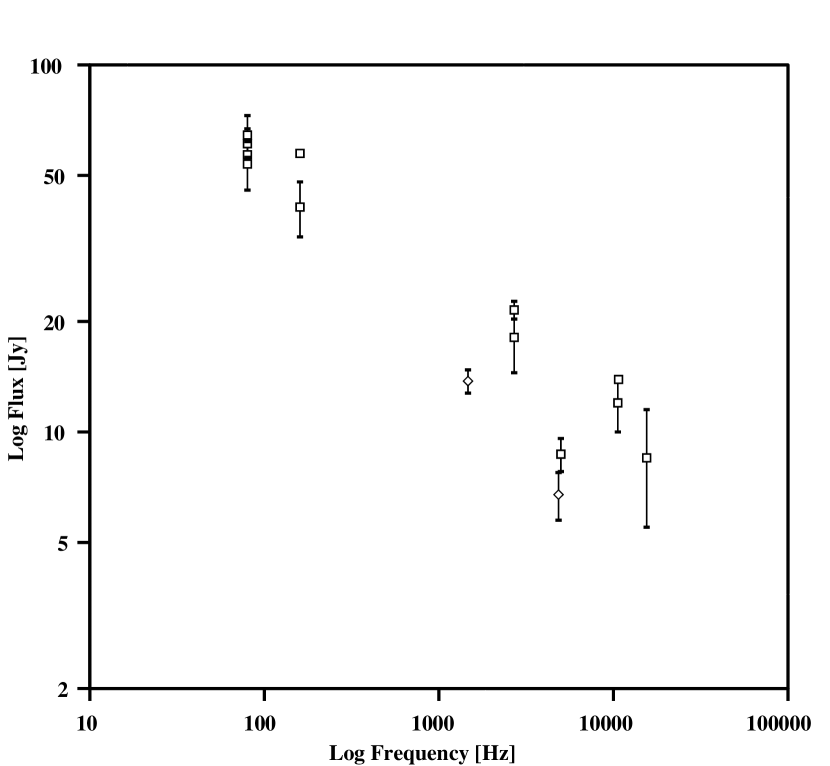
The total flux density of 3C 397 at centimeter wavelengths is quite uncertain (see Fig. 1 for a compilation from the literature). Recent 330 MHz observations by Kassim (1992) found a flux of 38 Jy for 3C 397, consistent with his earlier study at 30.9 MHz (Kassim 1989b) which reported a spectral fit to his and earlier data of a power-law with index () and a low-frequency exponential turnover due to foreground free-free absorption, with optical depth unity around 30 MHz. This fit gives a nominal 1 GHz flux of 27 Jy. Green ’s (1998) catalogue lists a flux of 22 Jy at 1 GHz, with a spectral index of . Green’s estimated fluxes are then 18.3 and 10.3 Jy at 20 and 6 cm, respectively, while Kassim’s fit gives 23 and 14 Jy. In inspecting the original literature reporting single-dish fluxes for 3C 397, we found that many reports involved instruments with insufficient angular resolution to separate the H II region from the SNR. Furthermore, 3C 397 sits in a region of high Galactic background. The 1.4 GHz Bonn survey (Reich, Reich & Fürst 1990) found and removed a smoothly varying background of 54 mJy arcmin-2 near 3C 397. A smaller plateau of brightness about 19 mJy arcmin-2 was not removed, and is visible on the survey maps in the vicinity of the remnant. We conclude that the spectrum of 3C 397 is so poorly known at this time that the spectral index is uncertain by several tenths, and the total fluxes at 20 and 6 cm by factors of at least 2. This lack of agreement will hamper our attempts to interpret spectral index information below.
Becker, Markert & Donahue (1985) observed 3C 397 with the National Radio Astronomy Observatory’s (NRAO) Very Large Array111The National Radio Astronomy Observatory is a facility of the National Science Foundation operated under a cooperative agreement by Associated Universities, Inc. (VLA) at 6 and 20 cm with a resolution of 14″, to get a quick idea of its radio morphology. They first described its box-like shape, partial shell, and significant interior emission. They detected some polarization at 6 cm which they described as coincident with the peak of the interior total intensity. A detailed spectral-index study of 3C 397 was carried out by Anderson & Rudnick (1993), also with the VLA at 20 and 6 cm and a resolution of 14″. They reported spectral-index variations of order across the remnant, and found, in keeping with other young remnants, that these variations do not coincide with total intensity features. They concluded that spectral variations must be determined by different mechanisms than brightness variations, and found no obvious explanation.
In the first Einstein Slew Survey (Elvis, et al. 1992), 3C 397 had an Imageing Proportional Counter (IPC) count rate of 0.45 cts s-1 in an exposure of 14 seconds. Becker et al. (1985) observed 3C 397 with the Einstein High-Resolution Imager (HRI), IPC, and Monitor Proportional Counter (MPC), detecting 200 counts in a 3200-second HRI exposure and 480 counts in an 800-second IPC exposure. The HRI image had low signal to noise but both the IPC and the HRI images indicated some emission associated with the interior of the radio shell. Thermal fits to the IPC and MPC data did not agree on temperature or column density.
No emission is apparent at the location of the SNR in the Palomar sky survey, or in the Infrared Astronomical Satellite (IRAS) catalog of supernova remnants by Saken, Fesen & Shull (1992). Lack of optical detection is not surprising given 3C 397’s location in the Galactic plane and distance of order 10 kpc.
2. Observations
2.1. Radio Observations & Method
We observed 3C 397 with the VLA at wavelengths of 6 and 20 cm (4847 MHz and 1468 MHz) in B, C and D configurations between 1990 April and 1992 January as described in Table 2. Reduced bandwidths of 6250 kHz were used at 20 cm to reduce bandwidth depolarization, with the two intermediate frequency (IF) channels 1 and 2 separated by 50 MHz in all cases. We observed 3C 286 (1328+307) as our primary flux calibrator and 1821+107 as the secondary (phase) calibrator and to remove instrumental polarization. The fluxes for 3C 286 were calculated using new VLA coefficients: at 1446 MHz, 14.7417 Jy; at 1496 MHz, 14.5014 Jy; at 4836 MHz, 7.5419 Jy; and at 4886 MHz, 7.5903 Jy. The data were calibrated and edited using NRAO’s Astronomical Image Processing System (AIPS). Visibility data at each frequency were combined to provide projected interferometer baseline coverage from 0.03 to 3.4 km (400–52000 ) at 6 cm and 0.03 to 11.4 km (200–5300 ) at 20 cm.
We mapped the data with the AIPS task MX with uniform weighting and deconvolved images using both the CLEAN algorithm (with a taper of 35k at 6 and 20 cm to improve the shape of the dirty beam but without adding zero spacing flux) and VTESS, a maximum entropy method. VTESS super-resolves features with high signal-to-noise; we convolved the VTESS image with the CLEAN beam before analysis. The images were corrected for the primary-beam response of the individual VLA antennas. We used the Stokes polarization images to gauge intrinsic sensitivity, since no circular polarization beyond “beam squint” was expected. The final sensitivities achieved at each band are quoted in Table 3. An rms of about five times the theoretical thermal noise was achieved in the CLEAN maps (integration time was 60 minutes with a bandwidth of 25 MHz at 6 cm and 6.25 MHz at 20 cm, see Table 2). As expected for the galactic plane the images were confusion limited. For VTESS, arbitrary values of noise can be specified, but the algorithm was unable to converge for values lower than about three times the theoretical noise. As discussed in Paper I, §2 the difficulties of deconvolving low-surface-brightness extended sources like SNRs often result in noise levels considerably higher than theoretical. Table 4 compares the theoretical and measured noise.
We compared the CLEAN and maximum entropy deconvolutions as a guide to the reality of faint features. Those we describe are present in images from both methods and are therefore likely to be real.
2.2. X-ray Observations
3C 397 was observed by the X-ray Roentgen Satellite (ROSAT) with the Position-Sensitive Proportional Counter (PSPC) on 1992 September 28, and with the High-Resolution Imager (HRI) between 1994 October 14 and 21. Information on these observations is given in Table 5.
The IRAF/PROS software was used, supplemented with XSPEC and FTOOLS 4.1, to analyze the X-ray data. Because of the small size of the remnant compared to the ROSAT telescope field of view, vignetting corrections were not necessary. PSPC spectral data were obtained from a circular region of radius 170″, with background determined from a concentric annulus of inner and outer radii 170″ and 338″. The HRI image was smoothed with a Gaussian of full width at half max (FWHM) 6″, since the relatively low X-ray surface brightness resulted in the point-source response not being fully sampled over most of the remnant.
3. Results
3.1. Radio
3.1.1 Total Intensity Images
The total-intensity images presented here have about twice the resolution of earlier observations. The synthesized beams and sensitivities of the images are given in Table 3. On the shortest baselines we detected 18 Jy at 20 cm (this includes both the SNR and the HII region, approximately 4 Jy) and 5.5 Jy at 6 cm. At 20 cm we should be sensitive to most of the flux from the remnant, though our value of about 14 Jy is somewhat lower than most published values (see Fig. 1). As we state in the Introduction, the huge dispersion in published fluxes indicates to us that our value of about 14 Jy is not obviously contradicted by other work. However, we do suspect that substantial flux is missing at 6 cm. In our final cleaned maps we detect, in the SNR, 5.8 Jy at 6 cm and 13.8 Jy at 20 cm. A negative bowl does appear around the remnant in our 6 cm images, indicating missing flux. The depth of the bowl, of order 1–2 mJy, would give a total flux deficit of about 1–2 Jy if distributed uniformly.
As mentioned above, we looked for artifacts due to the deconvolution by comparing these cleaned images with images deconvolved using the AIPS maximum-entropy algorithm VTESS. This routine constructs maximally smooth maps constrained to fit the data to within a given noise tolerance. If the total flux in the source is known, it can be given as an additional constraint. In our case, since the total flux of 3C 397 is very poorly known and the H II region is also in the field, we allowed VTESS to optimize the fit by varying the total flux. It returned values of 23.7 Jy at 20 cm and 9.75 Jy at 6 cm, part of which belongs to the H II region and the positive bias background. After primary-beam correction, the flux in the remnant measured from these images was found to be 14.1 and 6.0 Jy at 20 and 6 cm, respectively. These values are comparable to those obtained from the CLEAN maps. The presence of the large H II region, partially resolved out at 20 cm and both partially resolved out and suffering from primary-beam attenuation at 6 cm, made image reconstructions unreliable at the level of a few mJy beam-1. This is a small amount compared to the brightness of significant features, but can cause serious offsets in inferred values of spectral index, as we discuss below. We quantified the level of uncertainty due to deconvolution by subtracting VTESS from CLEAN maps at each frequency. These maps, which should be zero, had rms fluctuations of 0.6 mJy beam-1 (at 20 cm) and 0.7 (at 6 cm). To study the effects of the H II region, we created and CLEANed a smaller region of sky, including the remnant but cropping out the faint outer parts of the H II region, at 20 cm. The difference between this image and the larger image, both deconvolved with CLEAN, had an rms of 1.1 mJy beam-1.
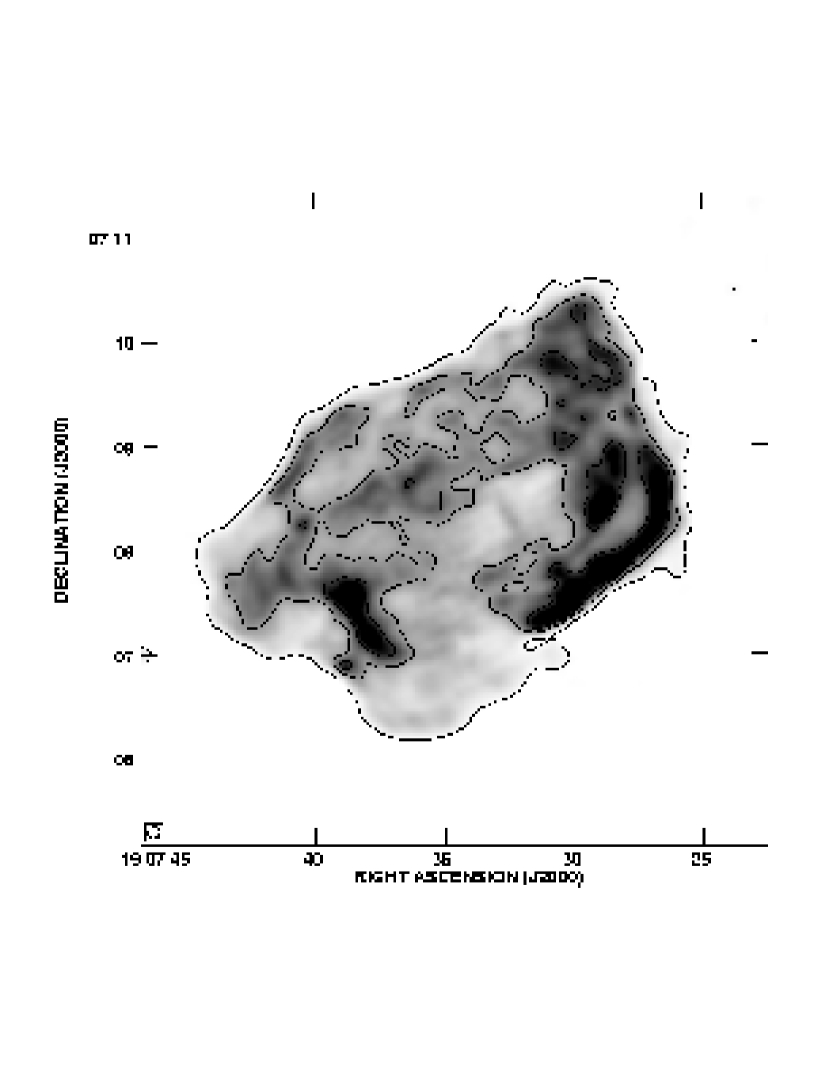
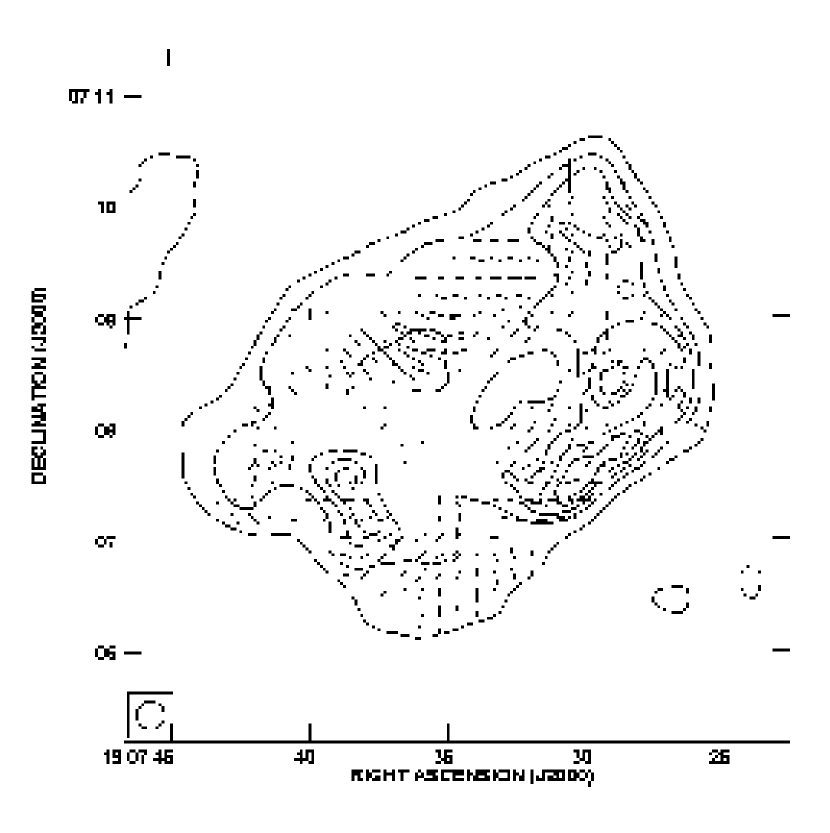
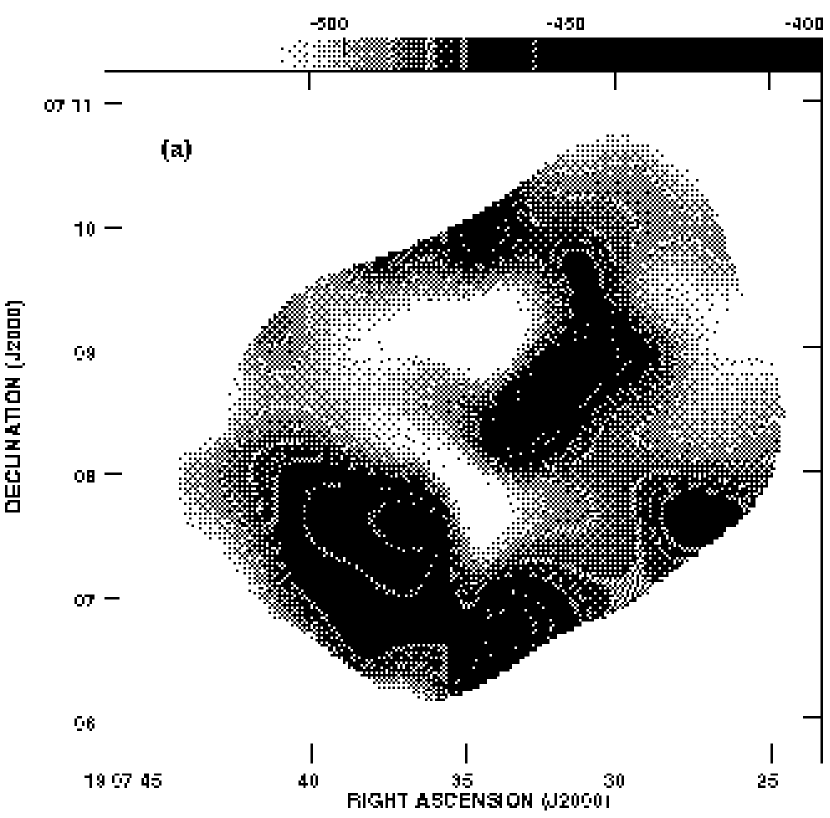
Figure 2 shows the total-intensity image at 20 cm, with a resolution of about 6″, deconvolved using VTESS (the maximum-entropy method). The lowest contour is at 1.8 mJy beam-1, 3 times the rms noise. At 20 cm the remnant is shaped like a irregular rectangle with enhanced emission evident along the southwest rim, as well as at locations interior to the southwest rim and within the southeast emission. The image agrees in overall structure with 14″ resolution images observed by Becker et al. (1985) and Anderson & Rudnick (1993). Part of the southern edge may be unresolved, while some emission can be detected outside of the rim at the southwest corner of the remnant. The 6 cm image (Figure 3) is nearly identical to the 20 cm image in structure, implying little variation in spectral index within the remnant. Little structure appears to be still unresolved at this resolution, with the possible exception of the emission at some portions of the remnant edge.
Figure 3, the 6-cm image deconvolved with VTESS, is almost indistinguishable from the 20-cm image, Figure 2. A scaled subtraction of the images (the 20-cm image less 2.2 times the 6-cm image) minimized the rms difference at 1.3 mJy beam-1, the level of uncertainty in flux baselines due to missing interferometer spacings. The factor of 2.2 over a frequency range of a factor of 3.3 gives a mean spectral index of –0.66.
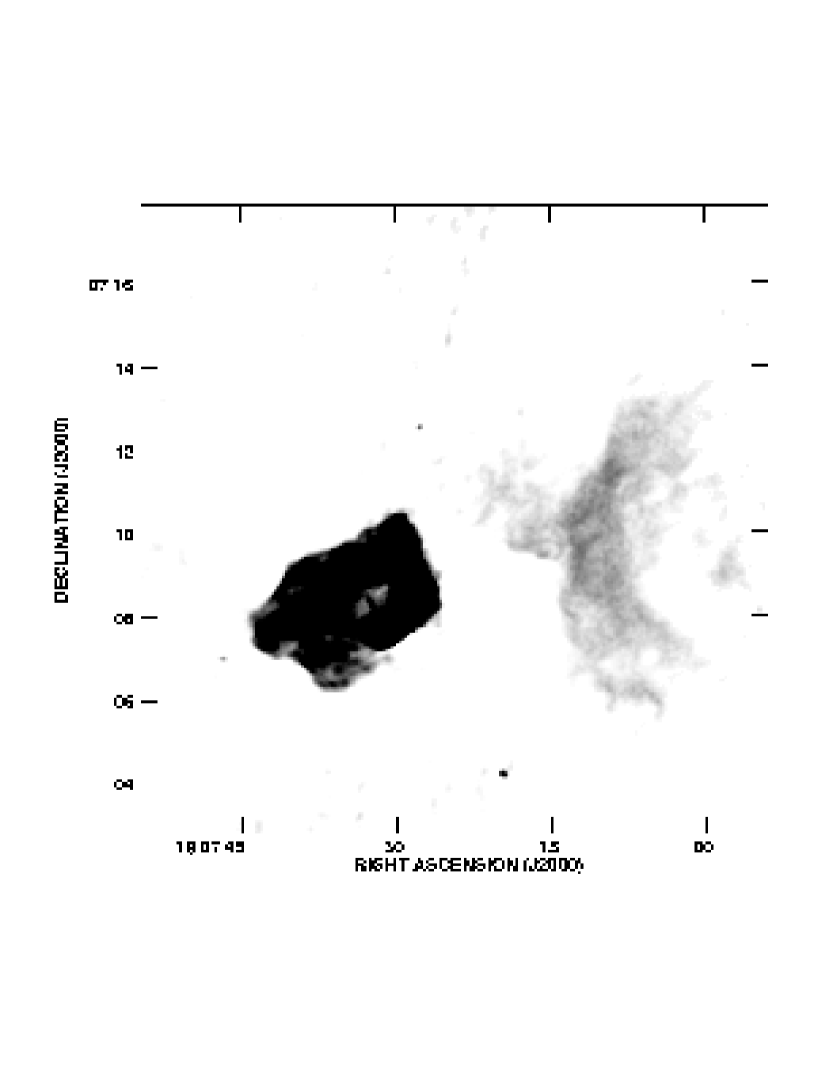
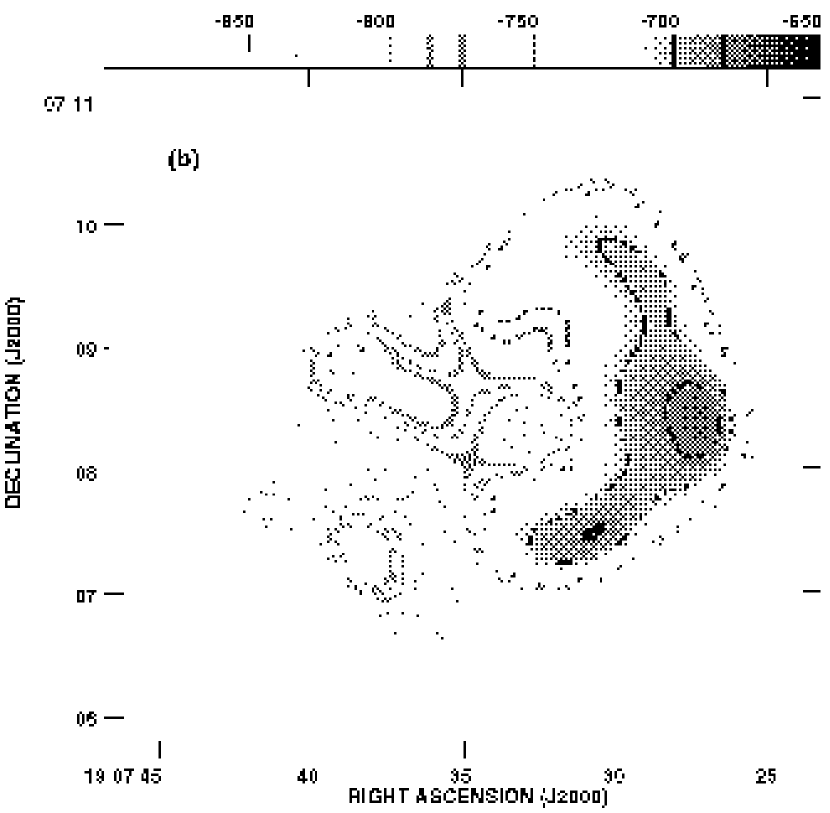
Figure 4, a 20-cm image, shows the H II region which lies to the northwest of the remnant. We detect a flux of 4.3 Jy at 20 cm from this region. Since it is too large to be fully resolved, this is a lower limit. As described above, H I absorption evidence suggests that the H II region is closer than the remnant, and our images do not show any morphological evidence of interaction. While we cannot rule out an association, we find it unlikely and shall assume the H II region is a foreground object.
If the observed H II region has an extended relatively low-density envelope, it could cover 3C 397 and account for the observed low-frequency absorption without contributing observable thermal emission. Even at the far distance of 9.3 kpc, an envelope radius of 30 pc from the brightest part of the observed H II region would cover 3C 397. A free-free optical depth of 1 at 30 MHz, as observed (Kassim 1989b), could be obtained with a temperature of 5000 K, a line-of-sight dimension of 30 pc, and a number density of 5 cm-3. These parameters would imply an emitted intensity of only 3 Jy arcsec-2 or about 0.1 mJy per beam, well below our noise levels.
3.1.2 Polarization
Images of Stokes parameters , and were made at both 6 and 20 cm to check for linear polarization (See Paper II §3.2 for a discussion of circular polarization in SNRs). The and images were convolved to a resolution of 15″ to increase sensitivity to extended emission. Polarized-flux images were created following standard procedures. A total polarized flux of 0.15 Jy was detected at 6 cm. Using a total flux density of 10.3 Jy at 6 cm from Green ’s mean spectrum, we found the mean polarized fraction (i.e. the total polarized flux divided by total flux) measured from 3C 397 at 6 cm to be 1.5% 0.1%. Alternatively, if we use our measured total flux of 5.6 Jy, we obtain 2.7% 0.1%. These values should bound the true polarized fraction.
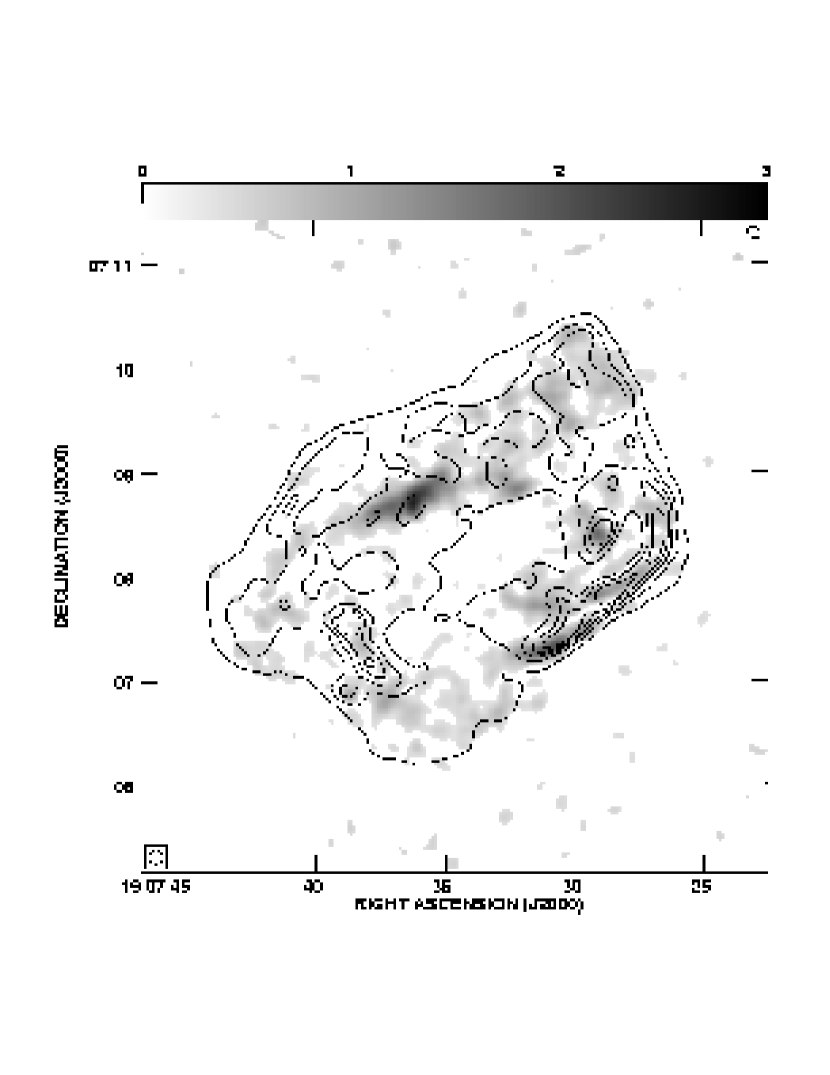
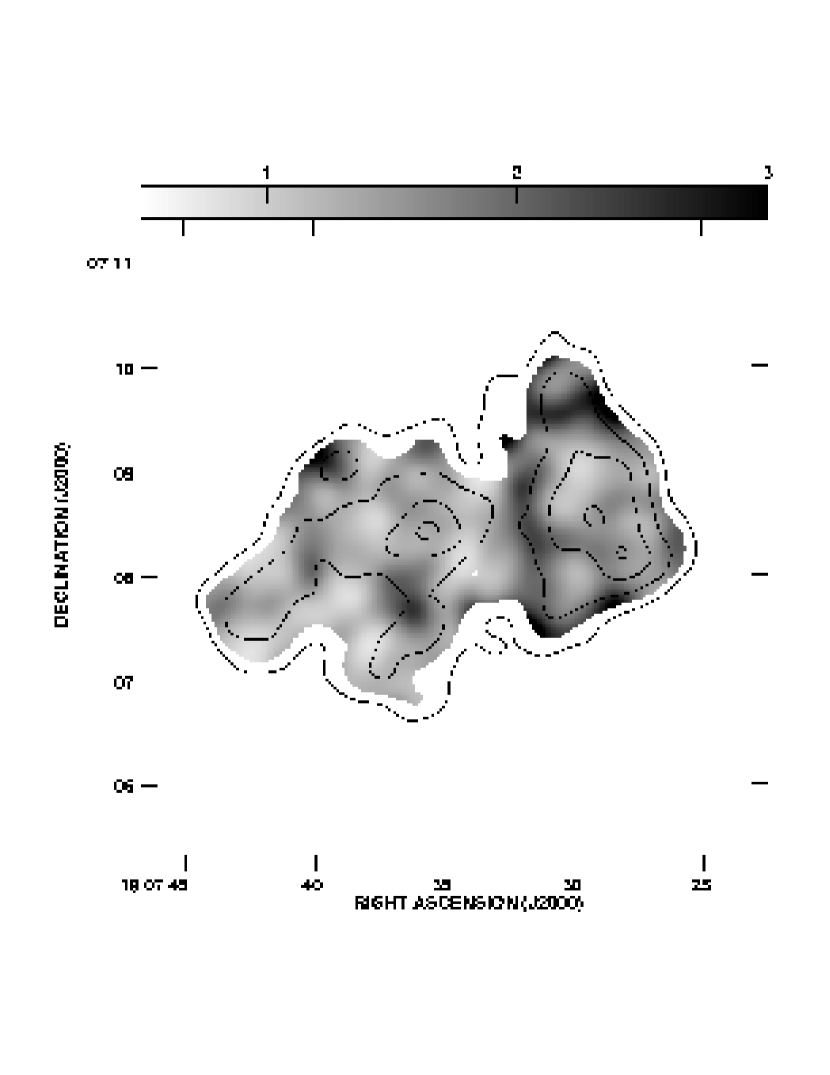
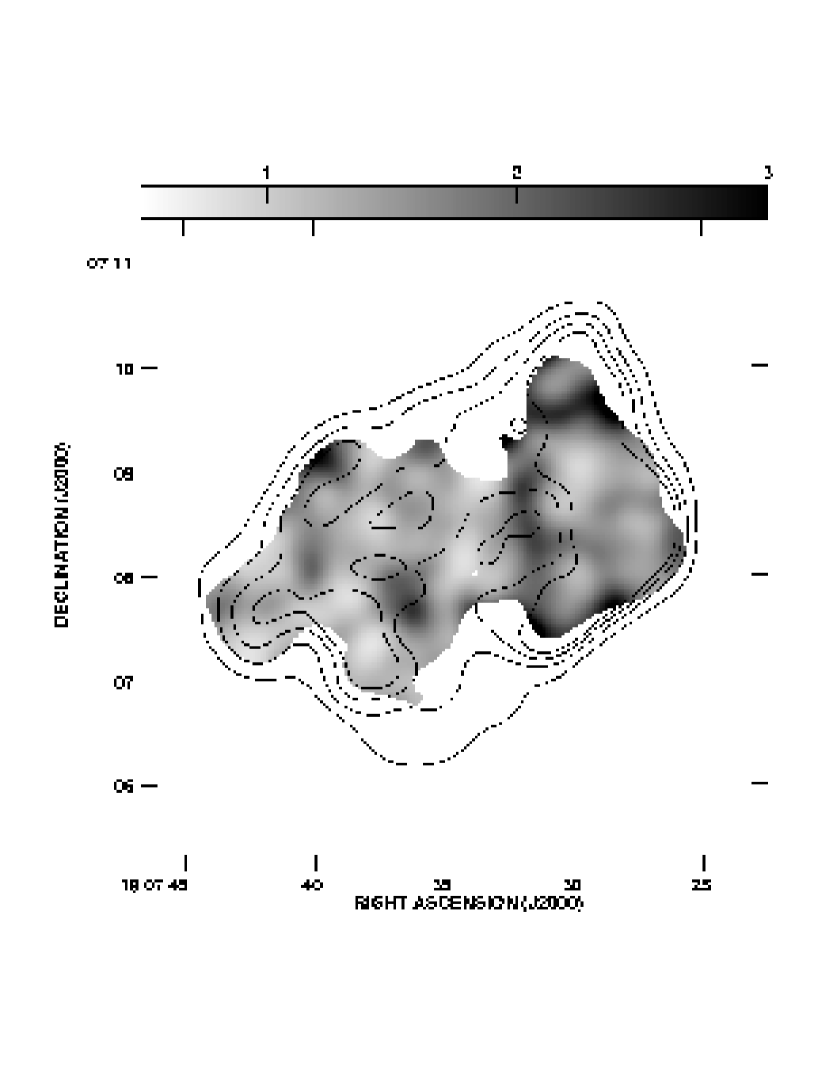
No polarization was detected at 20 cm to a limit of Jy beam-1 (corresponding to ). Due to the lack of detection at 20 cm we cannot remove Faraday rotation from the 6 cm observed electric-vector position angles. Figure 5 shows a grayscale image of the linearly polarized intensity at 6 cm, superimposed on a simple contour map of the total intensity. Figure 6 shows the polarized intensity as polarization vectors, overlaid on a total-intensity contour map, both convolved to 15″. Figure 7 shows a grayscale image of the fractional polarization, overlaid on a total-intensity contour map, convolved to 15″. Polarization structure does not correspond well to structure in total intensity. Peak polarized-fraction values approach 11%, excluding regions near the remnant edge likely due to noise.
3.1.3 Spectral Index
Given the large uncertainties in total flux of the remnant at either frequency, calculating spectral index was problematic. The integrated fluxes we observed with CLEAN (13.8 and 5.6 Jy at 20 and 6 cm, respectively) imply a spectral index for the whole remnant of . However, the VTESS fluxes of 14.1 and 6.0 give –0.72. These are considerably steeper than the spectral index quoted in Green ’s catalog of from single-dish measurements, or the value of –0.4 given by Kassim (1989b) (though both these values are partly based on confused data). Missing a uniformly distributed component of flux at the higher frequency produce both an excessively steep overall spectral index, and an artificial correlation of steeper spectra with fainter regions. The scaled subtraction of a multiple of the 6-cm VTESS map from the 20-cm map produced a difference image whose rms was minimized for a reduction factor of 2.2, implying a mean spectral index of –0.66 for the smaller-scale features. The same procedure with the CLEAN images gave –0.62. This method is impervious to constant offsets at either frequency, in the absence of strong real spectral-index variations. The result supports the idea that the true spectral index is considerably flatter than the values we obtain from our total-flux determinations. We are, however, unlikely to be missing more than a few Jy at 6 cm. If the true spectral index were –0.5 and our 20-cm flux of 14.1 Jy correct, we would be missing about 1.8 Jy at 6 cm, corresponding to only 1.5 mJy per 8″ beam. This value is less than the rms of the optimized scaled-subtraction difference map, and only slightly larger than the typical variations due to deconvolution (see above). In summary, we cannot determine a mean spectral index reliably from our data, but a value of roughly -0.6 would be consistent with our results. The flatter values of Green and Kassim may be due to use of some confused data.
We initially created a standard spectral-index map (Figure 10) whose pixels are , even though this formulation amplifies noise due to faint regions. We failed to find convincing variations of spectral index associated with any structures in radio or X-ray emission. No obvious trends of spectral index with brightness surfaced statistically, either. Figure 8 shows a scatter plot of pixel spectral index vs. brightness at 20 cm. The dispersion is substantial, especially at low flux levels, but above about 5 mJy beam-1, the mean of the distribution appears not to vary appreciably in spectral index as brightness increases. Figure 9 shows a histogram of all values of spectral index from regions of the 20 cm map brighter than 2.2 mJy beam-1. The distribution appears smooth and consistent with normally distributed errors, even though the distribution’s FWHM of about is considerably larger than the expected uncertainties of order 0.04 derived from our observed 20 cm and 6 cm flux uncertainties. There is no obvious suggestion of bimodality in the distribution as we might expect if several physically distinct regions of different spectral index were present.
However, we also examined the data using an alternative method, that of Anderson & Rudnick (1993), in which the spectral indices of regions are found by fitting regression lines to the plots of pixel brightnesses at 20 cm vs. at 6 cm over regions of specified size. We used a region corresponding to a Gaussian-weighted average with a half-width of 40″. The method finds the slope and intercept of the best straight-line fit. Errors can be estimated by comparing the values for the regression of 20 on 6-cm values with the reverse regression of 6 on 20-cm values. Since fractional errors are larger on the 6-cm image (typical fluxes less by a factor of 2.2, but noise less by only 1.2 to 1.5), one expects an asymmetry. This method was applied both to CLEAN and VTESS images; mean values of the difference images between the two regressions were 0.05 and 0.04 in spectral index, respectively, with rms scatter of 0.04 and 0.03, respectively. We conclude that an intrinsic dispersion of unavoidably characterizes the spectral-index determinations. The spectral-index images from CLEAN and VTESS maps differ by less than the two regressions on one set of data (rms 0.033). Figure 10 shows only minor variations; the steepest regions, at the edges, are almost certainly artifacts due to extra missing flux at 6 cm. Figure 10 also shows a traditional spectral-index image made from CLEANed images convolved to a resolution of 40″. There appears to be no correlation between the two spectral-index images. We conclude that our ability to discriminate true spectral-index variations is at about the level, and that to this level, we do not see obvious variations across 3C 397.
3.2. X-ray
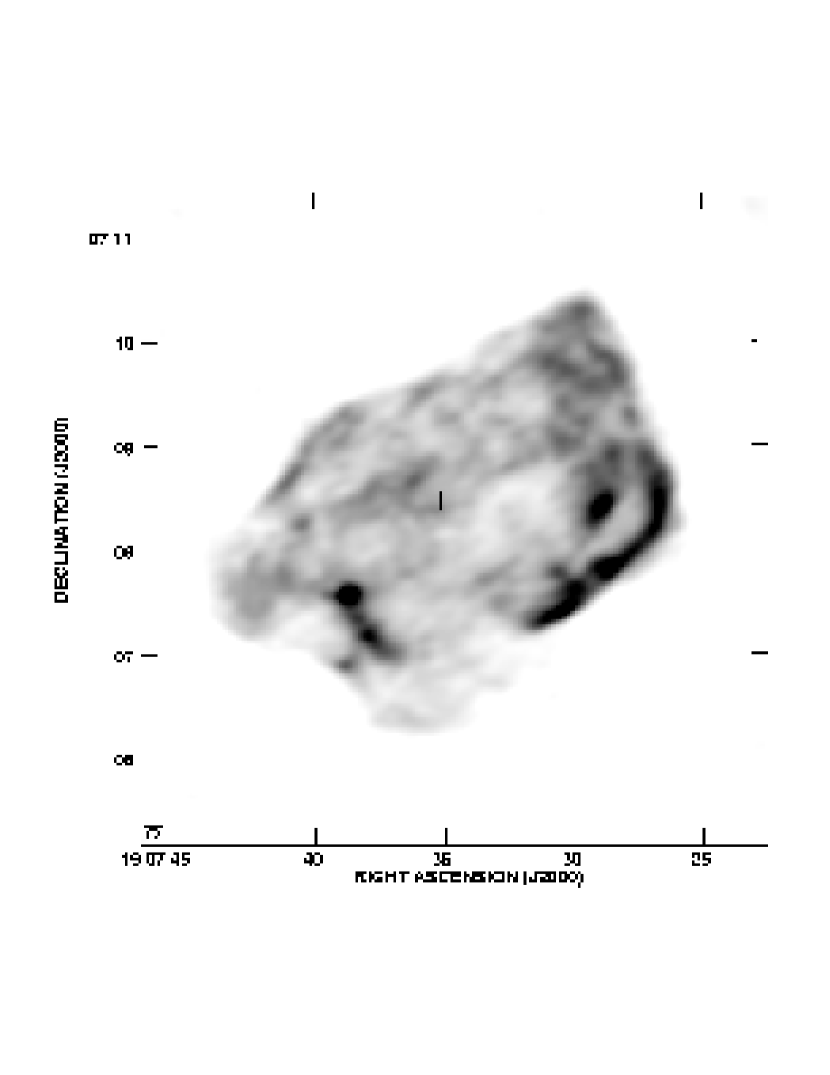
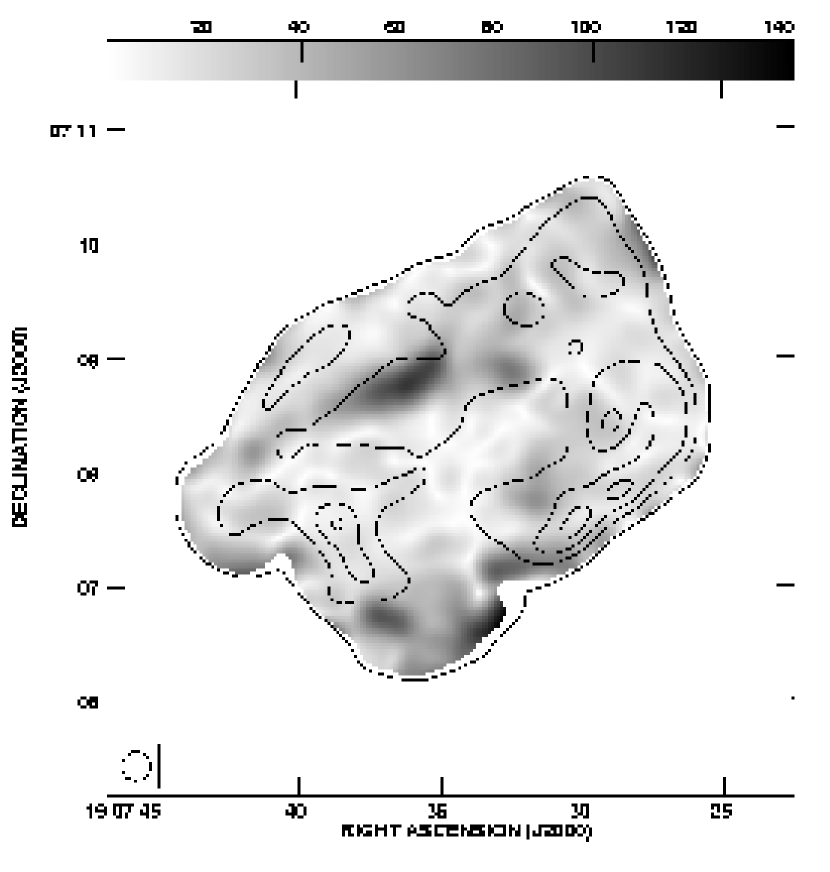
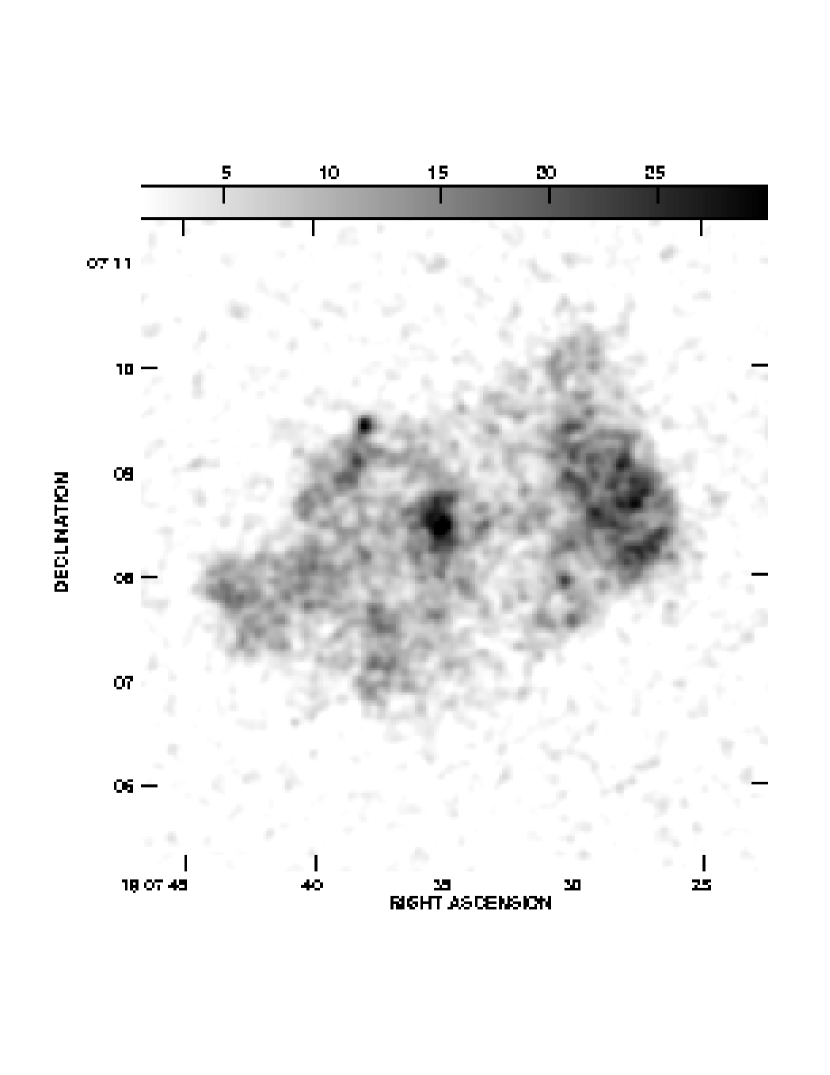
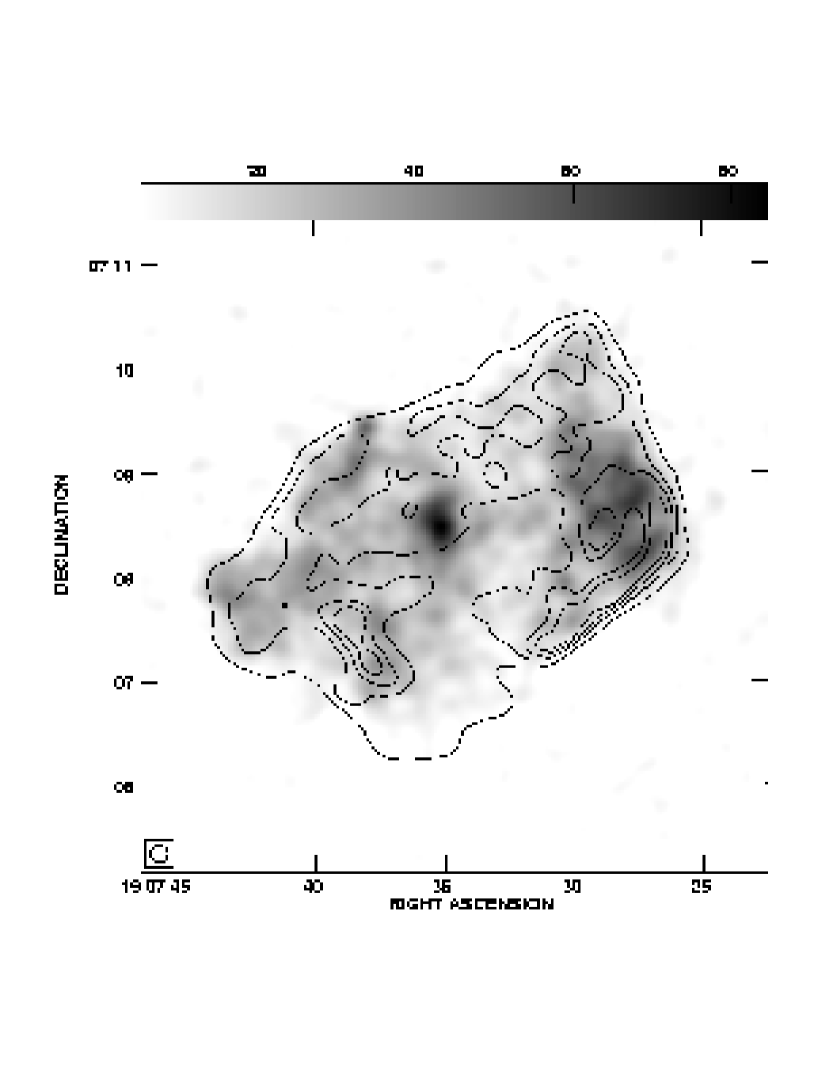
The most striking feature of the HRI image (Figure 11) is the strong resemblance between radio and X-ray morphologies. Figure 12 shows radio contours superposed on X-ray grayscale, both smoothed to 10″ resolution. The X-ray and radio edges appear coincident over most of the remnant, though in some regions such as the southern extremity the X-ray emission is relatively fainter than radio and appears to fade into the noise inside the radio edge. The brightest radio region is in the southwest corner, where strong X-ray emission is also concentrated.
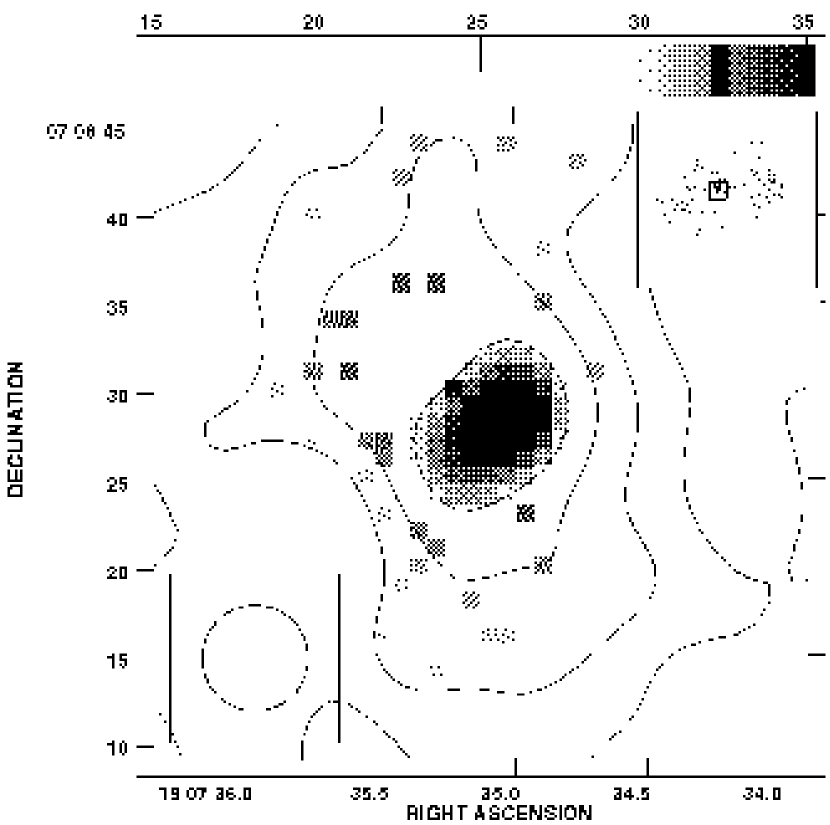
The most obvious difference between the X-ray and radio images is a bright compact central feature in the X-ray image, which has no counterpart in the radio. A Gaussian fit to the X-ray hot spot places it at 19h 7m 3513, 7° 8′ 2876. This feature, discussed more fully in § 4, is shown in detail in Figure 13. Its flux was estimated assuming the thermal spectrum described below: a poor fit, but adequate for an estimate. We obtain a flux between 0.4 and 2 keV, corrected for absorption, of about erg s-1 cm-2, or 3–5% of the remnant total (see below). At 10 kpc this is about . The feature appears to consist of an unresolved core and resolved, roughly north-south extensions in both directions. The extensions span about 30″.
We used the ROSAT HRI’s millisecond time resolution to search for pulsations from this bright region. Selecting photons from the region a circular region of radius 19″ about 19h 7m 3486, 7° 8′ 310 we searched for periodicity, using coherent fast Fourier transforms, after applying the standard barycenter corrections. The results were consistent with a non-periodic signal.
The PSPC spectrum is shown in Figure 14. Strong absorption is obvious, as should be expected for a distance of order 10 kpc (which results in a Galactocentric distance of 6.6 kpc, for a Solar Galactocentric radius of 8.5 kpc).
The data do not justify more than the simplest spectral fits; a Raymond-Smith equilibrium plasma model, which we expect to be a poor description for a relatively young remnant like 3C 397, yields a temperature of 1.8 keV and an absorption column of cm-2, with a totally unacceptable reduced of 6.3. Similar poor results are obtained for other plausible models: a one-component homogeneous nonequilibrium-ionization model (plasma at a constant temperature and density for a time ) does even worse, and a plane-shock model (a superposition of components of different ages and temperatures to simulate post-shock emission; Borkowski, in preparation) is worse yet. Oddly, a good description of the spectrum is provided by a single power-law model with a column cm-2, and an absurd energy spectral index of –7.6 (). We have thus not invested any effort in attempting to extract physically meaningful results from the PSPC spectrum, especially since ASCA spectra are available. A more complete discussion of the X-ray spectrum of 3C 397 will have to wait for more sophisticated models in conjunction with those data.
Our spectral results are similar but not identical to those of Rho & Petre (1998), who used the same dataset; small differences in binning and background subtraction account for the differences. We were also unwilling to invest effort in adjusting abundances, etc., given that the much better ASCA data are available.
The PSPC image is completely consistent with the smoothed HRI image and is not shown. However, we searched for spatial variations of the X-ray spectrum by constructing a hardness-ratio map, the ratio of counts above 1.3 keV to those below (Figure 15). This map was constructed by taking the ratio of the two appropriate images smoothed with a Gaussian. It shows only areas where the count rate is more than three times the mean background. The variations in the map are small and likely to be statistical. The superposed contours in Figure 15 show that there is no correlation between hardness and total X-ray brightness, while Figure 16 shows no correlation with radio brightness. In particular, the possibly unresolved point source in the HRI image is not associated with a harder X-ray spectrum than average. There were not enough counts in that region of the PSPC image alone to attempt spectral fitting. We should caution the reader than another remnant of similar size and brightness, G11.2–0.3, also showed no hardness variations in the ROSAT data (Reynolds et al. 1994) while actually harboring a power-law, pulsar-driven component detectable only in the ASCA data (Vasisht et al. 1996).
4. Discussion
4.1. Morphology
Our X-ray images and spectra have shown conclusively that 3C 397 is not a thermal composite or mixed-morphology remnant, since there is a strong, though not perfect, resemblance between the X-ray and radio images, including substantial edge brightening in X-rays (except for the X-ray unresolved source, discussed below). In classic thermal composites like W49 B (Paper II & Pye et al. 1984), the X-ray emission shows no hint of shell structure corresponding to the outer radio contours (Paper II ). If 3C 397 contained both a thermal shell and a thermal interior of different properties (perhaps a thermal composite in the making), one might expect spectral gradients in X-rays, which we do not see in our hardness-ratio maps. We attribute the lack of stronger limb-brightening to the same superposition effects to which we attribute the radio morphology.
Similarly, our observations confirm that 3C 397 does not contain a plerionic component. Our spectral-index images rule out a flat-spectrum component, as do those of earlier studies. Our polarimetry shows that the peak of polarization is quite weak and not coincident with the peak of radio brightness. The mysterious X-ray source is coincident with neither. (At the location of the X-ray hot spot, the polarized fraction is 0.07.) We can thus classify 3C 397 firmly as a shell remnant with good radio and X-ray correspondence.
The unusual non-circular morphology of 3C 397 is most likely a result of a non-uniform ISM, though there is no direct evidence for molecular gas in close proximity. 3C 397 is one of the least circular of the ten Galactic SNRs with highest radio surface brightness. The coincidence of radio and X-ray edges supports the idea that the radio morphology reflects the general hydrodynamics rather than some kind of synchrotron pathology.
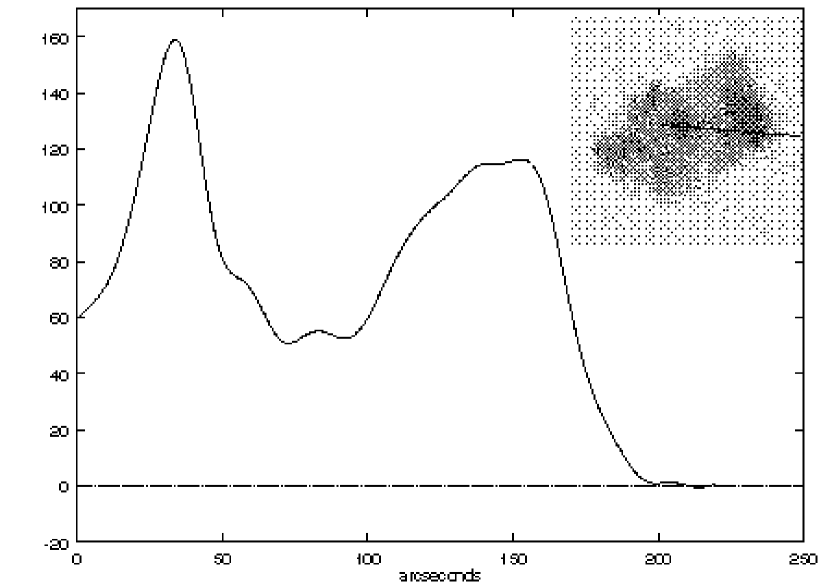
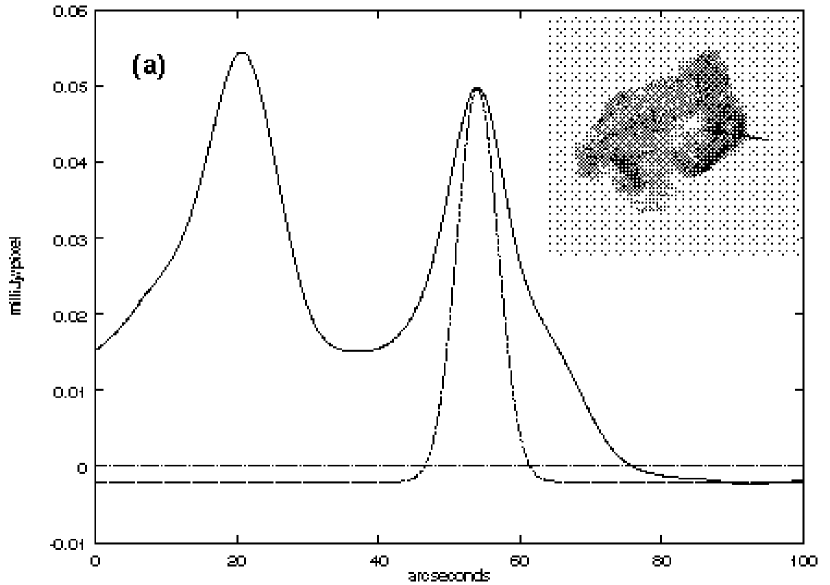
The close correspondence of X-ray and radio edges can be seen in the profiles in Figure 19. Within the limits of our resolution, it appears that the edges are in the same location, confirming that electrons are heated and accelerated in the same locations to within better than 5% of the remnant radius of 5.8 pc. The X-ray peak appears to be shifted inward by about one resolution element (6″), which may reflect slower heating processes, such as Coulomb equilibration between electrons and ions rather than instantaneous post-shock equilibration driven by some kind of plasma instabilities.
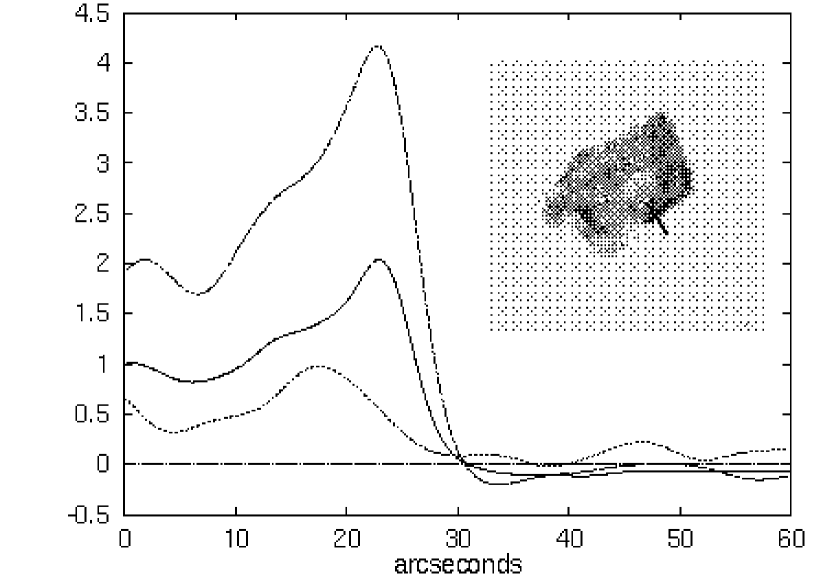
The diffusion of shock-accelerated electrons ahead of the shock should result in a “halo” of faint synchrotron emission beyond the shock itself (Achterberg et al. 1994). Unresolved radio edges can put limits on the electron diffusion coefficient by requiring any such halo to be narrower than the diffusion length of radio-emitting electrons. The edge of the remnant is most sharply defined across the south-west drop-off. We examine profiles in two places – a sharp cliff at position angle (PA) 130° and an equally well defined edge with a broad shelf at PA 100° (see Figure 18). (The position angle is measured with respect to the center of the remnant.) While the beam in its largest dimension is 5.9″at 20 cm, since the edge is featureless we assume it to be unresolved, and deduce a nominal resolution of 7.5″ at 20 cm and 6.7″ at 6 cm. The scattering ahead of the shock is related to the angle between the shock normal and the external magnetic field . We obtain an upper limit on the relativistic electron mean free path from Eq. (26) in Achterberg et al. (1994):
where is the shock velocity, is the half width at half maximum measured from the inflection point, is the distance to the object, and is a constant on the order of unity.
We estimate a shock velocity of 1600 km s-1 (see below), and measure the width to be 10″. If the distance to the remnant is 10 kpc, we calculate an upper limit to the mean free path of about cm (0.01 pc). Unless this part of the shock front happens to have a special geometry (, a highly perpendicular shock), we infer a value for between typical ISM mean free paths of 0.2 pc and the upper limits found by Achterberg et al. for Tycho’s and Kepler’s remnants of pc, indicating an intermediate strength of wave turbulence ahead of the shock. This limit will not apply if the upstream magnetic field is very close to the line of sight, so that synchrotron emission from a halo would be suppressed. However, our dynamic range of almost 20 (peak edge brightness to 3) means that the upstream magnetic field would need to be within a few degrees of the line of sight to make a halo undetectable by these observations.
4.2. Polarization and Rotation Measure
No polarization was detected at 20 cm. From the observed rms of 0.11 mJy beam-1 in Stokes and images, we deduce a limit on polarized intensity of 0.33 mJy beam-1, corresponding roughly to . Lack of detectable polarization could be due to several factors including Faraday depolarization in the source, bandwidth depolarization (large differential Faraday rotation across the bandwidth), and a highly disordered magnetic field in the source. Since we did detect some polarization at 6 cm, we suspect a combination of bandwidth depolarization and internal Faraday depolarization.
The polarization position angles we do observe (Figure 6) appear smoothly varying; some gaps appear between regions of quite different position angles, suggesting beam depolarization is causing the gaps.
Though we could not use 20 cm observations in combination with 6 cm to remove foreground Faraday rotation, we do have two independent datasets at 6 cm, at the two IF’s separated by 50 MHz, at 4836 and 4886 MHz. A large Faraday rotation (hundreds of rad m-2) could produce detectable rotation between these two frequencies. We attempted to to determine the mean Faraday rotation angle between the two IFs, since the amount of rotation was too small to yield significant values in each beam area. By subtracting the polarization angle images made from the two IF datasets, a mean rotation of 1.2∘ was found, implying a rotation measure of around +290 rad m-2. This rotation measure would rotate position angles by about between our two 20-cm frequencies of 1446 and 1496 MHz, but over a 6.25 MHz bandwidth by only about 6°. (Our choice of this narrow bandwidth was made specifically to reduce bandwidth depolarization.)
The remaining possibility to explain the lack of polarization at 20 cm is internal Faraday depolarization. If the remnant were homogeneous with an electron density cm-3 and line-of-sight magnetic field component gauss over a path length through the source of pc, the rotation measure would be rad m-2 (Spitzer 1978). For a source path of about 10 pc, and an assumed of 10 gauss, we require an electron density of 0.7 cm-3 to obtain a back-to-front rotation of radians. If changes sign randomly in cells of length , this estimate rises by We conclude that a density of a few cm-3 is adequate to explain the lack of 20-cm polarization. (The back-to-front rotation will be less at 6 cm by an order of magnitude.)
4.3. Spectral Index
We do not believe physical spectral index variations can be separated from those induced by the lack of short spacings. Because interferometers cannot detect flux smoothly distributed on larger angular scales than those corresponding to their shortest baselines, they rely on single-dish measurements. However, single-dish observations of 3C 397 are grossly inconsistent with one another. Figure 1 shows the integrated radio spectrum of 3C 397, as measured by various single dishes. From the scatter, it is clear that the mean spectral index is not well determined.
We have tried three different methods for studying spectral-index variations: straightforwardly examining maps of , subtracting the images with different relative scalings, and using a statistical method, finding the best-fit line to a plot of many pixels’ values vs. their values. All of these procedures were applied both to CLEAN and to VTESS images. All of these showed small variations, but inconsistently with one another, and inconsistent with the earlier work of Anderson & Rudnick (1993), who used the statistical approach with a somewhat smaller dataset. The variations we found implied variations in the 6-cm intensity of amounts comparable to the uncertainties in missing-flux reconstruction and to the differences between reconstruction algorithms. While there may be physical spectral-index variations in 3C 397 between 20 and 6 cm, our evidence is also consistent with an artificial dispersion in spectral-index values of about .
In fact, there are no obvious theoretical reasons to expect dramatic spectral-index variations over the relatively small range in frequencies of a factor of 3, corresponding to a factor of 1.7 in electron energies. Test-particle shock acceleration theory (e.g., Blandford & Eichler 1987) shows that unless shock Mach numbers are below 5 or so, the spectral index of synchrotron photons will vary by less than 0.1 from its asymptotic strong-shock value of –0.5. The blast waves in young remnants are expected to have shock waves with Mach numbers of 50 or higher. Nonlinear spectral calculations of electron acceleration in modified shocks (Ellison & Reynolds 1991) do predict curved electron spectra flattening to higher energy, by about 0.5 in electron energy index (0.25 in emitted photon spectral index) over a range of 100 in electron energies. Regions of stronger magnetic field would then be exhibiting lower-energy electrons, with a steeper spectrum, at a fixed observing frequency (), but to obtain a difference of 0.1 in the photon index would require magnetic-field variations of factors of order 100. This seems very unlikely. Furthermore, this idea would predict a correlation of brighter regions with steeper spectra, which is not seen.
Future progress in spectral-index studies of supernova remnants will require longer frequency baselines and the addition of well-understood single-dish data to interferometer data. The uncertainties in typical single-dish observations mean that such an attempt is likely to be quite difficult. We are forced to conclude that the question of spectral-index variations in 3C 397 in particular is unsettled at this time.
4.4. Dynamical Inferences
Even though the PSPC spectral information is meager, we can make a few deductions. The various thermal models described above, though quite different physically, give roughly the same integrated X-ray flux between 0.4 and 2 keV, corrected for absorption: erg cm-2 s-1, for an X-ray luminosity in the ROSAT band of about erg s-1. Furthermore, unless nonequilibrium and abundance effects are very large, the mean emissivity of the X-ray-emitting plasma should not differ by more than a factor of a few from the mean value for an equilibrium, cosmic-abundance plasma around 1 keV of about erg cm3 s-1. If we take the mean remnant radius to be pc, the implied number density in the interior is about
where is the source distance, the mean radius, and the filling factor of the X-ray emitting gas. An interior density of about 4 cm-3 is consistent with the estimate from radio depolarization, and implies an upstream density of about cm-3. Because of the relatively weak dependence on and , this estimate is unlikely to be very far wrong. It implies a swept-up mass of about 29 , suggesting that unless the supernova progenitor was very massive, 3C 397 should be well into transition to Sedov evolution.
If we assume Sedov dynamics and an explosion energy of erg, the observed remnant radius gives an age of 1400 yr. However, this estimate varies as , so increasing the distance to 12 kpc would increase the age by 50%. The swept-up mass varies as as well. Then the shock velocity now is km s-1. The implied post-shock temperature is 3 keV, but if ions and electrons do not equilibrate immediately, the electron temperature could be lower. It is likely that 3C 397 has not fully settled into the Sedov phase, so that the expansion has been faster and the age lower than this estimate. This also would result in a higher shock speed at present.
The high column density required by the fits, of cm-2 or higher, implies a visual extinction of , using the empirical optical extinction/column density relation of Gorenstein (1975). This would be more than sufficient to completely obscure 3C 397 at optical wavelengths, and would remove any hope of finding a record of 3C 397’s supernova among the historical supernovae.
With an approximate X-ray flux and temperature we can estimate a distance for 3C 397 by assuming it is in the Sedov phase (Kassim et al. 1994):
where is the initial energy of the SN, is the thermal X-ray emissivity in the ROSAT bandpass, is the angular diameter of the SNR in arcminutes, is the observed X-ray flux in the ROSAT bandpass, corrected for absorption, and is the post-shock temperature in K. This formulation assumes that the remnant is fully in the Sedov phase and that electron and ion temperatures are equal. The weak dependence on the emissivity means that nonequilibrium effects do not make much difference. For our values of erg cm3 s-1, , erg cm-2 s-1, K ( = 1.8 keV), and assuming a canonical explosion energy of erg, we get a distance estimate between 11 and 13 kpc – quite consistent, given the idealized assumptions, with that obtained from H I observations. Certainly ASCA data will allow a more detailed and accurate fit (Safi-Harb et al. 1999).
4.5. The Nature of the Unresolved X-ray Source
The X-ray hot spot has no counterpart at radio wavelengths, in total intensity or polarization. It is also not apparent in the hardness-ratio map. However, since the feature represents less than 7% of the total X-ray emission, a spectral anomaly could easily be lost in the narrow ROSAT band, especially since absorption effectively limits the band to only a factor of 4 in photon energy. We consider various explanations for this feature.
We can roughly estimate the luminosity of the feature by assuming a spectral shape of the best-fitting Raymond-Smith spectrum described above ( keV): we obtain about erg s-1 at a distance of 10 kpc, after correcting for absorption. The least interesting explanation would involve a density inhomogeneity, perhaps in relatively unmixed ejecta where the synchrotron emissivity might be expected to be small (since the ejecta carry only the highly diluted stellar magnetic field).
However, the unresolved core could certainly be a remnant neutron star, seen either in thermal emission or in pulses. The thermal luminosity of a neutron star with K ( keV) and a radius of 15 km would be several times 1034 erg s-1. However, this very soft thermal emission would require a much greater luminosity to provide the observed flux of the hot spot behind cm-2. While quantitative statements are difficult in view of all the uncertainties, it is likely that thermal emission from a neutron star would be too soft to produce the observed unresolved spot. In any case, we would still need to attribute the extended portion of the feature to some density enhancement in the thermal gas.
A mini-plerion is unlikely due to the various arguments made above, but might still be possible if the population of low-energy radio-emitting electrons is somehow depleted. Since it is not clear where the Crab Nebula’s radio-emitting electron population comes from (Kennel and Coroniti 1984), this might not be too far-fetched. This explanation could take care of the resolved part of the feature as well. The limits on direct pulsations are weak, but we have observed 3C 397 with XTE and the examination of this dataset could either produce, or put much stronger limits on, X-ray pulses.
The low luminosity rules out a standard X-ray binary with characteristic temperature of order a keV or higher. To reach the luminosity of even relatively weak low-mass X-ray binaries of around erg s-1 would require that the unresolved core be at a distance of only 2 kpc, superposed by chance against 3C 397 (and on top of the resolved feature). No star or other optical feature can be seen at the hot spot position on Palomar Sky Survey images. However, an anomalously soft-spectrum X-ray binary would need to be more luminous to produce the observed flux. Finally, the feature could be a chance background quasar at 1000 Mpc, with a typical active galactic nucleus X-ray luminosity of order erg s-1, as long as any associated radio emission was faint enough to be hidden in the remnant’s interior radio emission.
The source is made to order for observations with the Chandra Observatory (AXAF). Its small angular size will allow optimal use of Chandra’s high angular resolution, and there should be enough spectral information in Chandra’s much larger X-ray bandpass to separate the very distinct spectral predictions of the different explanations: very soft blackbody spectrum for a cooling neutron star; optically thin plasma for a density bump; nonthermal, featureless power-law for a plerion. Of course Chandra’s CCDs will also do a good job obtaining spatially resolved spectra for a better understanding of the entire remnant.
5. Conclusion
Our radio and X-ray study of 3C 397 has at least settled its nature as a thermal shell remnant without an obvious plerionic component, but it has produced several more interesting questions. The relatively good correspondence between radio and X-ray morphologies puts 3C 397 in a sequence from the historical shells such as Tycho and Cas A, with excellent correspondences, to the still radio-bright but clearly more evolved objects like W49 B in which the X-ray morphology bears little relation to the radio. This correspondence provides more evidence for 3C 397’s youth. The PSPC spectrum is poorly fit by any reasonable model, and may require a composite model including ejecta. Such a study demands spectral data of at least the quality of ASCA.
We find weak mean radio polarization of % at 6 cm, with polarized flux not well correlated with total radio intensity or with X-rays (and no polarization feature coincident with the X-ray hot spot). That low fraction, and our failure to detect any polarization at 20 cm, are consistent with internal Faraday depolarization by material with a mean density of about 4 cm-3 as derived from the X-ray fitting.
In agreement with past studies, we find relatively small radio spectral-index variations over the narrow range in wavelengths from 20 to 6 cm. It should be remembered that this range covers only a factor of 1.7 in electron energies, and large spectral-index variations would cause the integrated spectrum to show significant concave curvature. The poor state of total-flux observations of 3C 397 cannot, however, rule out such a situation.
The X-ray data in the 0.5 – 2 keV PSPC band do not allow detailed spectral fits, but can be roughly described by an equilibrium plasma with a temperature of about 1.8 keV. The observed X-ray flux implies the mean density of 4 cm-3 just mentioned. Simple dynamical estimates then give a remnant age of order yr, and a current shock velocity of about 1600 km s-1.
The mysterious central X-ray source must be studied with an instrument with sensitivity at higher energies, as well as higher spatial resolution. The Chandra X-ray Observatory will be an ideal choice. X-ray observations to higher energies, along with more sophisticated spectral modeling, will be the best way to improve our understanding of 3C 397 and its evolutionary stage.
References
- (1) Achterberg, R. D., Blandford, R. D., & Reynolds, S. P. 1994, AJ, 281,220
- (2) Anderson. M. C., & Rudnick, L. 1993, ApJ, 408, 514
- (3) Becker, R. H., Markert, T., & Donahue, M. 1985, ApJ, 296, 461
- (4) Blandford, R. D., & Eichler, D. 1987, Phys.Rep., 154, 1
- (5) Caswell, J. L., Murray, J. D., Roger, R. S., Cole, D. J. & Cooke, D. J. 1975, A&A, 45, 239
- (6) Caswell, J. L., Haynes, R. F., Milne, D. K. & Wellington, K. J. 1982, MNRAS, 200, 1143
- (7) Cersosimo, J. C. & Magnani, L. 1990, A&A, 239, 287
- (8) Downes, D., Wilson, T. L., Bieging, J. & Wink, J. 1980, A&AS, 40, 370
- (9) Ellison, D. C., & Reynolds, S. P. 1991, ApJ, 382, 242
- (10) Elvis, M., Plummer, D., Schachter, J., & Fabbiano, G. 1992, ApJS, 80, 257
- (11) Gorenstein, P. 1975, ApJ 198, 95
- (12) Green D.A. 1998, A Catalogue of Galactic Supernova Remnants (1998 September version), Mullard Radio Astronomy Observatory, Cambridge, United Kingdom (available on the World-Wide-Web at “http://www.mrao.cam.ac.uk/surveys/snrs/”).
- (13) Kassim, N. E. 1992, AJ, 103, 943
- (14) Kassim, N. E. 1989a, ApJ, 347, 915
- (15) Kassim, N. E. 1989b, ApJS, 71, 799
- (16) Kassim, N. E., Hertz, P. , Van Dyk, S. D. & Weiler, K. W. 1994, ApJ, 427, L95
- (17) Kennel, C. F. & Coroniti, F. V. 1984, ApJ, 283, 710
- (18) Koyama, K., Petre, R., Gotthelf, E. V., Hwang, U., Matsura, M., Ozaki, M., Holt, & S. S. 1995, Nature 378, 255
- (19) Moffett, D. A. & Reynolds, S. P. 1994, ApJ, 425, 668
- (20) Moffett, D. A. & Reynolds, S. P. 1994, ApJ, 437, 705
- (21) Pohl, M. & Esposito, J. A. 1998, ApJ, 507, 327
- (22) Pye, J.P., Becker, R.H., Seward, F.D., & Thomas, N. 1984, MNRAS, 207, 649
- (23) Reich, W., & Reich, P., & Fürst, E. 1990, A&A Suppl. Ser. 83, 539
- (24) Reynolds, S. P., Lyutikov, M., Blandford, R. D. & Seward, F. D. 1994, MNRAS, 271, L1
- (25) Rho, J., & Petre, R. 1997, ApJ, 484, 828
- (26) Rho, J. & Petre, R. 1998, ApJ, 503, L167
- (27) Safi-Harb, S., Petre, R., Arnaud, K.A., Borkowski, K., Reynolds, S.P., Dyer, K.K., Keohane, J.W., 1999 in preparation
- (28) Saken, J. M., Fesen, R. A. & Shull, J. M. 1992, ApJS, 81, 715
- (29) Spitzer, L. 1978, Physical Processes in the Interstellar Medium, p. 66
- (30) Tanimori, T., et al. 1998, ApJ, 497, L25
- (31) Vasisht, G., Aoki, T., Dotani, T., Kulkarni, S. R. & Nagase, F. 1996, ApJ, 456, L59


| 19h 7m 33s | 7° 8′ 16″ | |
|---|---|---|
| (VLA pointing position) | ||
| Galactic | 41° 07′ 0″ | –00° 18′ 27″ |
| Spectral Index | 0.48a | |
| Integrated Flux at 1 GHz | 22 Jya | |
| Distance | 10 kpc | |
| Mean radius | 2′ at 10 kpc = 6 pc |
References. — (a) Green 1998
| Date | Configuration | Frequency (MHz) | Bandwidth (MHz) | Integration Time (m) |
|---|---|---|---|---|
| 1991 Apr 12 | D | 4847 | 25.00 | 52 |
| 1468 | 6.25 | 65 | ||
| 1990 Oct 21 | C | 4847 | 25.00 | 59 |
| 1468 | 6.25 | 60 | ||
| 1990 Aug 21,22 | B | 1468 | 6.25 | 60 |
| Wavelength | Resolution | Detected SNR Emission | rms |
|---|---|---|---|
| CLEAN | |||
| 6 cm | 6.4 x 5.6″ PA -59° | 5.6 Jy | 0.41 mJy beam-1 |
| 20 cm | 6.9 x 6.6″ PA 84° | 13.8 Jy | 0.51 mJy beam-1 |
| VTESS | |||
| 6 cm | 6.9 x 5.5″ PA -74° | 6.0 Jy | 0.19 mJy beam-1 |
| 20 cm | 6.1 x 5.7″ PA 85° | 14.1 Jy | 0.29 mJy beam-1 |
| Method | 6 cm (mJy beam-1) | 20 cm (mJy beam-1) |
|---|---|---|
| Theoretical | 0.05 | 0.10 |
| Stokes | 0.05 | 0.11 |
| CLEAN | 0.41 | 0.51 |
| VTESS | 0.19 | 0.29 |
| Parameter | HRI | PSPC |
|---|---|---|
| Cycle | A05 | A03 |
| Date | 1994 Oct 14-21 | 1992 Sept 28 |
| Pointing center | 19h 07m 336 | |
| (J2000) | 7° 08′ 240 | |
| Exposure (ks) | 6.2 | 4.2 |
| Counts | 1200 | 2700 |
| Effective Resolution | 6″FWHM | 30″ |
| Field of view | 38′ x 38′ | 2°(diameter) |
| Energy sensitivity | 0.1-2.0 keV | 0.1-2.4 keV |