Restarting activity in the giant radio galaxy J1835+620
Abstract
We present radio and optical observations of the peculiar radio galaxy J1835+620, a member of a new sample of large angular size radio galaxies selected from the NRAO VLA Sky Survey. Its optical counterpart is in a group of at least three galaxies and shows strong, narrow emission lines which allow us to measure its redshift as . The derived cosmological distance places J1835+620 among the giant radio galaxies. The outstanding aspect of J1835+620 at radio wavelengths is the existence of two symmetric bright components within a typical Fanaroff-Riley type II structure. We interpret the source as the result of two distinct phases of core activity. Radio maps and radio polarization properties are consistent with a dense new ejection evolving through an older underlying jet. We suggest that interaction with nearby galaxies could be the reason for restarting the activity in J1835+620.
Key Words.:
Galaxies: individual: J1835+620 – Galaxies: active – Galaxies: jets – Radio continuum: galaxies1 Introduction
Radio sources are born, grow and finally…sleep. This evolutionary process can be inferred from the diversity of known radio sources: compact symmetric objects are likely to be young radio sources (Readhead et al. readhead (1996)); Fanaroff-Riley radio galaxies of type I and II (Fanaroff & Riley fanaroff (1974)) may be considered “adult” sources; finally, relic sources are probably associated with galaxies which have ceased their nuclear activity (Komissarov & Gubanov komissarov (1994); Harris et al. harris (1993)). If we believe that the activity in radio-loud active galactic nuclei is the result of accretion onto a compact massive object, likely a black hole, the life of a radio source would be subordinated to the accretion rate. The vanishing of accretion would lead a former radio source to a “dormant” or hibernation phase. Such a picture is supported by the increasing number of massive dark objects detected in inactive galaxies (see Kormendy & Richstone kormendy (1995)). However, interaction and merging with neighboring galaxies can trigger the activity, and eventually produce a transition from a dormant to an active phase (Stockton & Mackenty stockton (1983); Bahcall et al. bahcall (1997) and references therein).
Under such a scenario, it should be expected that a number of radio sources with clear evidences of having passed through different phases during their lifetime are found. A promising candidate is the radio source 3C338, with a large-scale structure apparently unrelated to the present nuclear activity (Giovannini et al. giovannini (1998)). Other sources, like 3C219 (Clarke et al. clarke2 (1992)) or 3C33.1 (Rudnick rudnick2 (1985)), show indication of episodic events possibly resulting from an alternation of high and low activity phases.
In this paper, we present VLA observations of the radio source J1835+620, made within the frame of the study of a new sample of large angular size radio galaxies (Lara et al., in preparation) selected from the NRAO VLA Sky Survey (NVSS; Condon et al. nvss (1998)). Optical imaging and spectroscopy of the host galaxy made at the Calar Alto Observatory are also presented. No previous studies of this radio source have been found in the literature. J1835+620 presents, as its main peculiarity, clear signs of two distinct phases of nuclear activity.
2 Observations and results
2.1 Radio observations
We made continuum observations of J1835+620 with the VLA in its B- and C-configurations at 1.4, 4.9 and 8.5 GHz (see Table 1 for details). The radio sources 3C286 and/or 3C48 served as primary flux density calibrators. The interferometric phases of J1835+620 were calibrated using the nearby radio sources J1927+612 (at 1.4 and 4.9 GHz) and J1849+670 (at 8.5 GHz). The processes of self-calibration and imaging of the data in total intensity and polarization were carried out with the NRAO AIPS package, following standard procedures. Maps at 4.9 and 8.5 GHz had to be corrected for primary beam attenuation; such effects were negligible on the 1.4 GHz maps. Polarization maps were corrected for the non-Gaussian-like noise distribution of the polarized intensity.
| Array | Duration | Date | ||
|---|---|---|---|---|
| (MHz) | (MHz) | (min) | ||
| B | 1442 | 50 | 8 | 18 Feb 97 |
| B | 4860 | 100 | 10 | 18 Feb 97 |
| B | 8460 | 100 | 30 | 7 Oct 98 |
| C | 1425 | 50 | 10 | 29 Dec 98 |
| C | 4860 | 100 | 10 | 29 Dec 98 |
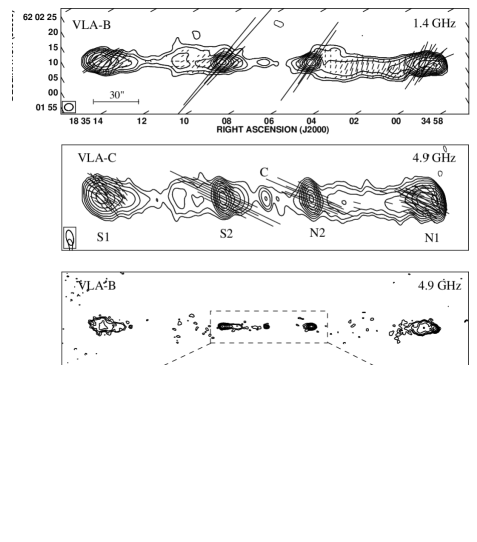
Radio maps of J1835+620 are displayed in Fig. 1, after having been rotated clockwise on the sky by 60°. At first sight, a very peculiar radio structure is evident: a compact central core (labeled C in Fig. 1) and two radio lobes (N1 and S1) straddling two bright components (N2 and S2). The total source angular size is , the arm-ratio not being significantly different from unity. The angular distance between components S2 and N2 is , with an arm-ratio of 0.95 (south to north). From our highest angular resolution observations, we determine the following coordinates for the compact core (J2000): RA ; DEC .
Although the structure of J1835+620 is very symmetric, there are differences between the two sides of the source: the northern arm shows a continuous and well collimated bridge of emission joining components N1 and N2; the southern arm presents a similar bridge, but with a clear discontinuity in between. Both bridges have a similar spectral index (the spectral index is defined so that ). The N1 lobe has a higher flux density than S1, while N2 is weaker than S2. Finally, the N1 lobe hosts a compact hot-spot, while no hot-spot of similar characteristics is observed in the S1 lobe.
The radio core presents signs of flux density variability: our observations at 4.9 GHz, spanning 20 months, show a core flux density decrease from 2.1 mJy at 1997.13 to 1.5 mJy at 1998.99, a variation well above the flux density calibration errors (%).
Electric field vectors with lengths proportional to the polarized intensity are also displayed in Fig. 1. The mean fractional polarization () reaches 20% in N2 and S2, and about 12% in N1 and S1, at 1.4 and 8.5 GHz. However, at 4.9 GHz we measure only % in N2 and S2 and % in N1 and S1. Since different frequency observations show clear signs of Faraday rotation of the polarization vectors, we made a pixel by pixel evaluation of the rotation measure () over the entire source in order to test if such a drop in the mean fractional polarization could be produced by small scale fluctuations in the rotation measure distribution. However, at each position the derived is, within errors, always compatible with the mean determined from component N2: rad m-2 with an intrinsic position angle of the electric vector of . As a consequence, the drop in the mean fractional polarization at 4.9 GHz can hardly be ascribed to beam depolarization or to finer structure in the distribution; its origin remains unclear to us. Unfortunately, VLA B-configuration observations at 4.9 GHz could not be properly calibrated in polarized intensity due to insufficient coverage of the paralactic angle.
Flux densities (S), spectral indexes () and mean fractional polarizations () of components N1, N2, C, S1 and S2 are displayed in Table 2 for the different frequencies of observation. Although our maps might be affected by missing flux density (marginally at 1.4 GHz and 4.9 GHz; more importantly at 8.4 GHz since the C-array was not used), we note that this mainly affects regions not considered in the flux density and spectral index measurements in Table 2. As a test, we compared the flux density of the different components measured from the VLA-C and the VLA-B maps at 4.9 GHz, obtaining compatible results. Moreover, the spectral index does not show the remarkable steepening which should be expected if significant flux density were unrecovered at 8.4 GHz in these components.

| Component | S1.4 | S4.9 | S8.5 | |||||
| (mJy) | (mJy) | (mJy) | (%) | (%) | (%) | |||
| N1 | 227 | 79 | 52 | 0.87 | 0.73 | 12 | 5 | 13 |
| N2 | 90 | 33 | 19 | 0.82 | 0.88 | 19 | 8 | 20 |
| C | 2.3 | 1.5a | 1.2 | 0.07 | 0.40b | 2 | 3 | 2 |
| S2 | 139 | 51 | 29 | 0.82 | 0.91 | 20 | 8 | 18 |
| S1 | 149 | 53 | 28 | 0.85 | 0.97 | 15 | 5 | 9 |
| Total | 746 | 248 | 135 | 0.91 | 1.05 | – | – | – |
|
a Flux density at epoch 1998.99
b Derived from non-simultaneous epochs: 1998.77 and 1998.99 |
||||||||
2.2 Optical imaging and spectroscopy
We made optical observations of J1835+620 centered on the position of the radio core on the night of 1998 October 30 at the 2.2m telescope in Calar Alto (Spain). We used the Calar Alto Faint Object Spectrograph (CAFOS) equipped with a SITe CCD. CAFOS allows direct imaging and spectroscopy, with a spatial scale of per pixel. We used a medium resolution grism (200Å/mm), sensitive to the wavelength range of 4000 to 8500 Å , that provides a spectral resolution of 4.47 Å/pixel. The image and spectrum obtained are shown in Fig. 2.
To identify and position the optical counterpart of the radio core, we first obtained a single 300s exposure image in the R-band, finding a galaxy coincident with the radio core. Then, with the long slit configuration (with a wide slit placed north-south) we obtained a spectrum of 2400s in two equal exposures, to be added up in order to reject the cosmic rays. We measured a seeing of FWHM using the foreground stars in the R image. The data reduction and calibration were performed following the standard procedures with the IRAF111IRAF is the Image Reduction and Analysis Facility made available to the astronomical community by the National Optical Astronomy Observatories, which are operated by the Association of Universities for Research in Astronomy (AURA), Inc., under contract with the U.S. National Science Foundation. software, involving dark and flat field corrections. Wavelength calibration was carried out using exposures of mercury-helium-rubidium lamps taken before and after the target exposure. No flux calibration was attempted as the atmospheric conditions were not photometric. We finally extracted and summed 10 spectra centered with respect to the core position, corresponding to an extension of . The slit and the extracted region are shown in Fig. 2.
The 1-D spectrum shows a very weak continuum (barely visible in the 2-D spectrum), with prominent H, [OII] and [OIII] narrow emission lines, from which we determine a redshift z=0.518.
In Fig. 2 we also show an enlargement of the central of the image deconvolved using Lucy’s algorithm within IRAF, with a resulting FWHM of . In addition to the radio core host galaxy, elongated along north-south direction and with an extension to the west, we clearly detect the presence of two other galaxy-like objects in the very close vicinity, one at to the west and the other at to the south.
The estimated redshift of J1835+620 implies a total radio source length of 1.12 Mpc ( corresponds to 4.81 kpc in linear distance, assuming H km s-1 Mpc-1 and q), placing J1835+620 among the giant radio galaxies. The distance implied between components N2 and S2 is 309 kpc. The two nearby galaxies are at a projected distance of 28.4 kpc (west galaxy) and 26.0 kpc (south galaxy) from the radio core host galaxy.
3 Discussion
The most distinguishing aspect in J1835+620 is the existence in its radio structure of two symmetric and bright components within a typical FR II radio source. This fact prompts us to invoke scenarios of restarting or recurrent activity in active galactic nuclei (Christiansen christiansen (1973)). At first sight, the apparent source symmetry does not favor models in which ejections from the nucleus occur on only one side at a time (“flip-flop” mechanism, e.g. Rudnick & Edgar rudnick1 (1984)). Instead, ejections in J1835+620 appear to be simultaneous, supporting scenarios in which the activity of the central core is alternately switched on and off. Accordingly, the morphology of J1835+620 could well be the consequence of two periods of activity in the core, separated by a “dormant” phase. We note that restarting activity resembles the commonly observed ejection of moving components in parsec-scale jets. But while such components are most possibly due to the propagation of shock waves along continuous jets (Marscher & Gear marscher (1985)), at megaparsec scales much more dramatic physical conditions would be required.
Clarke & Burns (clarke1 (1991)) have made 2-D numerical simulations of restarting jets evolving through a medium already “cooked” by the original ejection. They find a number of properties which should distinguish new ejections from original ones. First, the new ejection is always denser than the surrounding medium if the original jet is “under-dense” relative to the intergalactic medium (IGM). This is because the new jet evolves in a hot and rarefied medium processed by the original jet. As a consequence, the advance speed of the restarted jet is greater than that of the original one, while the Mach number is lower. Second, the bow shock and the terminal Mach disk in the new jet are of comparable strength. Therefore, if no bow shock is observed, the emission from the new jet should be weak. However, recent 3-D simulations show a well-defined bow shock leading the restarting jet (Clarke clarke3 (1996)). Finally, the numerical simulations show that without the momentum flux of the jet an existing hot-spot in a lobe would expand rapidly, decreasing dramatically its level of synchrotron emission in a time short compared to the on-off duty cycle.
We wish to understand if the restarting scenario really describes what is happening in J1835+620. If so, components N2 and S2 would represent the evolution of a new ejection, and this situation must leave traces in the new components which we should identify.
3.1 Radio spectral properties
The existence of a hot-spot in N1 poses difficulties for the assumption of a core whose activity has been completely switched off and resumed some time later. If the N1 lobe were the result of an already exhausted phase of activity, the presence of a compact hot-spot would be difficult to explain without a continuous supply of momentum flux (Clarke & Burns clarke1 (1991)). The most natural explanation is that the lobes are still supplied through an underlying jet, while N2 and S2 are the result of a dramatic increase in the core activity.
This scenario is supported by the comparison of the spectral ages of components N1 and S1 with those of N2 and S2: considering that no significant differences in the spectral break frequencies can be inferred from our data, we obtain a synchrotron spectral age of yr for components N1 and S1, and of yr for components N2 and S2. In this calculation we assume a break frequency of 20 GHz consistent with our observations, minimum energy conditions and take into account the Inverse Compton losses due to the interaction with the microwave background. The estimated age of the “new” components is in agreement with a dynamical age derived from an expansion velocity of 0.20-0.25 c; the synchrotron age of the “old” components requires an unplausible expansion velocity of 0.5 c. Therefore, spectral ages are not consistent with an exhausted primary phase of activity, implying that N1 and S1 are still supplied by fresh particles. An underlying jet must exist in J1835+620, through which the new components, N2 and S2, evolve. This scenario would explain the absence of a bow shock preceding these new components (Clarke clarke3 (1996)), since N2 and S2 would propagate through an already existing jet.
3.2 Magnetic field
The study of the magnetic field configuration is a powerful tool to test and constrain the restarting model requirements. Fig. 3 displays the orientation of the projected magnetic field in J1835+620, once corrected for Faraday rotation. Components N2 and S2 have a magnetic field parallel to the jet axis. On the other hand, component N1 shows the typical structure of a cocoon expanding in the IGM medium, with the magnetic field compressed at the hot-spot, and parallel to the cocoon edges. Component S1, however, does not show evidence of compression, compatible with the absence of a bright hot-spot. The fact that the magnetic field is parallel in N2 and S2 means that little or no compression affects the evolution of the new components, in favor of an over-dense ejection with respect to the underlying jet. That would indicate that the two activity phases in the core of J1835+620 produce jets with different properties.
The origin of the differences in flux density between components N2 and S2 remains unclear to us. They could be due to intrinsic differences in the ejection, or to differences in the medium of propagation, or to a combination of these with orientation related effects.
The uniformity of the over J1835+620 places, most plausibly, the ionized screen producing Faraday rotation outside the radio source. Since the expected of galactic origin at the position of J1835+620 is much smaller than measured (Simard-Normandin & Kronberg normandin (1980)), the origin of Faraday rotation in J1835+62 would most likely be associated with the existence of an ionized halo surrounding the galaxy. We do not find evidence of asymmetric depolarization in this radio source (the so called Laing - Garrington effect, Laing laing (1988); Garrington et al. garrington (1988)). Assuming the existence of a halo, this fact could be explained if the source main axis were lying close to the plane of the sky. This orientation, consistent with the morphological symmetry of the radio source, would explain the very low flux density of the core (if unification schemes of radio-loud active galactic nuclei (e.g. Antonucci antonucci (1993)) are correct), and favors J1835+620 being a giant radio galaxy.
3.3 Restarting activity
The reasons for restarting, or more properly, amplifying the activity in the core of J1835+620 remain a mystery. It is already known that galaxy interaction and merging can trigger nuclear activity (Stockton & Mackenty stockton (1983); Bahcall et al. bahcall (1997)). Our optical image shows that the radio core of J1835+620 resides in a galaxy which belongs to a group of at least three galaxies showing marginal signs of mutual interaction. It is thus tempting to suggest that interactions in this group of galaxies could be associated with the different stages of radio activity in J1835+620. Deeper optical images and spectroscopy of the other two members of the group might shed light into this conjecture.
Other interpretations for J1835+620 could in principle be considered. Clarke et al. (clarke2 (1992)) proposed, and applied on 3C219, a “passive magnetic field” model in which the observed jet interruptions would be a consequence of a transition from a dominant axial magnetic field to a dominant toroidal field occurring at the position where a force balance between a continuous jet and the surrounding medium is attained. However, we do not observe the predicted magnetic field transitions in J1835+620 (see Fig 1), rendering this model implausible. On the other hand, arguments based on recollimation shocks to explain components N2 and S2 have difficulty in explaining the extraordinary symmetry of this source.

4 Conclusions
Radio and optical observations of J1835+620 have been presented. The observations were made in the frame of the study of a new sample of large angular size radio sources selected from the NVSS. The R-band optical image shows a galaxy coincident with the radio core position. There are other two galaxies closely seen in projection. The spectrum of the core host galaxy shows a very weak continuum, but prominent narrow emission lines from which we determine a redshift . Consequently, with an angular radio size of , J1835+620 is classified as a giant radio galaxy.
J1835+620 shows a very peculiar radio structure, with two symmetric bright components within a typical Fanaroff-Riley type II structure. Given the extraordinary symmetry of the radio source (S1 to N1 arm-ratio = 1; S2 to N2 arm-ratio = 0.95), we interpret it using the model of restarting activity in radio galaxies. Two distinct phases of core activity would be responsible for the observed morphology.
Observational properties have been compared with predictions from 2-D numerical simulations by Clarke & Burns (clarke1 (1991)). The existence of a hot-spot in N1 together with spectral aging arguments indicate that N1 and S1 are still supplied by fresh particles, implying i) the existence of an underlying jet connecting the core with the outer components and ii) that the activity in J1835+620 did not stop completely. In consequence, the new components N2 and S2 would represent the result of a new ejection propagating through the primary underlying jet. The parallel magnetic fields of components N2 and S2 are consistent with a “second-phase” jet which is overdense with respect to the “first-phase” one.
Faraday rotation of the polarization vectors is observed, with a distributed rather uniformly all over the source. We suggest that the rotation is produced by an ionized halo surrounding the radio source. Asymmetric depolarization is not observed, which could be explained if the main source axis were oriented approximately parallel to the plane of the sky. This orientation would also be consistent with the large size of the source and with the low flux density of the core.
The conditions under which a galaxy can change its degree of nuclear activity remain unknown. Interaction between galaxies is often invoked as a reason for triggering nuclear activity. We find hints that interaction of the galaxy hosting the radio core with nearby galaxies might be taking place, but this point has to be confirmed through deeper optical imaging and spectroscopy of the members of the group of galaxies.
Acknowledgements.
We thank the referee Dr. J. Condon for helpful and constructive comments to the paper. This research is supported in part by the Spanish DGICYT (PB97-1164 and PB93-0139). GG acknowledges the Italian Ministry for University and Research (MURST) for financial support under grant Cofin98-02-32. The National Radio Astronomy Observatory is a facility of the National Science Foundation operated under cooperative agreement by Associated Universities, Inc.References
- (1) Antonucci R., 1993, ARA&A, 31, 473
- (2) Bahcall J.N., Kirhakos S., Saxe D.H. & Schneider D.P., 1997, ApJ, 450, 486
- (3) Christiansen W.A., 1973, MNRAS, 164, 211
- (4) Condon J.J., Cotton W.D., Greisen E.W., Yin Q.F., Perley R.A., Taylor G.B., Broderick J.J., 1998, AJ, 115, 1693
- (5) Clarke D.A. & Burns J.O., 1991, ApJ, 369, 308
- (6) Clarke D.A., Bridle A.H., Burns J.O., Perley R.A., Norman M.L., 1992, ApJ, 385, 173
- (7) Clarke D.A., 1996, BAAS, 189, 4004
- (8) Fanaroff B.L. & Riley J.M., 1974, MNRAS, 167, 31
- (9) Garrington S.T., Leahy J.P., Conway R.G, Laing R.A., 1988, Nature, 331, 147
- (10) Giovannini G., Cotton W.D., Feretti L., Lara L., Venturi T., 1998, ApJ, 493, 632
- (11) Harris D.E., Stern C.P., Willis A.G., Dewdney P.E., 1993, AJ, 105, 769
- (12) Komissarov S.S. & Gubanov A.G., 1994, å, 285, 27
- (13) Kormendy J. & Richstone D., 1995, ARA&A, 33, 581
- (14) Laing R.A., 1988, Nature, 331, 149
- (15) Marscher A.P & Gear W.K., 1985, ApJ, 298, 114
- (16) Simard-Normandin, M. & Kronberg P.P., 1980, ApJ, 242, 74
- (17) Readhead A.C.S, Taylor G.B., Xu W., Pearson T.J., Wilkinson P.N., Polatidis A.G, 1996, ApJ, 460, 612
- (18) Rudnick L. & Edgar B.K., 1984, ApJ, 279, 74
- (19) Rudnick L., 1985, in Physics of Energy Transport in Extragalactic Radio Sources, ed. A.H. Bridle & J.A. Eilek, 35
- (20) Stockton A. & MacKenty J.W., 1983, Nature, 305, 678