THE EUROPEAN LARGE AREA ISO SURVEY: ELAIS
Abstract
The European Large Area ISO Survey (ELAIS) has surveyed square
degrees of the sky at 15m and 90m and subsets of this
area at 6.75m and 175m using the Infrared Space Observatory
(ISO). This project was the largest single open time programme executed
by ISO, taking 375 hours of data.
A preliminary catalogue of more than 1000 galaxies has been
produced. In this paper we describe the goals of the project,
describe the follow-up programmes that are in progress,
and present some first scientific results including
a provisional number count analysis at 15 and 90m .
Key words: ISO; infrared astronomy; surveys; starburst galaxies; AGN.
1. INTRODUCTION
The European Large Area ISO Survey (ELAIS) is a collaboration involving 19 European institutes (in addition to the authors and others at their institutes the following people and others at their institutes are involved I. Gonzalez-Serrano, E. Kontizas, R. Mandolesi, J. Masegosa, K. Mattila, H. Norgaard-Nielsen, M. Ward) and is the largest open time project being undertaken by ISO.
In this paper we describe some of the key scientific goals of ELAIS and give a brief description of the survey, comparing it with other ISO surveys. We give a preliminary discussion of the 15 and 90 m source-counts and describe the follow-up programme now under way at a wide range of wavelengths, giving some first scientific results.
2. KEY SCIENTIFIC GOALS
In this section we highlight some of the principal scientific motivations for this programme, though naturally there are many other goals which we do not have space to discuss.
-
The main extra-galactic population detected by IRAS was galaxies with high rates of star formation. These objects are now known to evolve with a strength comparable to AGN. The sensitivity of ISO allow us to detect these objects at much higher redshifts and thus obtain greater understanding of the cosmological evolution of star formation. This is directly complementary to studies of star-formation history in the optical and UV. Comparison of the star-formation rates determined in the FIR with that determined from the UV will give a direct estimate of the importance of dust obscuration, vitally important for models of cosmic evolution.
-
If elliptical galaxies underwent a massive burst of star-formation between , they would be observable in the far infrared and may look like IRAS F10214+4724. This survey will provide a powerful discrimination between such a top-down scenario and any hierarchical bottom-up merging model whose components are individually too faint to detect.
-
Unified models of AGN suggest that the central engine is surrounded by a dusty torus. The mid and far infrared emission from the torus is much less sensitive to the viewing angle than the optical. Thus a mid and far infrared selected sample of AGN will place important constraints on unification schemes.
-
IRAS uncovered a population with enormous far infrared luminosities, . While many of these objects appear to contain an AGN it is argued that star formation could provide most of the energy. Interestingly, most of these objects appear to be in interacting systems, suggesting a triggering mechanism. Exploration of this population to higher redshift will have particular significance for models of AGN/galaxy evolution.
3. THE ELAIS SURVEY
The ISO observations began on 12th March 1996 and ended on 8th April 1998, shortly before the exhaustion of the Helium coolant. The total survey area covered in blank fields is 6, 11, 12, & 1 sq. deg. at 6.75, 15, 90 and 175 m , and an additional 2 sq. deg. within the ELAIS survey areas has been surveyed at 175 m by the FIRBACK team (Puget et al 1999). Table 1 specifies the main survey areas. A full description of the survey will be given by Oliver et al (1999).
As part of the follow-up programme described below, we have embarked on surveys of these same areas at X-ray, ultraviolet, visible, near infrared, submillimetre and radio wavelengths. Table 2 shows the wavelengths and areas covered (or planned to be covered in allocated observing time) across the whole electromagnetic spectrum. The surveys at 2-10 keV, U, K, 850 m and 21 cm will be among the largest area surveys in these wavebands, to these sensitivities, being undertaken. Thus ELAIS has developed from its original concept as a survey at 15 and 90 m into a powerful multiwavelength survey across the entire electromagnetic spectrum.
| Name | Nominal Coordinates | M | N | ROLL | ||
|---|---|---|---|---|---|---|
| J2000 | /∘ | /∘ | /∘ | |||
| N1 | 2.0 | 1.3 | 20 | 1.2 | ||
| N2 | 2.0 | 1.3 | 30 | 1.1 | ||
| N3 | 2.0 | 1.3 | 330 | 0.9 | ||
| S1 | 2.0 | 2.0 | 20 | 1.1 | ||
| S2 | 0.3 | 0.3 | 290 | 1.1 | ||
| Band | 2-10keV | 6.7 | 15 | 90 | 175 | 850 | 21cm | ||||
| Area (sq degs) | 0.15 | 6 | 1 | 13 | 1 | 6 | 11 | 12 | 3 | 0.1 | 8.2 |
| Depth | 22.5 | 23 | 23.5 | 19.5 | 1 | 3 | 100 | 100 | 8 | 0.1-0.4 | |
| Units | CGI | mag | mag | mag | mag | mJy | mJy | mJy | mJy | mJy | mJy |
| Galaxies | 30000 | 3000 | 1104 | 1618 | 390 | 100 | 1448 | ||||
| Stars | 15000 |
4. COMPARISON WITH OTHER ISO SURVEYS
ISO carried out a variety of surveys exploring the available parameter space of depth and area (cf the review by Oliver (1998)). Table 3 summarizes the main ISO extra-galactic blank-field surveys. It is clear that information will be available at a wide range of ISO wavelengths, and to a wide range of sensitivities, and that together these surveys will provide a powerful probe of the infrared sky. The ELAIS survey will play a key role because of its large area and the numbers of sources detected (see Table 2 for numbers found in our Quick-Look Analysis).
| Survey Name | [e.g. ref] | Wavelength | Integration | Area |
| m | s | |||
| PHT Serendipity Survey | Bogun et al 96 | 175 | 0.5 | 7000 |
| CAM Parallel Mode | Siebenmorgen et al 96 | 7 | 150 | 33 |
| ELAIS | 7,15,90,175 | 40, 40, 24, 128 | 6, 11, 12,1 | |
| CAM Shallow | Elbaz et al 98 | 15 | 180 | 1.3 |
| FIR Back | Puget et al 99 | 175 | 256, 128 | 1, 3 |
| IR Back | Mattila et al 99 | 90, 135,180 | 23, 27, 27 | 1, 1, 1 |
| SA 57 | Norgaard-Niielson et al 97 | 60, 90 | 150, 50 | 0.42,0.42 |
| CAM Deep | Elbaz et al 98 | 7, 15, 90 | 800, 990, 144 | 0.28, 0.28, 0.28 |
| Comet fields | Clements et al 99 | 12 | 302 | 0.11 |
| CFRS | Hammer and Flores 98 | 7,15,60,90 | 720, 1000, 3000,3000 | 0.067 |
| CAM Ultra-Deep | Elbaz et al 98 | 7 | 3520 | 0.013 |
| ISOHDF South | Oliver et al 99b | 7, 15 | 4.7e-3, 4.7e-3 | |
| Deep SSA13 | Taniguchi et al 97 | 7 | 34000 | 2.5e-3 |
| Deep Lockman | Kawara et al 98 | 7, 90, 175 | 44640, 48, 128 | 2.5e-3, 1.2 , 1 |
| ISOHDF North | Serjeant et al 97 | 7, 15 | 12800, 6400 | 1.4e-3, 4.2e-3 |
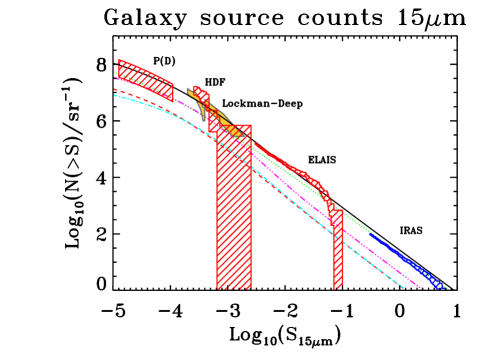
5. PRELIMINARY NUMBER COUNTS
Source catalogues have been extracted from the ELAIS data at all wavelengths and a preliminary source count analyses have been performed at 15 and 90 m . The 15 m results are shown in Figure 1, where we have included results from our HDF-N survey (Oliver et al 1997, Aussel et al 1998), from the ISO Deep survey in the Lockman hole (ref) and extrapolated from IRAS 12 m counts (Verma 1999). The models shown are from Pearson and Rowan-Robinson (1996) and agree well with the data. Similar agreement is found for the models of Franceschini et al (1997). As can been seen these counts confirm the strong evolution detected in the ISO HDF analysis (Oliver et al 1997). A more detailed analysis of the 15 m counts will be presented shortly (Serjeant et al 1999).
The counts at 90 m (Fig 2) are extremely preliminary, since there are still major uncertainties in the calibration and there is so far no detailed correction for incompleteness due to the variable effects of cosmic rays. However they show reasonable consistency at the bright end with counts at 90 m interpolated from IRAS 60 and 100 m data and demonstrate that we should be reasonably complete at least to 100 mJy. A more detailed discussion of the 90 m counts will be given by Efstathiou et al (1999).
Results from our northern and southern 21 cm surveys have already been published (Ciliegi et al 1999, Gruppioni et al 1999) and show good consistency with earlier sub-mJy radio surveys. These radio surveys represent a very substantial expansion of the area of the sky surveyed to sub-mJy sensitivities and the follow-up of these radio surveys will be a very interesting project in its own right.


6. FOLLOW-UP
An extensive follow-up programme is being undertaken, including measurements at all wavelengths from X-ray to radio (Tables 2 and 4). This programme will provide essential information for identifying the types of objects detected in the infrared, their luminosities, energy budgets and other detailed properties. As well as studying the properties of the objects detected by ISO a number of the follow-up surveys will provide independent source lists which will be extremely valuable in their own right, not least because we can investigate why some objects emit in the infrared and others do not. As we emphasized above ELAIS has become a deep multi-wavelength survey of these 12 sq degrees of sky, which will have impacts on a wide range of extragalactic astrophysics. The wealth of multi-wavelength information will make ELAIS areas a natural focus for future surveys, for example with WIRE, SIRTF, XMM and FIRST.
Preliminary optical identifications have already been made for several hundred 15 and 90 m and 21 cm sources and these have been the subject of several spectroscopic runs (see Table 4). Results from spectroscopy of 90 m galaxies with R 18 in the south using FLAIR and the ESO/Danish 1.5m telescope will be published shortly (Linden et al 1999). As expected the galaxies tend to be normal spirals or starbursts. We will also be reporting the first results from spectroscopy of 15 m and 21 cm galaxies using 2dF and the ESO 3.6m and NTT telescopes (Gruppioni et al 1999, La Franca et al 1999). Figure 3 shows the spectrum of a z=2.59 quasar found in our first 2dF run. Taking into account those galaxies which are too faint for their spectra to be classifiable, about 20-40 of the 15 m galaxies for which we have spectra so far are AGN (QSO, Sey 1, Sey 2 or NELG), broadly consistent with expectations of the models of Pearson and Rowan-Robinson (1996) and Franceschini et al (1998).
In conclusion it is clear that the ELAIS project will not only meet its original scientific goals, but will also provide the basis for a series of powerful multiwavelength surveys over the next decade.
| Telescope | shiftsnights | Projects |
|---|---|---|
| AXAF | 150ks | X-ray Survey in N1, N2 |
| ESO 3.6m | 3 | Optical Imaging |
| Optical Sepctroscopy | ||
| ESO NTT | 9 | NIR Photometry |
| Optical Spectroscopy | ||
| ESO 2.2m | 13 | NIR Photometry |
| ESO/Dan. 1.5m | 35 | Optical Survey |
| Optical Photometry | ||
| Optical Spectroscopy | ||
| AAT | 2 | Optical Spectroscopy (2dF) |
| NIR Spectroscopy | ||
| INT | 13 | Optical Survey |
| NIR Survey | ||
| CFHT | 1 | Integral Field Spectroscopy |
| Calar Alto 3.6m | 8 | Optical Spectroscopy |
| NIR Photometry | ||
| Calar Alto 2.2m | 2 | Optical Spectroscopy |
| UK Schmidt | 2 | Optical Spectroscopy (FLAIR) |
| Mt.Hopkins | 12 | NIR Photometry |
| ITRF | 5 | NIR Photometry |
| IAC 0.8m | 28 | Optical Photometry |
| ESA OGS 1.m | 4 | Optical photometry |
| ATNF CA | 10 | 21 cm Survey |
| VLA | 6 | 21 cm Survey |
7. ACKNOWLEDGEMENTS
This paper is based on observations with ISO, an ESA project, with instruments funded by ESA Member States (especially the PI countries: France, Germany, the Netherlands and the United Kingdom) and with participation of ISAS and NASA. This work was in part supported by PPARC grant no. GR/K98728 and EC Network is FMRX-CT96-0068.
References
- 1 Aussel H. et al, 1998, AA (in press), astro-ph/9810044
- 2 Bogun, S., et al., 1996, A&A, 315L, 71
- 3 Ciliegi P. et al. , 1999, MNRAS (in press) astro-ph/9805353
- 4 Clements D., et al. , 1999, (in prep.)
- 5 Clements D., et al. , 1998, astro-ph/9809054
- 6 Efstathiou A., et al, 1999, in preparation
- 7 Elbaz D., 1997, ‘Taking ISO to the Limits’ Laureijs R. & Levine D., (ESA)
- 8 Elbaz D. et al. , 1998, astro-ph/9807209
- 9 Franceschini A., et al. , 1994, ApJ, 427, 140
- 10 Franceschini A. et al, 1998, ApJ (in press), astro-ph/9806077
- 11 Gruppioni C. et al, 1999, in preparation
- 12 Hammer, F., Flores, H., 1998, astro-ph/9806184
- 13 Kawara, K. et al. , 1998, AA 336, 9
- 14 LaFranca F., et al, 199, in preparation
- 15 Linden M., et al, 1999, in preparation
- 16 Mattila K. et al. , 1999 (in prep.)
- 17 Nørgaard-Nielson H.U., et al, 1997, ‘Taking ISO to the Limits’ Laureijs R. & Levine D. (ESA)
- 18 Oliver S.J. et al, 1997, MNRAS, 289, 471
- 19 Oliver S., 1998, in ’Highlights of the ISO Mission: Special scientific session of the IAU General Assembly, Kyoto’, ed D.Lemke et al (Kluwer) in press
- 20 Oliver S.J. et al, 1999, (in prep.)
- 21 Pearson C. and Rowan-Robinson M., 1996, MN 283, 174
- 22 Puget J.-L. et al, 1999, astro-ph/9812039
- 23 Rowan-Robinson M., et al, 1991, MN 249, 729
- 24 Serjeant, S.B.G., et al, 1997, MNRAS, 289, 457
- 25 Serjeant, S.B.G., et al, 1999, (in prep.)
- 26 Siebenmorgen, R.; , et al., 1996, A&A, 315L. 169
- 27 Taniguichi Y., et al, 1997, ‘Taking ISO to the Limits’ Laureijs R. & Levine D., (ESA)
- 28 Verma A., 1999, in preparation